
Abstract
Signaling networks are essential elements that are involved in diverse cellular processes. One group of fundamental components in various signaling pathways concerns protein tyrosine kinases (PTK). Various toxicants have been demonstrated to exert their toxicity via modulation of tyrosine kinase activity. The present study aimed to identify common cellular signaling pathways that are involved in chemical-induced direct immunotoxicity. To this end, an antibody array-based profiling approach was applied to assess effects of five immunotoxicants, two immunosuppressive drugs and two non-immunotoxic control chemicals on the phosphorylation of 28 receptor tyrosine kinases and 11 crucial signaling nodes in Jurkat T-cells. The phosphorylation of ribosomal protein S6 (RPS6) and of kinases Akt, Src and p44/42 were found to be commonly regulated by immunotoxicants and/or immunosuppressive drugs (at least three compounds), with the largest effect observed upon RPS6. Flow cytometry and Western blotting were used to further examine the effect of the model immunotoxicant TBTO on the components of the mTOR-p70S6K-RPS6 pathway. These analyses revealed that both TBTO and the mTOR inhibitor rapamycin inactivate RPS6, but via different mechanisms. Finally, a comparison of the protein phosphorylation data to previously obtained transcriptome data of TBTO-treated Jurkat cells resulted in a good correlation at the pathway level and indicated that TBTO affects ribosome biogenesis and leukocyte migration. The effect of TBTO on the latter process was confirmed using a CXCL12 chemotaxis assay.
Introduction
Signaling networks are important elements involved in diverse cellular processes, such as appropriate responses to the extracellular environment, inter- and intra-cellular communication, metabolism and cell cycle regulation. Errors in intra-/inter-cellular communication give rise to certain diseases such as cancer, diabetes and autoimmunity (Berg et al., Citation2002). Protein tyrosine kinases (PTK), enzymes that catalyze the transfer of phosphate groups from ATP to tyrosine residues of their protein substrates, are fundamental components of diverse signaling pathways. In the human genome, 58 tyrosine kinases are identified as receptor types (RTK) and 32 are non-receptor types (nRTK) (Robinson et al., Citation2000).
PTK are of widespread interest not only because of their intrinsic physiological functions, but also their roles in the toxicity of various immuno-toxicants. For instance, the immunotoxic effects of benzo[α]pyrene has been linked to activation of the nRTK Fyn kinase and ZAP-70 kinases in human HPB-ALL T-cells (Davila, Citation1999). The heavy metal mercuric chloride (HgCl2) has been shown to exert its immunotoxic effects via activation of Src-family kinases such as Hck (nRTK) in human hematopoietic cells (Robbins et al., Citation2000). PTK have also been of interest as drug targets in the treatment of malignant diseases such as cancer. For instance, the antibodies trastuzumab (anti-ErbB2) and cetuximab (anti-EFGR) are used in treatment of, respectively, ErbB2+ breast cancer and EGFR+ colorectal cancer (Tworkoski et al., Citation2011). Regarding immunologic disorders, activation of ephrin receptors, for instance the EphA4 and EphB2 receptors, have been linked with autoimmune diseases (Mikasova et al., Citation2012; Munro et al., Citation2013).
In a previous study (Shao et al., Citation2013), we assessed the effects of a wide range of compounds on the transcriptome of the human Jurkat T-cell line in vitro with the aim to identify common mechanisms underlying direct immunotoxicity, which is defined as the toxicological effect of a compound on components of the immune system leading to immunosuppression or immunostimulation. The reason for selecting the Jurkat cell line was because several studies indicated that responses of Jurkat cells to immunotoxic chemicals are comparable with responses of primary immune cells (Katika et al., Citation2012; Shao et al., Citation2013). Several general processes including ER stress, oxidative stress, regulation of cell cycle and anti-apoptosis were affected by immunotoxicants in common. The present work sought to identify cellular signaling pathways that are commonly modulated by immunotoxicants at the protein phosphorylation level and to connect these signaling pathways to cellular functions, thereby defining potentially novel modes of action of direct immunotoxicants. For this purpose, Jurkat cells were exposed to a subset of the immunotoxicants used in the previous transcriptomics study, i.e. lindane, ochratoxin A, TBTC, TBTO and DON, the immunosuppressive drugs rapamycin and mycophenolic acid and the non-immunotoxicants urethane and mannitol. Upon treatment of the cells, effects on phosphorylation of a set of 39 signaling proteins were assessed using receptor tyrosine kinase (RTK) antibody arrays. This set included 28 RTK and 11 proteins belonging to other important signaling networks.
Our results suggested that various immunotoxicants affect the phosphorylation of ribosomal protein S6 (RPS6) in human T-cells, an important downstream effector of the mTOR pathway. Further investigation into this pathway with the model immunotoxicant TBTO showed that TBTO affects the kinase p70S6K (upstream regulator of RPS6) but via a different mechanism than the immunosuppressive drug rapamycin, a selective inhibitor of mTOR. Finally, the comparison of the transcriptome and protein phosphorylation data of TBTO-treated Jurkat cells revealed both known and novel signaling networks that mediate the cellular response to TBTO.
Materials and methods
Chemicals and antibodies
All chemicals tested were purchased from Sigma-Aldrich (Zwijndrecht, The Netherlands). Stock solutions of all chemicals were made by dissolving each in dimethyl sulfoxide (DMSO; Merck, Darmstadt, Germany). Primary antibodies against total mTOR (2983), phospho-mTOR S2481 (2974), phospho-mTOR S2448 (2971), total p70S6K (9202), phosphor-p70S6K T389 (9205), total RPS6 (3944), phosphor-RPS6 S235/6 (4858), phosphor-RPS6 S240/4 (5364) and fluorescent secondary antibodies anti-mouse IgG (PE-conjugated, 8887) and anti-rabbit IgG (Alexa Fluor®488-conjugated, 4412) were purchased from Cell Signalling Technology (Cell Signalling Technology, via Bioké, Leiden, The Netherlands). Fluorescent secondary antibodies for Western blotting, including IRDye 800CW Donkey anti-Mouse IgG (926-32212), IRDye 800CW Donkey anti-Rabbit IgG (926-32213), IRDye 680RD Donkey anti-Mouse IgG (926-68072) and IRDye 680RD Donkey anti-Rabbit IgG (926-68073) were purchased from LiCor Biotechnology GmbH (Bad Homburg, Germany).
Cell culture
The Jurkat cell line was purchased from the American Type Culture Collection (ATCC® TIB-152™, MD). Cells were grown in RPMI-1640 medium supplemented with 10% heat inactivated fetal calf serum (FCS), 2 mM glutamine, 1 mM sodium pyruvate, 1 mM non-essential amino acids, 100 U penicillin/ml and 100 µg streptomycin/ml (all reagents from Sigma). Cells were cultured in T-75 flasks (Gibco, Breda, the Netherlands) in a humidified atmosphere at 37 °C with 5% CO2. Culture medium was refreshed every 2 days.
Chemical exposures
Jurkat cells between passages 16–19 were used in the exposures. Specifically, 2.7 ml medium containing 750,000 cells were seeded into each well of 6-well plates and the cells allowed to grow for 20 h before the exposure. Exposure was initiated by adding 0.3 ml medium containing the test compounds (at sub-cytotoxic concentrations, TBTO = 100 nM, TBTC = 100 nM, LIN = 130 µM, OTA = 10 µM, DON = 250 nM, Rapa = 20 nM, MPA = 10 µM, urethane = 20 mM, MAN = 2 mM, as determined in 24 h exposures (Shao et al., Citation2013)) or vehicle controls. The final DMSO concentration in the medium was 0.1% (v/v) for all samples. Exposures were performed on three independent days with Jurkat cells of different passages.
Cell lysate preparation
After exposure, cells were collected by centrifugation (5 min, 300 × g) and washed with phosphate-buffered saline (PBS). The cell pellets were then re-suspended in 300 μl M-PER mammalian protein extraction reagent (ThermoFisher Scientific, Etten-Leur, the Netherlands) supplemented with 1% protease inhibitor cocktail and 1% phosphatase inhibitor cocktail (ThermoFisher). The samples were kept on ice for 30 min and then centrifuged (30 min, 10 000 × g). The supernatants (lysates) were collected and stored at −80 °C until further analysis. Protein concentration was determined by Bio-Rad DC protein assay (Veenendaal, the Netherlands) according to manufacturer protocols.
Pathscan RTK signaling antibody array
The Pathscan RTK signaling antibody array (Cell Signalling Technology, Danvers, MA) is a slide-based antibody array based on the sandwich immunoassay principle. In total, 28 receptor tyrosine kinases and 11 crucial signaling nodes can be detected when they are phosphorylated at tyrosine or indicated residues. This experiment was carried out in biological triplicate at four timepoints according to manufacturer protocols. For each sample, 150 μg of cell lysate was loaded on the array.
Western blotting
An aliquot (16 μg protein/sample) of test lysate was loaded onto a 10% Mini-PROTEAN TGX pre-cast gel (Bio-Rad) under reducing conditions. After resolution, the proteins were electrotransferred to a 0.45-μm PVDF membrane (Millipore, Amsterdam, the Netherlands). The membrane was then blocked in Odyssey Blocking Buffer (LiCor Biotechnology GmbH) for 1 h at room temperature. All primary antibodies were diluted in 5% BSA in TBS with 1% Tween (TBS-T) and then added to the system and the membrane was incubated at 4 °C overnight. After repeated washes with TBS-T, secondary antibodies diluted in 5% Protifar (Bio-Rad) in TBS-T were placed in the system and the membrane was incubated at room temperature for 1 h. Thereafter, the membrane was washed with TBS-T and then scanned using the Odyssey Infrared Imaging System (LiCor Biotechnology GmbH).
Flow cytometry
Exposed cells were collected by centrifugation (5 min, 300 x g) and washed once with ice-cold PBS. The cell pellet was then re-suspended in 500 μl fresh ice-cold PBS to which 4.5 ml methanol was then added for fixation and permeabilization. After 30 min incubation on ice, the cells were pelleted, washed twice with ice-cold PBS, then re-suspended in PBS containing 10% FCS (incubation buffer) and then aliquoted into Eppendorf tubes. Primary antibodies against total RPS6 (CST2317), phospho-RPS6 S235/6 (CST4858) and phospho-RPS6 S240/4 (CST5364) were added to separate samples at dilutions provided by the manufacturer. After incubation at room temperature for 1 h, all samples were centrifuged and the resulting cell pellets were washed once with ice-cold PBS and then re-suspended in fresh incubation buffer. Secondary antibodies (anti-mouse IgG, PE conjugated, CST8887 for total RPS6 and anti-rabbit IgG, Alexa Fluor®488 conjugated, CST 4412 for phosphor-RPS6 S235/6 and phosphor-RPS6 S240/4) were added to the corresponding samples at dilutions provided by the manufacturer. After incubation for 30 min at room temperature, the stained cells were pelleted, washed once with incubation buffer and re-suspended in PBS. All the samples were then examined by flow cytometry using a Cyan ADP Analyzer (Beckman Coulter, Woerden, the Netherlands) and Summit software 4.3 (Beckman Coulter). A minimum of 5000 events per sample was acquired.
Gene set enrichment analysis
Gene set enrichment analysis (GSEA) was conducted as described in Shao et al. (Citation2013). The transcriptome dataset has been published online (GSE46909). Gene sets were used from a total of eight different collections, i.e. Gene Ontology (GO) (http://www.geneontology.org/) including biological process, cellular component and molecular function, Biocarta-2 (http://www.biocarta.com), KEGG (http://www.genome.jp/kegg), Reactome (http://www.reactome.org), Tox-action (self-made) and Lymphocyte database (Shaffer et al., Citation2001). Gene sets with a p-value < 0.01 and an FDR value <0.25 were considered significantly regulated.
Molecular concept analysis
Molecular concept analysis allows visualization of the network in which the overlap between gene sets based on co-occurrence of genes is shown. This overlap was calculated based on the genes that were responsible for a gene set to be considered as significantly affected. For this, either the top 20% up-regulated genes or the top 20% down-regulated genes were used. To reduce the complexity of the figures, the selection criteria for significant gene sets were set at a p-value <0.01 and an FDR value <0.1. In addition, gene sets containing ≤10 genes were excluded from analysis. The significance of overlap between gene sets was calculated based on binomial distribution using Venn-Mapper (Smid et al., Citation2003). Gene sets showing significant overlap (a z-value >5.2 equals a p-value <0.0000001) were connected in a network visualized using Cytoscape (Shannon et al., Citation2003). Gene sets with high overlap (high z-values) were clustered close to each other and are expected to share biological processes.
Chemotaxis assay
Chemotaxis analyses were performed based on a Boyden chamber assay (Chen, Citation2005), with slight modification. The chemokine used in this assay was CXCL12, a strong chemoattractant for T-cells. This cytokine was chosen since the CXCL12-CXCR4 axis is known to be crucial in immune and inflammatory responses (Doering et al., Citation2014; Fernandis et al., Citation2003) and, thus, plays an important role in host immune surveillance. CXCL12 is also known to drive chemotaxis of T-cells under various pathophysiological conditions (Dunussi-Joannopoulos et al., Citation2002; Zhang et al., Citation2005).
Jurkat cells (passage number 16–19) were seeded in 900 µl medium/well in regular 12-well plates (60 000 cells/well). After growing the cells for 20 h, exposure was initiated by adding 100 µl medium containing either 1 µm TBTO (final exposure concentration = 100 nM) or vehicle controls. Cells were exposed to the compounds for 22 h. The final DMSO concentration in the medium was 0.1% (v/v) for all samples. After exposure, cells were counted and transferred to apical compartments of trans-well chemotaxis chambers (150 µl/insert). The pore size of the insert was 5 µm (Corning Life Science B.V., Amsterdam). A total of 500 µl medium containing 25 ng/ml of CXCL12 (Biosource, Camarillo, CA) and the same concentration of either TBTO (100 nM) or DMSO (0.1%) was added to the basolateral compartments. The migration was then allowed to occur for 2 h at 37 °C. After this period, cells that had migrated to the basolateral compartment were counted using a Coulter Counter (Z2 Coulter Particle Count/Size Analyzer, Beckman Coulter Netherland BV, Woerden, the Netherlands). The percentage of migrated cells was then calculated and compared to results with wells that contained only DMSO.
Results
Identification of cellular signalling pathways affected by direct immunotoxicants
To identify the signaling pathways that are commonly regulated by immunotoxicants, time-dependent effects of seven immunosuppressants, including five immunotoxicants (e.g. lindane, ochratoxin A, TBTC, TBTO and DON) and two immunosuppressive drugs (rapamycin and mycophenolic acid), as well as two non-immunotoxic control chemicals (urethane and mannitol), were assessed upon exposure of Jurkat cells to sub-cytotoxic concentrations. Upon treatment, cells were lysed and subjected to protein phosphorylation profiling using PathScan RTK signaling antibody arrays.
Hierarchical clustering analysis revealed that the following cellular signaling events were affected by at least three immunotoxicants (). The most predominant effects were observed on the phosphorylation of RPS6 (Ser235/6); this was increased by DON (≥1.84-fold, from 3 h onwards) and decreased by rapamycin (≤−1.99-fold, from 0.5 h onwards), as well as by lindane (≤−1.97-fold, from 0.5 h onwards), TBTO (≤−2.99-fold, from 3 h onwards), ochratoxin A (−2.14 fold, at 6 h) and mycophenolic acid (−1.80 fold, at 24 h) (Supplementary Figure 1). Phosphorylation of Akt at the Thr308 position was increased by lindane, TBTO and mycophenolic acid (≥1.33-fold, from 0.5 h onwards) and slightly increased by rapamycin at earlier timepoints (≥1.22-fold, from 0.5 until 6 h). Another phosphorylation position of Akt (at Ser473) was increased by lindane (≥1.30-fold, from 0.5 h onwards), mycophenolic acid (≥1.28-fold, from 0.5 h onwards) and TBTC (≥1.57 fold, from 3 h onwards), but decreased by ochratoxin A (−1.64-fold, at 6 h) and rapamycin (≤−1.82-fold, from 3 h onwards). Phosphorylation of Src at the pan-Tyr position was increased by lindane (≥1.55-fold, from 3 h onwards), ochratoxin A (≥1.79-fold, from 6 h onwards), TBTC (1.69-fold at 24 h), TBTO (1.68-fold at 24 h) and rapamycin (≥1.50-fold, from 0.5 h onwards), but decreased by TBTO (−1.27-fold at 3 h) and DON (≤−1.53-fold, from 0.5 h onwards). Phosphorylation of p44/42 at the Thr202/Tyr204 position was increased by lindane at earlier timepoints (≥1.58-fold, from 0.5 until 6 h) and rapamycin (1.38-fold, at 3 h), but decreased by lindane (−2.18-fold, at 24 h), ochratoxin A (≤−1.24-fold, from 0.5 h onwards), TBTC (−2.41-fold, at 24 h), TBTO (≤−1.22-fold, from 3 h onwards) and mycophenolic acid (−1.49-fold at 6 h). Phosphorylation of Lck at the pan-Tyr position was increased by TBTC (1.92-fold, at 24 h), DON (1.90-fold, at 24 h) and mycophenolic acid (1.90-fold, at 24 h), but decreased by lindane (≤−2.97-fold, from 6 h onwards), ochratoxin A (−1.65-fold, at 24 h) and by DON at earlier timepoints (≤−1.53 fold, from 0.5 until 3 h). However, this kinase was also affected from 3 h onwards by the two non-immunotoxic control chemicals urethane (≥1.32-fold) and mannitol (≥1.28-fold).
Figure 1. Unsupervised hierarchical clustering of the phosphorylation of 28 receptor tyrosine kinases and 11 important signaling nodes. Heat map visualizes phosphorylation of 28 receptor tyrosine kinases and 11 important signaling nodes (with *) in Jurkat cells after exposure to one of five immunotoxicants (e.g. lindane, ochratoxin A, TBTC, TBTO and DON), two immuno-suppressive drugs (rapamycin, mycophenolic acid) or two non-immunotoxicants (urethane, mannitol) for 0.5, 3, 6 and 24 h. Green represents a decrease in phosphorylation, red an increase in phosphorylation and black no change, as compared to the carrier control at each exposure timepoint. Color intensity is related to the 2-log ratio and is indicated by the bar. For interpretation of the references to color in this figure legend, the reader is referred to the online version of the article.
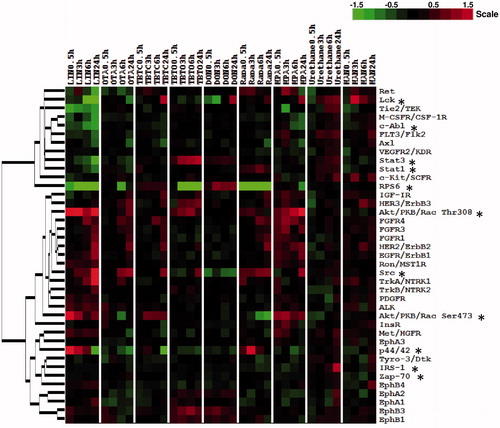
In addition, the following RTKs/signaling nodes were affected by two immunotoxicants (). Phosphorylation of STAT3 at the Tyr705 position was increased by TBTO (≥1.31-fold, from 0.5 h onwards) and decreased by lindane (≤−1.30-fold, from 3 h onwards). The phosphorylation of EphB1 and EphB3 at the pan-Tyr position was slightly increased by TBTO and DON (≥1.21-fold, from 0.5 h onwards).
TBTO-mediated effects on phosphorylation of RPS6 and other mTOR pathway intermediates
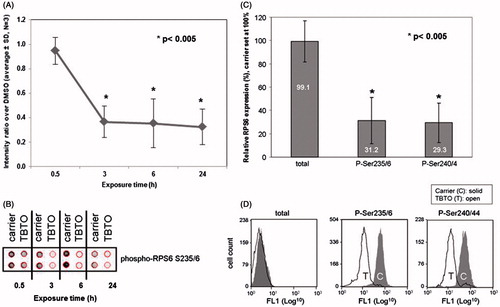
To validate the PathScan array data and further expand from one kinase/signaling node to a whole signaling pathway, we selected TBTO as the model immunotoxicant and started validating its effects on the phosphorylation of RPS6, one of the most commonly and clearly by immunotoxicants-affected proteins in this study. Flow cytometry experiments on this protein were performed first to confirm the results from the PathScan array experiment (), to examine whether the TBTO-mediated dephosphorylation of RPS6 was specific for the Ser235/6 position and to determine whether the reduced levels of phosphorylated RPS6 was due to dephosphorylation or a decrease in total RPS6 protein. The results revealed that TBTO exposure decreased phosphorylation of RPS6 (Ser235/6) without altering the expression level of total RPS6 (). Furthermore, the results demonstrated the TBTO-mediated dephosphorylation of RPS6 also happened at the Ser240/4 position (3.3-fold after 24 h) and to the same extent as at the Ser235/6 position ().
Figure 2. Effects of TBTO on phosphorylation of RPS6 in time. Jurkat T-cells were exposed to 100 nM TBTO for 0.5, 3, 6 and 24 h. (A) Average results for expression levels of phosphorylated RPS6 (Ser235/6) from three independent experiments with RTK antibody array; (B) a representative scan of the RTK antibody array. Effects of 24-h TBTO exposure on expression of RPS6 (total, p-Ser235/6 and p-Ser240/4) were further tested by flow cytometry. (C) Average results of three independent experiments; (D) representative histograms. *p < 0.005; two sample equal variance t test, two-tailed.
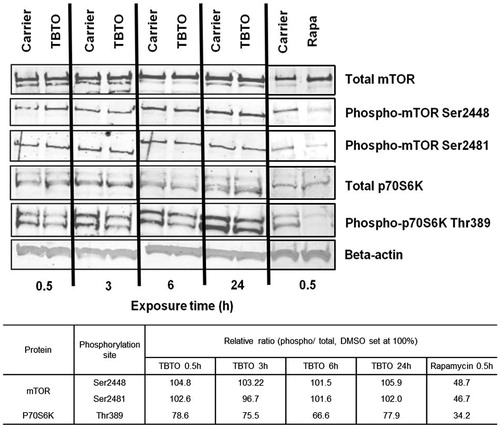
RPS6 is the downstream effector of p70 ribosomal protein S6 kinase (p70S6K) and the phosphorylation of the latter kinase is in turn directly controlled by mammalian target of rapamycin (mTOR) in mammalian cells (Chung et al., Citation1992). Therefore, this study also assessed the effect of TBTO on the phosphorylation of mTOR and p70S6K. Western blotting analysis showed that TBTO dephosphorylated p70S6K at Thr389 position starting from 0.5 h onwards, without affecting the expression levels of total p70S6K (). However, the expression levels of total and phosphorylated mTOR were not changed upon TBTO exposure. Thus, TBTO exposure caused a decrease in the expression levels of phosphorylated p70S6K at the Thr389 position and phosphorylated RPS6 at both the Ser235/6 and Ser240/4 positions, without affecting the expression levels of total p70S6K and RPS6. However, in contrast to rapamycin, TBTO did not affect the expression levels of total and phosphorylated mTOR at either Ser2448 or Ser2481.
Figure 3. Effects of TBTO on protein expression levels of mTOR signaling intermediates. Jurkat cells were exposed to 100 nM TBTO for 0.5, 3, 6 and 24 h. Protein expression levels of select mTOR signaling intermediates were quantified by Western blot: e.g. total and phosphorylated (Ser2448 and Ser2481) mTOR and total and phosphorylated (Thr389) p70 ribosomal protein S6 kinase (p70S6K). Quantification of the bands is shown in the table below the picture. Ratios between phosphorylated and total proteins were calculated and relative ratios calculated by setting the ratio for the DMSO sample at the corresponding timepoint at 100%. Rapamycin (20 nM) was used as positive control.
GSEA analysis of the microarray data of TBTO
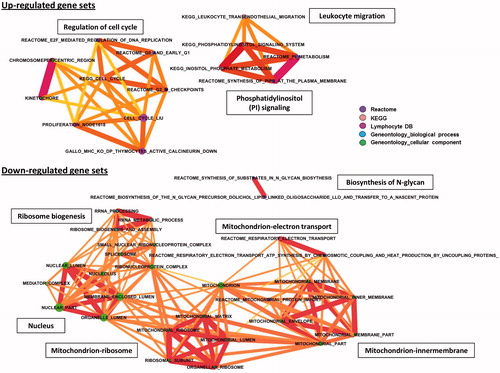
Gene set enrichment analysis (GSEA) of previously generated Jurkat transcriptome data (Shao et al., Citation2013) was performed to identify gene sets affected by TBTO. Eight different collections of gene sets were used in the analysis (see Materials and methods). In total, 95 gene sets were significantly affected by TBTO, of which 54 were up-regulated and 41 down-regulated. Molecular concept mapping on the most significantly affected gene sets was then performed to visualize overlap in genes among the significant sets (). The gene sets up-regulated after 6 h of exposure to 100 nM TBTO can be clustered in three groups: regulation of cell cycle, leukocyte migration and phosphatidylinositol signaling. The gene sets down-regulated after the 6 h exposure can be placed in four clusters: ribosome biogenesis, nucleus, biosynthesis of N-glycan and mitochondrial function. In the last cluster, three themes can be further distinguished: mitochondrion ribosome, mitochondrion inner membrane and mitochondrion electron transport.
Figure 4. Molecular concept analysis of gene sets affected in Jurkat cells after 6 h exposure to 100 nM TBTO. For clarity, gene sets with lower significance in overlap or contain ≤10 genes were left out. Node size corresponds to the number of genes in the gene set. Thickness of connecting lines indicates degree of overlap between gene sets. Color of nodes corresponds to gene set collection from which gene sets were derived: Purple = Reactome; light salmon = KEGG; pink = Lymphocyte DB; blue = Geneontology–biological process; and, green = Geneontology–cellular component. For interpretation of the references to color in this figure legend, the reader is referred to the online version of the article.
Regarding the up-regulated biological processes, GSEA analysis clearly indicates that TBTO up-regulated genes involved in the cell cycle related processes including DNA replication, mitosis and cell division (PRIM2, BUB1 and CDK6) (). TBTO, however, also induced genes that are known to be involved in cell cycle arrest and apoptosis (SP1, CASP2 and CLIC4). Expression levels of these genes are shown in Supplementary Figure 2A. Another biological process up-regulated by TBTO is leukocyte migration (). As shown in , many genes known to be essential for leukocyte migration were up-regulated by TBTO treatment, including ROCK1, ROCK2 and several leukocyte integrins, i.e. ITGA4, ITGB2 (alias CD18) and ITGAL (alias CD11a). Several gene sets related with phosphatidylinositol signaling were also up-regulated by TBTO treatment (); these included genes encoding different phosphorylated forms or subunits of PI3-kinase (PI3K) and genes encoding two members of the inositol-polyphosphate 5-phosphatase (PIPP) family: SYNJ1 (alias INPP5G) and SYNJ2 (alias INPP5H), which are regulators of the PI3K signaling pathway ().
Figure 5. Effects of TBTO on expression levels of genes involved in leukocyte migration, phosphatidylinositol (PI) signaling and ribosome biogenesis. Heat maps visualize the effects of TBTO exposure on the expression levels of genes involved in three different biological processes in Jurkat cells. As a result of an exposure for 6 h, TBTO up-regulated genes involved in (A) leukocyte migration and (B) phosphatidylinositol signaling and (C) down-regulated genes involved in ribosome biogenesis. Heat maps show 2-log ratios of TBTO versus the average of the DMSO controls (in three biological replicates, R1–R3). Green represents down-regulation, red up-regulation and black no-regulation. Color intensity is related to the 2-log ratio and is indicated by the bar. For interpretation of the references to color in this figure legend, the reader is referred to the online version of the article.
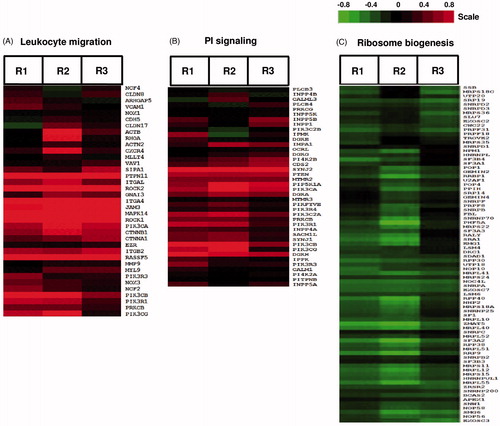
Biological processes down-regulated by TBTO included gene sets associated with ribosome biogenesis (). These gene sets include genes encoding several factors known to be involved in biogenesis and quality control of ribosomes, i.e. RRP9, NOP58, NOP56, RPP30, RPP38, RPP40, EXOSC2, EXOSC3 and EXOSC7 (). In addition, TBTO down-regulated mitochondrial ribosome RNA levels (, Supplementary Figure 2C). TBTO also down-regulated the mRNA of genes involved in the inner membrane and electron transport of mitochondria including a number of TIMM (e.g. TIMM9, 22, 23 and 50) and NDUF (e.g. NDUFS4, S8, A5 and A6) genes, which encode translocases of the inner membrane and NADH dehydrogenases, respectively (Supplementary Figures 2D and E) (). In addition, TBTO down-regulated gene sets related to the nucleus (). Part of the genes involved in this cluster (i.e. RRP9 and various RPPs, EXOSCs and MRPs) overlapped with genes involved in ribosome biogenesis and mitochondrial ribosomes (, Supplementary Figure 2B). These gene sets also involved genes encoding pre-mRNA splicing proteins, including SF3B3, SF3A2, PRPF18 and PRPF31 (Supplementary Figure 2B). Based on the genes of this cluster, it is clear TBTO inhibited transcription and translation processes. Two gene sets related to N-glycan biosynthesis were down-regulated by TBTO (). These sets include genes encoding glycosyltransferases (ALG1, 3, 5, 12 and 14) and dolichyl-phosphate mannosyltransferase poly-peptide 2 (DPM2) (Supplementary Figure 2C).
Parts of the pathways that are revealed by GSEA analysis are also indicated by the protein phosphorylation data of Jurkat cells in response to TBTO. For instance, the dephosphorylation of RPS6 indicated an inhibitory effect of TBTO on ribosome biogenesis, since RPS6 is a crucial component involved in this process (Meyuhas, Citation2000; Salmond et al., Citation2009a). TBTO also affected the phosphorylation of Stat3 and slightly induced the phosphorylation of EphB1 and EphB3 (). The JAK/STAT pathway has been reported activated in CXCL12-/CXCR4-mediated chemotaxis in several human T-cell lines (Vila-Coro et al., Citation1999), whereas activation of ephrin receptors have been shown to inhibit this process in a human T-cell line and primary T-cells (Sharfe et al., Citation2002). Taken together, both transcriptome and protein phosphorylation data from Jurkat cells indicated that TBTO affected ribosome biogenesis and cell migration.
TBTO inhibited chemotaxis of Jurkat cells towards the chemokine CXCL12
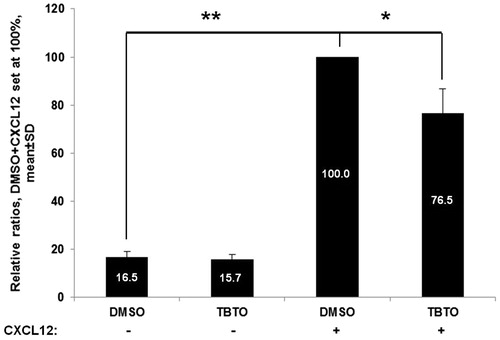
A trans-well based chemotaxis assay using the chemokine CXCL12 was performed in order to confirm the hypothesis that TBTO would affect the chemotaxis process of Jurkat cells, which was indicated by both transcriptome and protein phosphorylation data. The results showed that CXCL12 is a potent chemoattractant, as the number of migrated Jurkat cells increased significantly when CXCL12 was added in the basolateral compartment of the trans-well system (). In addition, the treatment of TBTO (100 nM, 24 h) significantly decreased the number of Jurkat cell migrated towards CXCL12.
Figure 6. Effects of TBTO on Jurkat cell chemotaxis toward CXCL12. The bar graph shows the effect of TBTO treatment (100 nM) on Jurkat cell chemotaxis. CXCL12 is a potent chemoattractant, as the amount of migrated Jurkat cells increased significantly when CXCL12 was in the basolateral compartment. Upon exposure for 24 h, TBTO decreased the percentage of migrated Jurkat cells to 76.5%. *p < 0.05; **p < 0.01: two sample equal variance t test, two-tailed.
Discussion
The objective of the present study was to identify cellular signaling pathways that are possibly involved in chemical-induced direct immunotoxicity. To that end, we used an antibody array to assess the effects of five immunotoxicants, two immunosuppressive drugs and two non-immunotoxic control chemicals on protein phosphorylation in human Jurkat T-cells in vitro. We identified in total four kinases/proteins, i.e. RPS6, Akt, Src and p44/42, whose phosphorylation was affected by at least three immunotoxicants and not by the non-immunotoxic controls. The most predominant effect was modulation of RPS6 phosphorylation. Further validation experiments with TBTO and rapamycin suggested that, although a number of immunotoxicants modulate the mTOR pathway, the underlying mechanisms were chemical-dependent. We also compared the transcriptomics results to protein phosphorylation profiling data of TBTO. Both data types indicated TBTO affects ribosome biogenesis and leukocyte migration in Jurkat cells.
Phosphorylation of the kinase Akt, at either the Thr308 or Ser473 position, was affected by a number of immunotoxicants. Lindane and mycophenolic acid induced phosphorylation of Akt at both positions. Akt plays an essential role in multiple fundamental cellular processes such as transcription, protein synthesis, cell proliferation and apoptosis (Fayard et al., Citation2005). With respect to the immune system, a growing body of evidence exists to show that Akt activation is associated with various immune-related pathologies including leukemia and autoimmune diseases (Bellacosa et al., Citation2005; Min et al., Citation2003; Patel & Mohan, Citation2005). Phosphorylation at the Thr308 position of Akt is regulated through the PI3K/PDK1 pathway (Alessi et al., Citation1997), whereas phosphorylation at the Ser473 position is thought to be regulated by mTORC2 (Sarbassov et al., Citation2005). Full activation of Akt requires phosphorylation at both positions (Hay & Sonenberg, Citation2004). Activated Akt will then activate mTORC1 via direct phosphorylation and inhibition of proline-rich Akt substrate of 40 kDa (PRAS40) and tuberous sclerosis complex 2 (TSC2) (Brazil & Hemmings, Citation2001; Haar et al., Citation2007). In addition, partial activation of Akt by phosphorylation at the Thr308 position alone has been demonstrated to be sufficient to activate mTORC1 (Haar et al., Citation2007).
The direct substrates of mTORC1 include p70S6K and eukaryotic translation initiation factor 4E binding protein 1 (4EBP1) (Hemmings & Restuccia, Citation2012). Activation of p70S6K by mTORC1, in turn, phosphorylates RPS6; thus, since Akt and RPS6 are in the same signaling pathway, it can be expected that compounds that target this pathway by modulating Akt activity will affect phosphorylation of RPS6 in the same direction. However, our results in Jurkat cells showed that the immunotoxicants lindane and TBTO induced phosphorylation of Akt at the Thr308 position throughout the duration of treatment, but dephosphorylated RPS6 (lindane from 0.5 h onwards, TBTO from 3 h onwards). These results indicated that decreased phosphorylation of RPS6 induced by these two agents was independent from their modulation of Akt activity. Due to the early alteration in RPS6 activity in response to the exposure to these two compounds, it can be expected these two compounds also target a protein/kinase located in the mTORC1-p70S6K pathway. Similar results have been reported; Chlamydia (Chlamydophila) pneumoniae infection activated Akt at both the Thr308 and Ser473 positions in Jurkat cells, whereas p70S6K phosphorylation was inhibited (Hirai et al., Citation2013).
In the present study, phosphorylation of Src was induced by lindane, ochratoxin A and rapamycin and suppressed by DON. Src belongs to the Src family tyrosine kinases which includes nine non-receptor tyrosine kinases that regulate cellular metabolism, survival and proliferation (Thomas & Brugge, Citation1997). Src family kinase inhibitors like Bosutinib and Dasatinib have been developed as candidate therapeutic agents for several malignancies, including solid tumors and melanoma, and have been approved by the USFDA as treatment for leukemia (Araujo & Logothetis, Citation2010; Cortes et al., Citation2012; Homsi et al., Citation2009; Zwaan et al., Citation2013). Regarding the immune system, Src family kinases are known to initiate and amplify numerous intracellular signaling pathways that are involved in innate and adaptive immune responses, including cell cycle, cell differentiation, migration, adhesion and phagocytosis (Byeon et al., Citation2012; Korade-Mirnics & Corey, Citation2000; Salmond et al., Citation2009b). In various in vitro cell systems, Src kinase has been demonstrated to phosphorylate p44/42 via activation of Raf-1 and MEK1/2 (Beltowski et al., Citation2006; Guo et al., Citation2006; Hu et al., Citation2009; Shan et al., Citation2001). Our data showed the activity of Src and p44/42 were regulated towards the same direction by lindane and rapamycin, suggesting these two immunosuppressants activated p44/42 via activation of Src. These results were in agreement with the findings that both lindane and rapamycin activated p44/42 in a Src-dependent manner in vitro, as pre-treatment with PP2 (a selective Src inhibitor) completely abrogated the activation of p44/42 (Chaturvedi et al., Citation2009; Mograbi et al., Citation2003).
Besides the modulation on phosphorylation of Akt, Src and p44/42 by the various test immunotoxicants, the most predominant effect on protein phosphorylation was found for RPS6. In total, six immunotoxicants modulated RPS6 phosphorylation, of which the mycotoxin DON induced phosphorylation of RPS6, whereas the other five (lindane, ochratoxin A, TBTO, rapamycin, mycophenolic acid) suppressed the phosphorylation. RPS6 has been demonstrated to be an essential determinant in ribosome biogenesis (Meyuhas, Citation2000; Salmond et al., Citation2009a). Deletion of the RPS6 gene in mice resulted in a failure to form functional ribosomes, which eventually led to embryonic lethality; deletion of RPS6 in T-cells abrogated T-cell development (Sulic et al., Citation2005). Moreover, those authors also showed that hemizygous expression of RPS6 impaired T-cell proliferation in response to TCR stimulation via activation of a p53-dependent cell cycle checkpoint. The phosphorylation of RPS6 is suggested to be controlled by the activities of p70S6K and p90S6K (RSK), in which p70S6K is generally believed to play a predominant role (Meyuhas & Kwang, Citation2008). Activation of RSK is under the control of p44/42 (Roux et al., Citation2007). Since none of the compounds that affected RPS6 phosphorylation had prolonged effects on the phosphorylation of p44/42, the contribution of RSK in the modulation of RPS6 phosphorylation by the test compounds might be limited.
Rapamycin is a specific inhibitor of the mTOR pathway; therefore, the rapid and drastic dephosphorylation of RPS6 in Jurkat cells in response to rapamycin treatment was expected. Similar effects have also been reported for rapamycin in various cell lines and mouse primary cells in vitro (Chung et al., Citation1992; Holz & Blenis, Citation2005; Pende et al., Citation2004) and in rodents in vivo (Khalaileh et al., Citation2013). Treatment with other immunotoxicants, lindane, DON and TBTO, also induced an early effect on RPS6 phosphorylation starting from 0.5 h (for lindane) or 3 h (for DON and TBTO) of exposure and throughout the whole treatment period. These results indicated RPS6 (or other mTORC1 pathway intermediates) might be one of the primary targets of these three immunotoxicants. The immunosuppressive drug mycophenolic acid also dephosphorylated RPS6, but only after 24 h of exposure; this implied this outcome might be an indirect effect of mycophenolic acid. The finding that DON had the opposite effect on phosphorylation of RPS6 as compared to TBTO was in line with results from previous transcriptome experiments with Jurkat cells in which DON up-regulated gene sets related with ribosome biogenesis and pre-mRNA splicing (see Shao et al., Citation2013; Supplementary Figure 3B), but TBTO down-regulated these sets.
Further investigation on the mTORC1 pathway using the model immunotoxicant TBTO revealed that TBTO, just like immunosuppressive rapamycin, suppressed phosphorylation of RPS6 at both the Ser235/6 and Ser240/4 positions and upstream regulator p70S6K at Thr389. However, a crucial difference between the two compounds is that rapamycin directly targets on mTOR, the upstream regulator of p70S6K, whereas TBTO had no effect on the phosphorylation of mTOR. This observation indicated that the molecular mechanisms behind this inhibition were different between rapamycin and TBTO, although both inhibited the p70S6K pathway. Our results are in line with the previously reported findings by Osman and van Loveren (Citation2012) that TBTO down-regulated the expression level of phosphorylated p70S6K in the EL4 mouse thymoma line. In addition, recent results from Osman and van Loveren (Citation2013) showed that, although TBTO dephosphorylated p70S6K, the phosphorylation of the other downstream effector of mTORC1, 4EBP1, was induced by TBTO, whereas rapamycin dephosphorylated this protein. This result also indicated that dephosphorylation of p70S6K by TBTO was independent of mTOR. Further investigation would be interesting in order to identify the targets of other immunotoxicants that also affected the phosphorylation of RPS6 in the present study.
Activation of p70S6K has also been linked with the transcriptional program of ribosome biogenesis, as the expression of over 75% of the factors that are involved in this process have been shown to be controlled by p70S6K in mouse (Chauvin et al., Citation2013). Ribosome biogenesis is essential for protein synthesis and has been linked with cell growth and cell cycle control. In addition, both RPS6 and p70S6K have been demonstrated as important regulators of translation processes of mRNAs containing a poly-pyrimidine tract at their 5′ end, also known as 5′TOP mRNA (Hutchinson et al., Citation2011; Pende et al., Citation2004). These mRNA mainly encode components of the translational apparatus, including ribosomal proteins, translation elongation factors and poly(A)-binding protein (PABP) (Topisirovic & Sonenberg, Citation2011). Therefore, the TBTO-mediated dephosphorylation of RPS6 and p70S6K strongly suggest that TBTO suppressed the process of ribosome biogenesis and protein synthesis.
Our transcriptomic data of TBTO revealed similar results, since 6 h of TBTO treatment was previously shown to down-regulate genes involved in biogenesis and quality control of the ribosomes, including RRP9, NOP58, NOP56, RPP30, RPP38, RPP40, EXOSC2, EXOSC3 and EXOSC7 (Chauvin et al., Citation2013; Sloan, Citation2012). In addition, we also observed down-regulation of several mitochondrial ribosomal proteins (MRP) by TBTO treatment. Mitochondrial ribosomal proteins are directly involved in the process of mitochondrial protein synthesis, which is essential for maintaining the integrity of mitochondria (Takeuchi & Ueda, Citation2003). Taken together, the protein phosphorylation and transcriptome results indicate that TBTO does not only inhibit transcription of cytoplasmatic ribosomal RNA, but also of mitochondrial ribosomal RNA. These findings are in agreement with the recently published results from our lab that 200 nM of TBTO treatment down-regulated the expression levels of genes involved in rRNA and tRNA processing and ribosome biogenesis in Jurkat cells (Schmeits et al., Citation2014). The present study further demonstrated that these effects can already be observed when TBTO is administered at a lower concentration (100 nM).
Besides the effect on ribosome biogenesis, the microarray data also indicated that TBTO affected cell migration since the gene set “leukocyte migration” was up-regulated. To validate this, we performed a trans-well based chemotoxis assay that demonstrated that TBTO inhibited CXCL12 induced cell migration. Therefore, the observed up-regulation of gene set “leukocyte migration” could be an adaptive response to counteract the inhibition of the migration ability. It can be envisaged that, at higher concentrations or after a longer exposure time, these genes would be down-regulated.
To estimate the potential relevance of these in vitro data to risks in humans in vivo, the concentrations applied in vitro were compared with concentrations in humans, particularly for TBTO. The dose of 100 nM (or 58 ng/ml) TBTO used in the present study was within the concentration range measured in human blood in Central Michigan (Kannan et al., Citation1999; Whalen et al., Citation1999) and in human liver samples in Japan (Takahashi et al., Citation1999). However, due to regional differences and/or restriction of the use of organotin compounds after 2002, the dose used in the present study was slightly higher than ones reported in Nielsen and Strand (Citation2002) which were 1–33 ng/g wet weight for total butyltin in human liver samples in Denmark.
Based on the present study results, the majority of the test chemicals could modulate the mTOR-p70S6K-RPS6 pathway. However, since only a limited number of kinases/proteins was tested with the antibody array, other relevant cellular signaling pathways that are potentially modulated by immunotoxicants might be missed. Therefore, it would be interesting to use a more extended phosphoproteomics approach to screen a set of immunomodulating chemicals to get a more comprehensive overview of cell signaling pathways involved in chemical-induced immunotoxicity as well as to identify biomarkers of direct immunotoxicity at the phosphoproteome level. To date, phosphoproteomic-based approaches have led to an increased understanding of modes of action for a few immunotoxicants (Osman & van Loveren, Citation2012; Pan et al., Citation2013); however, a wide survey study is still lacking.
Conclusion
By applying a phosphoproteome profiling based approach, we identified the mTOR signaling pathway as a major cellular pathway commonly affected in the Jurkat T-cell line by immunotoxicants. Validation experiments with the model immunotoxicant TBTO and immuno-suppressive drug rapamycin indicated that, although a number of immunotoxicants modulated the p70S6K pathway, the underlying mechanisms were chemical-dependent. In addition, both transcriptome and protein phosphorylation data revealed an effect of TBTO on ribosome biogenesis and cell chemotaxis.
Supplementary material available online
Supplementary Figures 1-2.
Supplemental Material.pdf
Download PDF (156.8 KB)Acknowledgments
This study was financially supported by the Netherlands Genomics Initiative, the Netherlands Toxicogenomics Centre (grant 05060510).
Declaration of interest
The authors report no conflict of interest. The authors alone are responsible for the content and writing of the paper.
References
- Alessi, D. R., James, S. R., Downes, C. P., et al. 1997. Characterization of a 3-phosphoinositide-dependent protein kinase which phosphorylates and activates protein kinase Bα. Curr. Biol. 7:261–269
- Araujo, J., and Logothetis, C. 2010. Dasatinib: A potent SRC inhibitor in clinical development for the treatment of solid tumors. Cancer Treat. Rev. 36:492–500
- Bellacosa, A., Kumar, C. C., Cristofano, A. D., et al. (Eds.). 2005. Activation of AKT kinases in cancer: Implications for therapeutic targeting. In: Advances in Cancer Research Vol. 94. New York: Academic Press, pp. 29–86
- Bełtowski, J., Wójcicka, G., Trzeciak, J., and Marciniak, A. 2006. H2O2 and Src-dependent transactivation of the EGF receptor mediates the stimulatory effect of leptin on renal ERK and Na+, K+-ATPase. Peptides 27:3234–3244
- Berg, J., Tymoczko, J., and Stryer, L. (Eds.). 2002. Defects in signaling pathways can lead to cancer and other diseases. In: Biochemistry. 5th Edition. New York: W. H. Freeman, Section 15.5
- Brazil, D. P., and Hemmings, B. A. 2001. Ten years of protein kinase B signalling: A hard Akt to follow. Trends Biochem. Sci. 26:657–664
- Byeon, S. E., Yi, Y. S., Oh, J., et al. 2012. The role of Src kinase in macrophage-mediated inflammatory responses. Mediators Inflamm. 2012:18. doi: 10.1155/2012/512926.512926
- Chaturvedi, D., Gao, X., Cohen, M. S., et al. 2009. Rapamycin induces transactivation of the EGFR and increases cell survival. Oncogene 28:1187–1196
- Chauvin, C., Koka, V., Nouschi, A., et al. 2013. Ribosomal protein S6 kinase activity controls the ribosome biogenesis transcriptional program. Oncogene 33:474–483
- Chen, H. 2005. Boyden chamber assay. Meth. Mol. Biol. 294:15–22
- Chung, J., Kuo, C. J., Crabtree, G. R., and Blenis, J. 1992. Rapamycin-FKBP specifically blocks growth-dependent activation of and signaling by the 70 kd S6 protein kinases. Cell 69:1227–1236
- Cortes, J. E., Kim, D. W., Kantarjian, H. M., et al. 2012. Bosutinib vs. imatinib in newly diagnosed chronic-phase chronic myeloid leukemia: Results from the BELA Trial. J. Clin. Oncol. 30:3486–3492
- Davila, D. R. 1999. Protein tyrosine kinase activation by polycyclic aromatic hydrocarbons in human HPB-ALL T cells. J. Toxicol. Environ. Health 56:249–261
- Doering, Y., Pawig, L., Weber, C., and Noels, H. 2014. The CXCL12/CXCR4 chemokine ligand/receptor axis in cardiovascular disease. Front. Physiol. 5:212
- Dunussi-Joannopoulos, K., Zuberek, K., Runyon, K., et al. 2002. Efficacious immunomodulatory activity of chemokine stromal cell-derived factor 1 (SDF-1): Local secretion of SDF-1 at the tumor site serves as T-cell chemoattractant and mediates T-cell-dependent anti-tumor responses. Blood 100:1551–1558
- Fayard, E., Tintignac, L. A., Baudry, A., and Hemmings, B. A. 2005. Protein kinase B/Akt at a glance. J. Cell Sci. 118:5675–5678
- Fernandis, A. Z., Cherla, R. P., and Ganju, R. K. 2003. Differential regulation of CXCR4-mediated T-cell chemotaxis and mitogen-activated protein kinase activation by membrane tyrosine phosphatase CD45. J. Biol. Chem. 278:9536–9543
- Guo, J., Wu, H. W., Hu, G., et al. 2006. Sustained activation of Src-family tyrosine kinases by ischemia: A potential mechanism mediating extracellular signal-regulated kinase cascades in hippocampal dentate gyrus. Neuroscience 143:827–836
- Haar, E. V., Lee, S., Bandhakavi, S., et al. 2007. Insulin signalling to mTOR mediated by the Akt/PKB substrate PRAS40. Nat. Cell Biol. 9:316–323
- Hay, N., and Sonenberg, N. 2004. Upstream and downstream of mTOR. Genes Devel. 18:1926–1945
- Hemmings, B. A., and Restuccia, D. F. (2012). PI3K-PKB/Akt pathway. Cold Spring Harbor Perspect. Biol. 4
- Hirai, I., Ebara, M., Nakanishi, S., et al. 2013. Jurkat cell proliferation is suppressed by Chlamydia (Chlamydophila) pneumoniae infection accompanied with attenuation of phosphorylation at Thr389 of host cellular p70S6K. Immunobiology. 218:527–532
- Holz, M. K., and Blenis, J. 2005. Identification of S6 Kinase 1 as a novel mammalian target of rapamycin (mTOR)-phosphorylating kinase. J. Biol. Chem. 280:26089–26093
- Homsi, J., Cubitt, C. L., Zhang, S., et al. 2009. Src activation in melanoma and Src inhibitors as therapeutic agents in melanoma. Melanoma Res. 19:167–175
- Hu, X., Wu, X., Xu, J., et al. 2009. Src kinase up-regulates the ERK cascade through inactivation of protein phosphatase 2A following cerebral ischemia. BMC Neuroscience. 10:74
- Hutchinson, J. A., Shanware, N. P., Chang, H., and Tibbetts, R. S. 2011. Regulation of ribosomal protein S6 phosphorylation by casein kinase 1 and protein phosphatase 1. J. Biol. Chem. 286:8688–8696
- Kannan, K. Senthilkumar, K., and Giesy, J. P. 1999. Occurrence of butyltin compounds in human blood. Environ. Sci. Technol. 33:1776–1779
- Katika, M. R., Hendriksen, P. J., Shao, J., et al. 2012. Transcrip-tome analysis of human T-lymphocyte cell line Jurkat and human peripheral blood mono-nuclear cells exposed to deoxynivalenol (DON): New mechanistic insights. Toxicol. Appl. Pharmacol. 264:51–64
- Khalaileh, A., Dreazen, A., Khatib, A., et al. 2013. Phosphorylation of ribosomal protein S6 attenuates DNA damage and tumor suppression during development of pancreatic cancer. Cancer Res. 73:1811–1820
- Korade-Mirnics, Z., and Corey, S. J. 2000. Src kinase-mediated signalling in leukocytes. J. Leukocyte Biol. 68:603–613
- Meyuhas, O. 2000. Synthesis of the translational apparatus is regulated at the translational level. Eur. J. Biochem. 267:6321–6330
- Meyuhas, O., and Kwang, W. J. (Eds.). (2008). Chapter 1 physiological roles of ribosomal protein S6: one of its kind. In: International Review of Cell and Molecular Biology, Vol. 268. New York: Academic Press, pp. 1–37
- Mikasova, L., de Rossi, P., Bouchet, D., et al. 2012. Disrupted surface cross-talk between NMDA and Ephrin-B2 receptors in anti-NMDA encephalitis. Brain 135:1606–1621
- Min, Y. H., Eom, J. I., Cheong, J. W., et al. 2003. Constitutive phosphorylation of Akt//PKB protein in acute myeloid leukemia: Its significance as a prognostic variable. Leukemia 17:995–997
- Mograbi, B., Corcelle, E., Defamie, N., et al. 2003. Aberrant connexin 43 endocytosis by the carcinogen lindane involves activation of the ERK/mitogen-activated protein kinase pathway. Carcinogenesis 24:1415–1423
- Munro, K. M., Dixon, K. J., Gresle, M. M., et al. 2013. EphA4 receptor tyrosine kinase is a modulator of onset and disease severity of experimental autoimmune encephalomyelitis (EAE). PLoS One 8:e55948
- Nielsen, J. B., and Strand, J. 2002. Butyltin compounds in human liver. Environ. Res. 88:129–133
- Osman, A. M., and van Loveren, H. 2012. Phosphoproteomic analysis of mouse thymoma cells treated with tributyltin oxide: TBTO affects proliferation and energy sensing pathways. Toxicol. Sci. 126:84–100
- Osman, A. M., and van Loveren, H. 2013. The immunosuppressant tributyltin oxide blocks the mTOR pathway, like rapamycin, albeit by a different mechanism. J. Appl. Toxicol. 34:1361–1367
- Pan, X., Whitten, D. A., Wu, M., et al. 2013. Early phosphoproteomic changes in the mouse spleen during deoxynivalenol-induced ribotoxic stress. Toxicol. Sci. 135:129–143
- Patel, R., and Mohan, C. 2005. PI3K/AKT signaling and systemic autoimmunity. Immunol. Res. 31:47–55
- Pende, M., Um, S. H., Mieulet, V., et al. 2004. S6K1−/−/S6K2−/− mice exhibit perinatal lethality and rapamycin-sensitive 5′-terminal oligopyrimidine mRNA translation and reveal a mitogen-activated protein kinase-dependent S6 kinase pathway. Mol. Cell. Biol. 24:3112–3124
- Robbins, S. M., Quintrell, N. A., and Bishop, J. M. 2000. Mercuric chloride activates the Src-family protein tyrosine kinase Hck in myelomonocytic cells. Eur. J. Biohem. 267:7201–7208
- Robinson, D., Wu, Y., and Lin, S. 2000. The protein tyrosine kinase family of the human genome. Oncogene 19:5548–5557
- Roux, P. P., Shahbazian, D., Vu, H., et al. 2007. RAS/ERK signalling promotes site-specific ribosomal protein S6 phos-phorylation via RSK and stimulates Cap-dependent translation. J. Biol. Chem. 282:14056–14064
- Salmond, R. J., Emery, J., Okkenhaug, K., and Zamoyska, R. 2009a. MAPK, phosphatidyl-inositol 3-kinase, and mammalian target of rapamycin pathways converge at level of ribo-somal protein S6 phosphorylation to control metabolic signaling in CD8 T-cells. J. Immunol. 183:7388–7397
- Salmond, R. J., Filby, A., Qureshi, I., et al. 2009b. T-Cell receptor proximal signaling via Src-family kinases, Lck and Fyn, influences T-cell activation, differentiation, and tolerance. Immunol. Rev. 228:9–22
- Sarbassov, D. D., Guertin, D. A., Ali, S. M., and Sabatini, D. M. 2005. Phosphorylation and regulation of Akt/PKB by the rictor-mTOR complex. Science 307:1098–1101
- Schmeits, P. C., Katika, M. R., Peijnenburg, A. A., et al. 2014. DON shares a similar mode of action as the ribotoxic stress inducer anisomycin while TBTO shares ER stress patterns with the ER stress inducer thapsigargin based on comparative gene expression profiling in Jurkat T-cells. Toxicol. Lett. 224:395–406
- Shaffer, A. L., Rosenwald, A., Hurt, E. M., et al. 2001. Signatures of the immune response. Immunity. 15:375–385
- Shan, X., Balakir, R., Criado, G., et al. 2001. ZAP-70-independent Ca2+ mobilization and Erk activation in Jurkat T-Cells in response to T-cell antigen receptor ligation. Mol. Cell. Biol. 21:7137–7149
- Shannon, P., Markiel, A., Ozier, O., et al. 2003. Cytoscape: A software environment for integrated models of biomolecular interaction networks. Genome Res. 13:2498–2504
- Shao, J., Katika, M. R., Schmeits, P. C., et al. 2013. Toxicogenomics-based identification of mechanisms for direct immunotoxicity. Toxicol. Sci. 135:328–346
- Sharfe, N., Freywald, A., Toro, A., et al. 2002. Ephrin stimulation modulates T-cell chemotaxis. Eur. J. Immunol. 32:3745–3755
- Sloan, K. (2012). The Exosome and Human Ribosome Biogenesis. PhD Thesis, Newcastle University
- Smid, M., Dorssers, L. C., and Jenster, G. 2003. Venn mapping: Clustering of heterologous microarray data based on the number of co-occurring differentially expressed genes. Bioin-formatics 19:2065–2071
- Šulić, S., Panić, L., Barkić, M., et al. 2005. Inactivation of S6 ribosomal protein gene in T-lymphocytes activates a p53-dependent checkpoint response. Genes Develop. 19:3070–3082
- Takahashi, S., Mukai, H., Tanabe, S., et al. 1999. Butyltin residues in livers of humans and wild terrestrial mammals and in plastic products. Environ. Pollut. 106:213–218
- Takeuchi, N., and Ueda, T. 2003. Down-regulation of the mitochondrial translation system during terminal differentiation of HL-60 cells by 12-O-Tetradecanoyl-1-phorbol-13-acetate: Comparison with the cytoplasmic translation system. J. Biol. Chem. 278:45318–45324
- Thomas, S. M., and Brugge, J. S. 1997. Cellular functions regulated by Src family kinases. Ann. Rev. Cell Develop. Biol. 13:513–609
- Topisirovic, I., and Sonenberg, N. 2011. Translational control by the eukaryotic ribosome. Cell 145:333–334
- Tworkoski, K., Singhal, G., Szpakowski, S., et al. 2011. Phosphoproteomic screen identifies potential therapeutic targets in melanoma. Mol. Cancer Res. 9:801–812
- Vila-Coro, A. J., Rodriguez-Frade, J. M., Martin de Ana, A., et al. 1999. The chemokine SDF-1α triggers CXCR4 receptor dimerization and activates the JAK/STAT pathway. FASEB J. 13:1699–1710
- Whalen, M. M., Loganathan, B. G., and Kannan, K. 1999. Immunotoxicity of environmentally relevant concentrations of butyltins on human NK cells in vitro. Environ. Res. 81:108–116
- Zhang, W., Nakajima, T., Goronzy, J. J., and Weyand, C. M. 2005. Tissue trafficking patterns of effector memory CD4+ T-cells in rheumatoid arthritis. Arthritis Rheum. 52:3839–3849
- Zwaan, C. M., Rizzari, C., Mechinaud, F., et al. 2013. Dasatinib in children and adolescents with relapsed or refractory leukemia: Results of the CA180-018 Phase I Dose-Escalation Study of the Innovative Therapies for Children With Cancer Consortium. J. Clin. Oncol. 31:2460–2468