
Abstract
Mercuric chloride (HgCl2) induces kidney damage, in part, through oxidative stress. A role for angiotensin II (Ang II) in pro-inflammatory events in a model of acute HgCl2-induced nephropathy was reported. Ang II is a potent oxidative stress inducer; however, its role in oxidative/anti-oxidative events in HgCl2-induced nephropathy remains unknown. The aim of this study was to determine the role of Ang II in the oxidative stress and renal infiltration of CD8+ T-cells after an acute HgCl2 intoxication. Three groups of Sprague Dawley rats were treated with a single subcutaneous dose of 2.5 mg/kg HgCl2: for 3 days prior to and for 4 days after that injection, rats in one group received Losartan (30 mg/kg), in another group Enalapril (30 mg/kg) or normal saline in the last group. Two other groups of drug-treated rats received saline in place of HgCl2. A final group of rats received saline in place of HgCl2 and the test drugs. All treatments were via gastric gavage. At 96 h after the vehicle/HgCl2 injection, blood and kidney samples were harvested. Renal sections were homogenized for measures of malondialdehyde (MDA), reduced glutathione (GSH) and catalase activity. Frozen sections were studied for the presence of superoxide anion () and CD8+ T-cells. HgCl2-treated rats had increased interstitial and tubular expression of
, high levels of MDA, normal catalase activity and GSH content, increased levels of interstitial CD8+ T-cells and an increased percentage of necrotic tubules. Anti-Ang II treatments diminished the HgCl2-induced increases in interstitial
, CD8+ T-cells and tubular damage and increased catalase and GSH expression above that due to HgCl2 alone; the HgCl2-induced high MDA levels were unaffected by the drugs. These data provide new information regarding the potential role of Ang II in the oxidative stress and renal CD8+ T-cell infiltration that occur during HgCl2 nephropathy.
Introduction
Heavy metals like mercury are potential threats to humans (Hu Citation2000). Mercury is excreted almost exclusively via the kidney; thus, renal exposure to mercury is unavoidable and subsequent toxicity commonly evolves in the kidney (Madden & Fowler Citation2000). Renal mercury chloride (HgCl2)-induced damage has been studied using experimental models of nephropathy, showing that the toxic effects of HgCl2 in the kidney are related to inflammatory events and/or oxidative stress (Ghielli et al. Citation2000; Aleo et al. Citation2002; Shimojo et al. Citation2002; de Greef et al. Citation2003; Stacchiotti et al. Citation2003).
One of the major mechanisms associated with mercury toxicity has been attributed to generation of reactive species that, in turn, leads to an imbalance between pro- and anti-oxidant (reducing) elements in the body. This shift in balance toward the pro-oxidants is termed oxidative stress. The oxidative stress-mediated toxicity induced by mercury is based upon a strong affinity for nucleophiles (like -SH and -SeH moieties; Farina et al. Citation2013), increased generation of oxygen and nitrogen free radicals and alterations in enzymatic (catalase, glutathione peroxidase and superoxide dismutase) and non-enzymatic (e.g. carotenoids, flavonoids, glutathione, Vitamin C, Vitamin E, etc.) anti-oxidants, each leading to an increased incidence in lipid peroxidation and subsequent damage to DNA, lipids and proteins (Sharma et al., Citation2014).
Previous reports have suggested that angiotensin II (Ang II) plays an important role in triggering inflammatory and oxidative renal injury and, further, that anti-Ang II treatments reduced those events in several experimental models of renal failure (Benigni et al. Citation2010; van der Meer et al. Citation2010). The association of Ang II with the pathogenesis of HgCl2-induced nephronpathy has been previously documented (Yanagisawa et al. Citation1998; Peña et al. Citation2012). In this regard, a vasopressor role for glomerular Ang II during the early phase of HgCl2-induced nephropathy was reported (Yanagisawa et al. Citation1998). Increased expressions of intercellular adhesion molecule-1 (ICAM-1), ED-1 (monocytes/macrophages) and inducible nitric oxide synthase (iNOS) mediated by Ang II have also been documented (Peña et al. Citation2012). However, the role of this hormone in the oxidative stress and in the infiltration of cytotoxic CD8+ T-cells (an oxidative radical producer; Chou et al. Citation2014) during HgCl2-induced nephropathy remains unknown.
Because Ang II can be chemotactic for T-cells (Silva-Filho et al., Citation2011) and this hormone can mediate oxidative stress (Toda et al. Citation2007; Garrido & Griendling Citation2009; Harrison & Gongora Citation2009; Wysocki et al. Citation2014), it could be expected that Ang II would modulate those parameters during HgCl2-induced nephropathy. Ang II acts through two receptor sub-types, AT1 and AT2 receptors. Most of the classic physiological effects of Ang II are mediated by the AT1 receptor, including induction of oxidative stress (Abdi & Johns Citation1997; Garrido & Griendling Citation2009; Benigni et al. Citation2010). In addition, increased production of Ang II by the effect of Ang I-converting enzyme (ACE) is related to enhanced Ang II-related actions (Abdi & Johns Citation1997; Benigni et al. Citation2010).
With the advent of drugs such as Losartan that specifically blocks the Ang II AT-1 receptor and Enalapril that blocks ACE activity, it is possible to dissect the physiological roles of the renin-angiotensin system (Abdi & Johns Citation1997; Donmez et al. Citation2002; Benigni et al. Citation2010; Muñoz et al. Citation2011; Peña et al., Citation2013). Therefore, the aim of this study was to determine the role of Ang II in the renal oxidative stress and CD8 cell infiltration in rats treated with HgCl2 using the angiotensin II receptor (AT-1) blocker Losartan and the ACE inhibitor Enalapril.
Materials and methods
Animals and experimental design
Sprague-Dawley rats (male, 200–250 g) were obtained from the Instituto de Investigaciones Cientificas (Caracas, Venezuela) and housed at the Instituto de Investigaciones Clinicas “Dr. Americo Negrette”, Zulia University Care Services Center according to the guidelines by the Institutional Animal Care and Use Committee. The facilities were maintained at 25 °C with a 12-h light:dark cycle. All rats had ad libitum access to standard chow (Ratarina, Valencia, Venezuela) and filtered water throughout the study. The Committee of Bioethics and Biosecurity of FONACIT (Caracas) and of Bioethics of the Medical School (Universidad del Zulia, Maracaibo, Venezuela) approved all the studies here. Since hormone fluctuations had a potential to influence the experiments, only male rats were used.
For these studies, the rats were randomly allocated into six groups (n = 10/group). These groups were designated as Group I (HgCl2 only-treated), Group II (HgCl2 and Losartan-treated), Group III (HgCl2 and Enalapril-treated), Group IV (Losartan only-treated), Group V (Enalapril only-treated) and Group VI (untreated). Rats in Groups I, II and III were to be injected subcutaneously with a single 500 μl dose (2.5 mg/kg) of HgCl2 (99.5% purity; Sigma, St. Louis, MO) in normal (0.9%) saline. Rats in Groups II and IV were to be treated daily by gastric gavage with 30 mg Losartan/kg (Cozaar, Merck & Co., Whitehouse Station, NJ) in normal saline (Abdi & Johns Citation1997). Rats in Groups III and V were to be treated daily by gavage with 30 mg Enalapril/kg (Renitec, Merck & Co.) in normal saline (Guo et al. Citation2008). Rats with no HgCl2 treatment (Groups IV, V and VI) received, respectively, Enalapril, Losartan or normal saline only daily by gavage (500 μl). The Anti-Ang II doses used here were previously shown to be capable of diminishing pro-inflammatory events in different inflammatory models (Vargas et al. Citation2012; Muñoz et al. Citation2011; Peña et al. Citation2012).
Each of the drug/water treatments occurred for 3 days prior to the HgCl2 injection and thereafter (up to 4 days post-HgCl2 injection). This particular timing of treatments was necessary because mercury enters cells rapidly after administration (Hultman & Enestrom Citation1986) and renal damage can be detected early. Therefore, when the anti-Ang II treatment is given 3 days after HgCl2 injection, it may be acting after the initiation of renal cellular injury. Muñoz et al. (Citation2011) showed that use of this anti-Ang II pre-treatment (3 days before and then throughout the experimental period) protocol diminished the expression of Ang II and pro-inflammatory molecules in an Adriamycin-induced nephrosis model. The specific dose of HgCl2 (2.5 mg/kg) and evolution time (96 h) used here were selected based on the fact that: (1) doses ranging from 1.0–3.5 mg HgCl2/kg induce dose-dependent alterations in the cytoplasm and nucleus of proximal tubular cells in rats (Stacchiotti et al. Citation2003); and (2) important inflammatory events are seen 2–6 days post-exposure (Ghielli et al. Citation2000). Accordingly, kidneys of the HgCl2-treated animals here were analyzed on Day 4 (i.e. 96 h) post-HgCl2 injection.
All rats (experimental and controls) at 72 h post-HgCl2 injection were placed in individual metabolic cages for 24 h to collect urine samples and to determine urinary protein concentration (using sulfosalicylic acid method; Tietz Citation1970). Then, 24 h later, the rats were anesthetized (ether) and blood samples collected via abdominal aortic puncture to determine blood creatinine by a direct colorimetric method in an Astra 4 Model analyzer (Beckman Instruments Inc., Fullerton, CA). At necropsy, the kidneys were perfused with saline solution. A section of the left kidney was removed, embedded in Tissue Tek (Miles Inc., Kankakee, IL), frozen in acetone-dry ice solution and stored at −70 °C until used in immunofluorescence studies and for determination of superoxide anion content. The remaining kidney was homogenized for measures of local oxidative stress.
Oxidative stress parameters
Thiobarbituric reactive substances (TBARS)
Kidney malondialdehyde (MDA) content was determined using a thiobarbituric acid assay (Ohkawa et al. Citation1979). In brief, perfused kidney sections were homogenized in a buffer containing 100 mM KCl and 3 mM EDTA. After centrifugation (600 × g, 15 min) a volume of supernatant was removed for measure of protein content (using bicinchoninic acid [BCA]; Wiehelman et al. Citation1988). From the remaining supernatant, 400 μl was added to 200 μl of reaction solution (8.1% SDS, 20% acetic acid and 0.8% thiobarbituric acid [pH 3.5]) (Sigma). The mixture was then heated to 95 °C for 60 min and the chromogenic substrate then extracted into an organic phase with butanol/pyridine (15:1, v/v). The absorbance of the organic layer was then assessed at 532 nm in the Astra 4 Model analyzer spectrophotometer (Beckman Instruments). TBARS levels in samples were extrapolated from a standard curve generated in parallel using bis-dimethyl acetal standard (Sigma). Results were expressed as nmol TBARS/mg protein.
Catalase activity
Catalase activity in the homogenates prepared above was determined using the method described by Aebi (Citation1982). Catalyzed decomposition of the H2O2 would be followed by monitoring decreases in absorbance at 240 nm (A240; ɛ = 0.0039 mmol−1•mm−1); the change in absorbance (ΔA240)/unit time was then used to reflect catalase activity. In the reaction, 25 μl homogenate was combined with 725 μl of a 7.7 mM hydrogen peroxide (H2O2) in 50 mM potassium phosphate buffer (pH 7.0) solution and the reaction then continuously monitored at 240 nm in the spectrophotometer. Due to abnormal kinetics inherent to catalase, it was not possible to define catalase units (U) according to standard recommendations. Thus, a different definition of activity, i.e. one based on a rate constant of a first-order reaction (k) as recommended by Aebi (Citation1982) was applied. All results were then expressed in terms of k/mg homogenate protein.
Reduced glutathione (GSH)
The GSH content in the homogenates prepared above was determined as described by Beutler et al. (Citation1963). In this case, aliquots of the isolated supernatants were treated with m-phosphoric acid to precipitate proteins and then centrifuged at 3000 x g for 10 min. The GSH in each supernatant was then measured by adding 500 μl to 2 mL of a solution of 0.04% v) 5,5/v) 5,5-dithio-bis-2-nitrobenzoic acid (DTNB; Sigma) in 0.2 M phosphate buffer (pH 7.4). The absorbance of each sample at 410 nm was then measured in the spectrophotometer. Levels of GSH in samples were extrapolated from a standard curve generated in parallel using purified GSH. All results were expressed as nmol GSH/mg renal protein.
Histological identification of superoxide anion
Superoxide anion () production at the cellular level in frozen renal sections was determined using a method described in Briggs et al. (Citation1986). In brief, 10-μm thick sections from each rat were incubated for 60 min at 37 °C in a solution containing 0.05 M Tris-HCl buffer (pH 7.6) containing 0.05 M 3,3’-diaminobenzidine (DAB), 8% (w/v) NiCl, 0.5 M MnCl2 and 10% (w/v) NaN3 (Sigma). The sections were then fixed in 10% formalin and counterstained with 1% methyl green solution. Using a light microscope, positive interstitial or tubular cells were identified and counted; levels were expressed as number of cells/mm2 in 10 randomly-selected fields.
Histopathological studies
The left kidney was processed for light microscopy. Tissue samples were fixed in 10% formalin and embedded in paraffin; subsequently, 4-μm thick sections were prepared and then stained with periodic acid-Schiff base (PAS) and hematoxylin. Each section was then examined using an Axioscope light microscope (Zeiss, Oberkochen, Germany) and pathological alterations were quantified. Analyses were performed blinded to sample identity. The extension of tubular injury was assessed as focal tubular necrosis and complete tubular necrosis. At least 100 S1–S2 and S3 proximal tubular segments were analyzed and reported as a percentage of tubular segments showing given histological damage.
Immunofluorescence studies
Perfused kidneys were used to determine CD8 expression in acetone-fixed 4-μm frozen sections by indirect immunofluorescence. For the study here, a murine monoclonal antibody against rat CD8 (Chemicon International, Inc, Temecula, CA) was used at manufacturer-recommended dilutions. Isotype-matched monoclonal antibody was used as a negative control. A secondary antibody, FITC conjugated anti-mouse IgG (Fab′2) (Pierce Biotechnology, Inc., Rockford, IL) was then used to localize the mouse monoclonal antibody in the tissues. After washing away unbound antibodies, the sections were then mounted in a solution of p-phenylene-diamine (in PBS-glycerol) and observed using an Axioskop microscope-epifluorescent system (Zeiss, Oberkochen, Germany). Sections of rat lymphoid nodes were processed as positive controls. Levels of positive cells in the tissues were expressed as number of interstitial cells/mm2 or cells/glomerular cross-section (gcs) in 10 randomly-selected fields. All microscopic analyses were done in a blinded manner.
Statistical analysis
Data were expressed as mean ± SD. Data analysis was performed using a non-parametric analysis of variance (ANOVA: Kruskal-Wallis Test) and a Dunn’s multiple comparisons test. Pearson’s correlation was used to analyze associations between variables. All data were analyzed using GraphPad Instat (GraphPad Instat software Inc. La Jolla, CA). A p value < 0.05 was considered significant.
Results
Superoxide anion production and lipid peroxidation
Oxygen species (such as superoxide anion, ) and lipid peroxidation (MDA) were examined in the kidney 4 days after HgCl2 intoxication with/without Losartan and Enalapril co-treatments. The data showed that HgCl2 increased interstitial and tubular expressions of
relative to levels in the naïve control rats ( and ). This change was reflected as interstitial and tubular cells with a strong dark precipitate in the cytoplasm (). Treatment with Losartan or Enalapril diminished the significant increase in interstitial
expression (), but failed to diminish the significant tubular
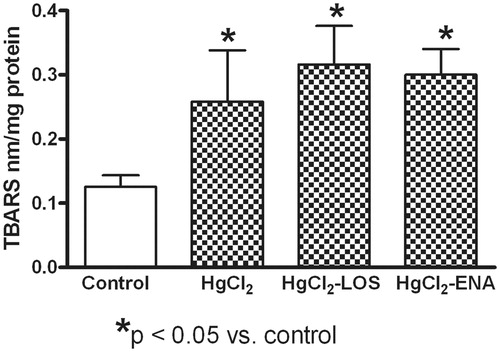
expression (). The HgCl2 also caused significant renal tissue lipid peroxidation as evidenced by increases in MDA content relative to levels in the naïve control rats; neither anti-Ang II treatment decreased the induced increase in MDA levels ().
Figure 1. Losartan or Enalapril effects on renal superoxide anion () production in HgCl2-induced nephropathy. Increased expression of (a) interstitial and (b) tubular
in tissues from all HgCl2-treated rats was observed. Losartan and Enalapril treatments diminished only the induced increase in interstitial
expression (to levels non-significantly higher than in Group VI control rat tissues: untreated, saline gavaged). In (a) *value is significantly different from those of all other groups of rats shown (p < 0.05). In (b) *of groups shown, value significantly different from that of Group VI control rats only (p < 0.05). Values from rats that received only Losartan- or Enalapril-only were not significantly different from the Group VI rats and so are not presented. Values shown are mean ± SD (n = 10/group). Data analysis was done using a non-parametric ANOVA (Kruskal-Wallis Test) and a Dunn’s multiple comparisons test.
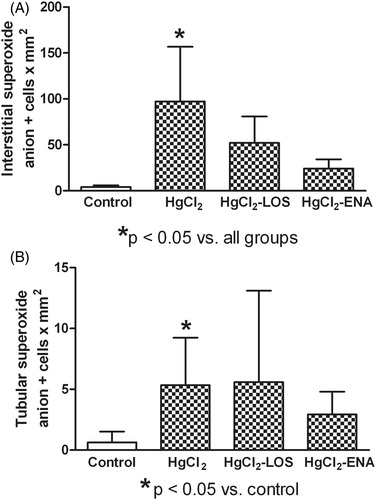
Figure 2. Expression of cellular in renal tissues from HgCl2-treated rats. (a) High numbers of
-positive cells are seen in tubules (arrows) and interstitium (cross arrow) of HgCl2 only-treated rats. (b) Losartan treatment diminished the number of
-positive cells (arrows) relative to that in HgCl2 only-treated rats. Rats in Groups IV, V and VI presented with normal tissues and so micrographs are not shown. Representative micrographs are presented. Original magnification = 400×.
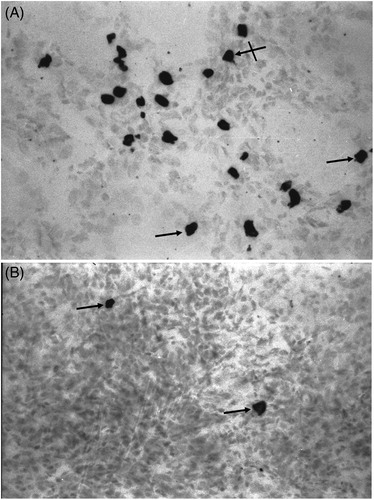
Figure 3. Effects of Losartan or Enalapril on renal thiobarbituric reactive substance (TBARS) production during HgCl2-induced nephropathy. Increased renal levels of TBARS were found in all HgCl2-treated rats relative to in Group VI (untreated, saline gavaged) control rat tissues. Losartan and Enalapril were not capable of reducing the increase in peroxidation. *Value significantly different from Group VI control rats (p < 0.05). Values from rats that received only Losartan- or Enalapril-only were not significantly different from the Group VI rats and so are not presented. Values shown are mean ± SD (n = 10/group). Data analysis was performed using a non-parametric ANOVA (Kruskal-Wallis Test) and a Dunn’s multiple comparisons test.
Anti-oxidant activities
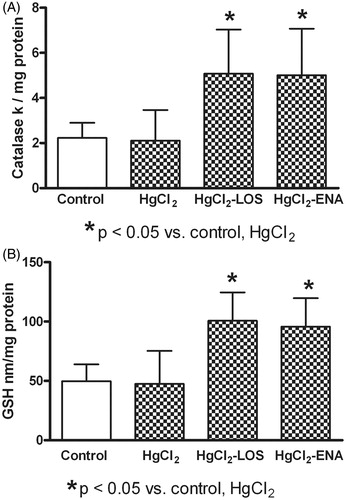
Any shift in host anti-oxidant response reflected through measures of catalase activity and GSH content was not observed in the mercury-treated rats, the values of catalase activity () and GSH content () in these hosts remained at normal levels. Total anti-oxidant levels were significantly increased with both Losartan and Enalapril treatment as compared to in hosts that only received HgCl2 alone. While both drugs seemed to have similar effectiveness in increasing total anti-oxidant content (), neither reduced the lipid peroxidation in the tissues that were noted above (re: ).
Figure 4. Losartan or Enalapril effects on renal catalase activity and reduced glutathione (GSH) content during HgCl2-induced nephropathy. HgCl2 itself did not modify (a) renal catalase activity or (b) GSH content relative to Group VI control rat tissue values (untreated, saline gavaged). Anti-Ang II treatments significantly increased both parameters in HgCl2-treated hosts. *Value significantly different from Group VI control and from HgCl2-only rats (p < 0.05). Values from rats that received only Losartan- or Enalapril-only were not significantly different from the Group VI rats and so are not presented. Values shown are mean ± SD (n = 10/group). Data analysis was performed using a non-parametric ANOVA (Kruskal-Wallis Test) and a Dunn’s multiple comparisons test.
Renal CD8 infiltration
To investigate whether HgCl2 intoxication was capable of inducing renal infiltration of CD8+ T-cells, renal sections underwent immunofluorescence analyses using a monoclonal antibody against rat CD8. The data show there was a differential expression of CD8+ T-cells in the kidney. In this regard, a low number of CD8+ T-cells was seen in the glomerulus (); however, a high number of these cells was found in the interstitium (). Losartan or Enalapril treatments prevented (diminished with similar effectiveness) the enhanced CD8+ T-cell expression in both the interstitial and glomerular compartments (). A representative photo of the immunofluorescence findings is presented in .
Figure 5. Losartan or Enalapril effects on renal CD8+ cell infiltration during HgCl2-induced nephropathy. (a) Significantly lower numbers of glomerular CD8+ cells in tissues from all HgCl2-treated rats relative to in Group VI control rat tissues (untreated, saline gavaged) were found. (b) Significantly higher numbers of interstitial CD8+ cells in tissues from HgCl2 only-treated rats relative to levels in Group VI control tissues. At both sites, use of Losartan and Enalapril reduced CD8+ cell levels relative to those in the HgCl2 only rats. *Value significantly different from Group VI control rats (p < 0.05 in (a) and p < 0.01 in (b)). In (a) values from the HgCl2-LOS and HgCl2-ENA rats were significantly different from HgCl2-only and from the control rats (p < 0.05). In (b) **value significantly different from HgCl2-only rats (p < 0.05) only. Values from rats that received only Losartan- or Enalapril-only were not significantly different from the Group VI rats and so are not presented. All values shown are mean ± SD (n = 10/group). Data analysis was performed using a non-parametric ANOVA (Kruskal-Wallis Test) and a Dunn’s multiple comparisons test.
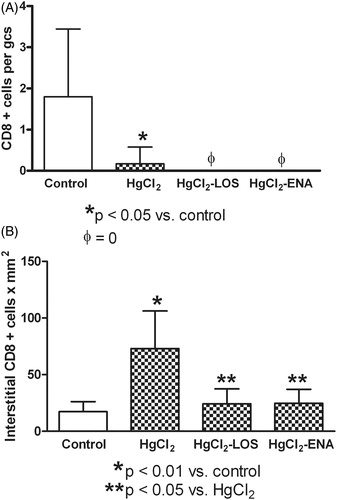
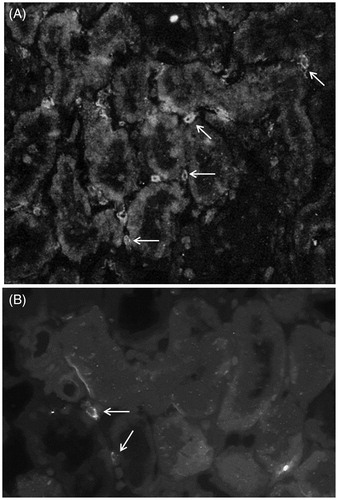
Figure 6. Indirect immunofluorescence analysis of renal CD8+ lymphocytes in HgCl2-induced nephropathy. (a) An increased presence of interstitial CD8+ cells (arrows) in tissue from HgCl2 only-treated rats. (b) Co-treatment with Losartan led to a decrease in numbers of these cells (arrows) relative to that in HgCl2 only-treated rats. Rats in Groups IV, V and VI presented with normal tissues and so micrographs are not shown. Representative micrographs are presented. Original magnification = 400×.
Tubular damage
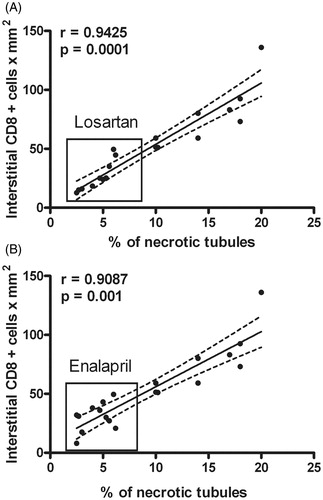
An increased percentage of necrotic tubules (partial or total necrosis) in HgCl2-treated animals was observed. Losartan or Enalapril treatments reduced the percentages (mean ± SD) of necrotic tubules (i.e. Control: 1.86 ± 1.30; HgCl2: 13.72 ± 4.55*; Losartan-HgCl2: 4.15 ± 1.39; Enalapril-HgCl2: 3.93 ± 1.20; *p < 0.01 vs all groups). Correlation analysis showed a significant association between CD8+ cell infiltration and the percentage of necrotic tubules in the Losartan- and Enalapril-treated animals (). However, no association between tubular superoxide anion expression and tubular damage was observed.
Figure 7. Correlation between renal CD8+ T-cell infiltration and percentage of tubules with necrosis. Significant positive correlation between CD8+ cell infiltration and tubular necrosis was observed. Treatments with (a) Losartan or (b) Enalapril decreased levels of infiltrating cells and tubules with necrosis.
The findings in this study were not accompanied by altered renal functions, since serum creatinine and urinary protein values remained at normal levels (). No significant differences between the non-HgCl2-treated rats and controls were observed ().
Figure 8. Losartan and Enalapril effects on renal function in HgCl2-induced nephropathy. Serum creatinine levels and urinary protein content remained similar in all HgCl2-treated rats compared to values in Group VI control rats (untreated, saline gavaged). Values from rats that received Losartan or Enalapril only were not significantly different from the Group VI rats and so are not presented. Values shown are mean ± SD (n = 10/group). Data analysis was performed using a non-parametric ANOVA (Kruskal-Wallis Test) and a Dunn’s multiple comparisons test.
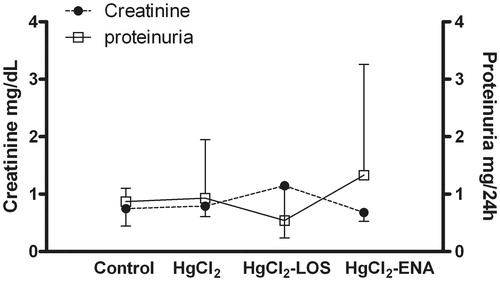
Table 1. Values from untreated and Losartan- or Enalapril-treated controls.
In the analyses of CD8+ cell presence in the tissues analyzed, the values obtained were: Control glomerular CD8: 1.80 ± 1.64; Losartan control glomerular CD8: 1.02 ± 0.77; Enalapril control glomerular CD8: 0.74 ± 0.54 (all three groups in cells/gcs); Control interstitial CD8: 17.28 ± 8.90; Losartan control interstitial CD8: 14.89 ± 10.10; and Enalapril control interstitial CD8: 16. 59 ± 9.20 (all three groups in mean cell/mm2 [± SD]).
With regard to the presence of catalase (k/mg), TBARS (nmol/mg) and GSH (nmol/mg) in the analyzed tissues, the values obtained here were (mean ± SD): Control catalase: 2.23 ± 0.67; Losartan control catalase: 3.03 ± 1.69; Enalapril control catalase: 2.94 ± 0.92; Control TBARS: 0.13 ± 0.09; Losartan control TBARS: 0.15 ± 0.10; Enalapril control TBARS: 0.12 ± 0.05; Control GSH: 49.72 ± 14.18; Losartan control GSH: 42.51 ± 20.15; and Enalapril control GSH: 44.45 ± 16.32.
Discussion
One of the major mechanisms associated with mercury toxicity is the generation of reactive species that develop, in part, due to an imbalance between pro-oxidant elements and anti-oxidant (reducing) elements in the body. In this process, a shift to the former is termed as oxidative stress. Mercuric chloride (HgCl2) is nephrotoxic in rats and affects the pars recta (S3 segment) of the proximal tubule (Stacchiotti et al. Citation2003), inducing a necrosis that seems to be mediated by oxidative damage (Aleo et al. Citation2002; Shimojo et al. Citation2002). The oxidative stress induced by HgCl2 is mediated by a strong affinity for nucleophiles (such as -SH and -SeH; Farina et al. Citation2013), by induction of oxygen/nitrogen free radicals and by alterations in the overall anti-oxidant response which involves enzymatic and non-enzymatic alterations and results in damage to DNA, proteins and lipids (i.e. malondialdehyde/lipid peroxidation) (Sharma et al., Citation2014).
Under the current experimental conditions (2.5 mg HgCl2/kg and analysis at 96 h post-exposure), only increased renal and MDA levels (accompanied by normal expression of catalase and reduced glutathione) were observed, suggesting an oxidative stress that was probably mediated by an absent/poor anti-oxidant response. Despite the anti-oxidant effects of the anti-Ang II treatments, i.e. decreasing
expression and increasing catalase activity and reduced glutathione levels, both Losartan and Enalapril were not capable of reducing lipid peroxidation (MDA content). At this point there is no clear explanation for this result; however, similar results have been previously reported. In this regard, increases in blood pressure, plasma creatinine and MDA were found in a 4/6 kidney ablation rat model (Krivosikova et al. Citation2001). In that study, Losartan reduced blood pressure and creatinine levels, but, MDA levels remained unaltered suggesting other mechanisms of lipid peroxidation different from those mediated by Ang II.
In the present study, tissue anti-oxidant responses (catalase activity, reduced glutathione content) were increased in the HgCl2-treated rats that also received anti-Ang II drugs, suggesting a blocking effect of Ang II on the activity/production of those agents. In this regard, Ang II was previously seen to cause decreased expression and activity of catalase in adventitial fibroblasts, an outcome probably mediated by activation of ERK1/2; this effect was abolished by losartan (Yang et al. Citation2011). In addition, during experimental congestive heart failure after myocardial infarction, decreases in myocardial catalase activity have been reported; losartan treatment improved the activity of this enzyme (Khaper & Singal Citation2001). The observed increased levels of reduced glutathione after Ang II blocking could also be related to an inhibitory effect of Ang II on this molecule. In this regard, Losartan and Enalapril therapies have been shown to cause increases in levels of plasma glutathione in hypertension patients (Donmez et al. Citation2002).
As shown in the current experimental model, there is likely a role for Ang II in HgCl2-induced oxidative stress. In a previous report, increased renal expression of Ang II in rats treated with HgCl2 was noted (Peña et al. Citation2012). Increased levels of endogenous Ang II promote local tissue damage by several mechanisms, including oxidative stress (Wysocki et al. Citation2014), mainly through activation of NADPH oxidase and increased formation of (Toda et al. Citation2007; Garrido & Griendling Citation2009; Harrison & Gongora Citation2009; Wysocki et al. Citation2014). Since Losartan and Enalapril treatment diminished the high levels of renal
found in the present study, a role for induced NADPH oxidase mediated by Ang II could be expected. Indeed, blocking of AT1 receptor by Losartan reduced NADPH oxidase activity in several experimental models (Toda et al. Citation2007; Wysocki et al. Citation2014). In conjunction with any enhanced
production caused by Ang II, HgCl2 could concurrently be decreasing local superoxide dismutase (SOD) activity (Jo et al. Citation2004), leading to overall increases in renal
content. These data support the possibility of a dual mechanism involving actions of Ang II and HgCl2 to explain the increases in
production. In this regard, anti-Ang II treatments here failed to decrease oxidative stress in the tubules; however, they did have this effect in the interstitial areas. These data suggest two different oxidative stress inducers in the kidney, one acting on/in tubules and the other in the interstitium. Since anti-Ang II treatment failed to reduce tubular oxidative stress, an HgCl2-mediated effect was expected. These data also suggested there were mechanisms unrelated (tubular) and related (interstitial) to Ang II; these differing pathways could help explain the differential findings in the interstitium and tubules in the present study.
Other potentially reactive species could also be being generated, i.e. via spontaneous dismutation or enzymatic catalysis, hydrogen peroxide (H2O2) (Rahal et al. Citation2014). Moreover, reactions between and nitric oxide (NO) during renal diseases induce formation of highly reactive peroxynitrites (Araujo & Welch Citation2006; Toda et al. Citation2007). In general, these inappropriate increases in reactive oxygen/nitrogen species can induce tissue damage (Nath et al. Citation1996).
The oxidative stress observed in this study was not accompanied by renal failure or glomerular permeability alteration. The literature is clear in that renal tubular damage induced by HgCl2 is a function of dose (Stacchiotti et al. Citation2003). The data here were obtained using a dose of 2.5 mg/kg; this differed from reports showing renal functional alterations and high levels of tubular damage after hosts received a dose of 5 mg HgCl2/kg (Gado & Aldahmash Citation2013; Velyka et al. Citation2014). The unaltered renal functions could also be related to a lack of inflammatory (CD8 infiltration) and oxidative stress ( -positive cells) in the glomeruli. Another explanation may be related to the low percentage of tubular necrosis (≈15%) noted when under the same protocol as used in this study (Peña et al. Citation2012). Accordingly, a low level of tubular necrosis was observed in the present study. In general, a high level of tubular necrosis induced by HgCl2 can trigger acute renal failure by causing increases in afferent arteriole resistance and decreases in ultra-filtration coefficients (via mesangial cell contraction; Yanagisawa et al. Citation1998).
Ingestion of inorganic mercury salts, mainly HgCl2, results in corrosion of the alimentary tract and renal damage. The acute lethal dose for most inorganic mercury compounds for an adult is 14–57 mg/kg for a 70-kg person (US Environmental Protection Agency Citation1994; ATSDR Citation1999). Thus, the dose used in this study did not represent a lethal dose for humans. In addition, not one of the treated animals died during the experimental period (4 days), suggesting the dose used was not lethal to rats. However, in this study, 2.5 mg HgCl2/kg was still capable of increasing renal tubular damage, CD8+ cell infiltration and inducing oxidative stress. This would be in keeping with earlier findings of increased renal pro-inflammatory events noted in rats after being treated with 2.5 mg HgCl2/kg (Peña et al. Citation2012). Such events could, if untreated or mitigated, induce deleterious effects over time leading to host death.
Here, mercuric intoxication induced an increase in renal interstitial infiltration by CD8+ cells, a marker expressed on cytotoxic T-lymphocytes (Milstein et al. Citation2011). Since anti-Ang II treatments diminished the expression of these cells in renal tissues, a role for Ang II in leukocyte infiltration was suggested. This finding would be in accord with other reports that had shown that Ang II enhanced CD8+ T-cell infiltration into the myocardium during acute cardiac inflammation (Ma et al. Citation2011). To our knowledge, this is the first report regarding infiltration of CD8+ T-cells during the acute phase of HgCl2 nephropathy and its potential modulation by Ang II. The current in vivo data also are in agreement with previous in vitro study results. In the latter, it was shown that Losartan or captopril was able to reduce adhesion/transmigration of CD8+ T-cells (Silva-Filho et al. Citation2011), again suggesting a role for Ang II in lymphocyte infiltration.
It is known that CD8+ T-cells are important intermediaries in the actions of Ang II in the kidney, by impacting upon renal infiltration, sodium and volume retention, renal cortical production, vascular hypertrophy and rarefaction (Chen et al., Citation2012; Trott et al. Citation2014). In this study, high levels of renal
accompanied by lipid peroxidation were found. These data suggested that the oxidative stress mediated by Ang II involved, in part, increased production of
by activated CD8+ T-cells. We, therefore, conclude that, in addition to effects on tissue infiltration, Ang II can also influence CD8+ T-cell activation. Activated CD8+ T-cells could be involved in tubular damage, i.e. the cytotoxic activity of these cells could induce deleterious effects on tubular cells. The high association seen here between interstitial CD8+ cell levels and the percentage of tubules with necrosis comports with this hypothesis.
Still, a direct effect of mercury on CD8+ T-cell activation here could also be important. In this regard, an increased number of CD8+ T-cells expressing pro-inflammatory genes in the thymus of mice treated with mercuric sulfide has been reported (Son et al. Citation2010). In addition, it is known that HgCl2 exposure during immune system development can lead to persistent alterations in adult immune cell phenotypes and functions (Pilones et al. Citation2009). The effect on immune cells seems to be shared by other metals, as high levels of CD8+ T-cells and oxidative stress have been found in patients suffering from nickel or chromium intoxication (Ahmed et al. Citation2010).
Differential modulatory effects of HgCl2 on CD8+ T-cell infiltration were observed here. Specifically, increased CD8+ cell infiltration in the interstitium and decreased infiltration in the glomeruli were found. While HgCl2 has a potent nephrotoxic effect (mediated by Hg2+-glutathione complexes (Yanagisawa Citation1998), the effect is mainly in the proximal tubules, inducing acute tubular necrosis and interstitial inflammation (Yanagisawa Citation1998; Peña et al. Citation2012). Our earlier studies noted that increased expression of immunological markers of inflammation (e.g. ICAM-1, ED-1+ cell infiltration) was only noted in kidney tubular and interstitial areas and absent in glomerular regions during HgCl2 acute intoxication in rats (Peña et al. Citation2012). Thus, necrotic and inflammatory effects in the interstitium could be modulated by differential degrees of infiltration of CD8+ cells, like that observed in the present study.
Conclusions
This study showed that inhibition of the AT1 receptor and angiotensin I-converting enzyme (by Losartan and Enalapril, respectively) decreased renal oxidative responses and CD8+ cell infiltration and increased anti-oxidant responses in a model of mercury-induced nephropathy. This suggested a new role for Ang II in mercuric intoxication. The study also showed that modulation of the rennin-angiotensin system, either by angiotensin-converting enzyme inhibition or by AT1 receptor blockade, was beneficial. However, the clinical relevance of the present findings requires performing additional therapeutic experiments.
Acknowledgements
We thank the Instituto de Investigaciones Clinicas “Dr. Americo Negrette”, Facultad de Medicina (Universidad del Zulia, Venezuela) that provided support for this study. The Institution was not involved in the study design, collection, analysis and interpretation of data, writing of the report or in the decision to submit the article for publication.
Disclosure statement
The authors report no conflicts of interest. The authors alone are responsible for the content and writing of the paper.
References
- Abdi A, Johns EJ. 1997. Effect of angiotensin II receptor antagonists on kidney function in two-kidney, two-clip Goldblatt hypertensive rats. Eur J Pharmacol. 23:185–192.
- Aebi HE. 1982. Catalase. In: Methods of Enzymatic Analysis (Bergmeyer H.U., Ed.). Weinheim, Germany: Verlag Chemie, pp. 271–282.
- Agency for Toxic Substances and Disease Registry (ATSDR). 1999. Toxicological Profile for Mercury. Atlanta, GA: U.S. Department of Health and Human Services.
- Ahmed MH, El-Mahdy NM, El-Dessouky NA, Rashed LA. 2010. Mechanism of nickel- and chromium-induced immunotoxicity and oxidative stress: A comparative study. Med J Cairo Univ. 78:413–426.
- Aleo M, Morandini F, Bettoni F, Tanganelli S, Vezzola A, Giuliani R. 2002. Anti-oxidant potential and gap junction-mediated intercellular communication as early biological markers of mercuric chloride toxicity in the MDCK cell line. Toxicol In Vitro 16:457–465.
- Araujo M, Welch WJ. 2006. Oxidative stress and nitric oxide in kidney function. Curr Opin Nephrol Hypertens. 15:72–77.
- Benigni A, Cassis P, Remuzzi G. 2010. Angiotensin II revisited: New roles in inflammation, immunology, and aging. EMBO Mol Med. 2:247–257.
- Beutler E, Duron O, Milkus B. 1963. Improved method for the determination of blood glutathione. J Lab Clin Med. 16:882–888.
- Briggs RT, Robinson JM, Karnovsky ML, Karnovsky MJ. 1986. Superoxide production by polymorphonuclear leukocytes. Histochemistry 84:371–388.
- Chen W, Kirabo A, Thabet SR, Trott DW, Zhang F, Wu J, Arendshorst WJ, Goldstein A, Bikineyeva A, Dikalov S. 2012. A critical role of CD8+ T-cells in the genesis of renal dysfunction in hypertension. Hypertension 60:A646.
- Chou JP, Ramirez CM, Ryba DM, Koduri MP, Effros RB. 2014. Prostaglandin E2 promotes features of replicative senescence in chronically-activated human CD8+ T-cells. PLoS One 9:e99432.
- de Greef KE, Ysebaert DK, Persy V, Vercauteren SV, de Broe ME. 2003. ICAM-1 expression and leukocyte accumulation in inner stripe of outer medulla in early phase of ischemic compared to HgCl-induced ARF. Kidney Intl. 63:1697–1707.
- Donmez G, Derici U, Erbas D, Arinsoy T, Onk A, Sindel S, Hasanoglu E. 2002. Effects of losartan and enalapril therapies on the levels of nitric oxide, malondialdehyde, and glutathione in patients with essential hypertension. Japan J Physiol. 52:435–440.
- Farina M, Avila DS, Teixeira da Rocha JB, Aschner M. 2013. Metals, oxidative stress, and neurodegeneration: Focus on iron, manganese, and mercury. Neurochem Intl. 62:575–594.
- Gado AM, Aldahmash BA. 2013. Anti-oxidant effect of Arabic gum against mercuric chloride-induced nephrotoxicity. Drug Des Develop Ther. 7:1245–1252.
- Garrido AM, Griendling KK. 2009. NADPH oxidases and angiotensin II receptor signaling. Mol. Cell. Endocrinol. 302:148–158.
- Ghielli M, Verstrepen WA, de Greef KE, Helbert MH, Ysebaert DK, Nouwen EJ, de Broe ME. 2000. Antibodies to both ICAM-1 and LFA-1 do not protect the kidney against toxic (HgCl2) injury. Kidney Intl. 58:1121–1134.
- Guo S, Kowalewska J, Wietecha TA, Iyoda M, Wang L, Yi K, Spencer M, Banas M, Alexandrescu S, Hudkins KL, et al. 2008. Renin-angiotensin system blockade is reno-protective in immune complex-mediated glomerulonephritis. J Am Soc Nephrol. 19:1168–1176.
- Harrison DG, Gongora MC. 2009. Oxidative stress and hypertension. Med Clin North Am. 93:621–635.
- Hu H. 2000. Exposure to metals. Occup Environ Med. 27:983–996.
- Hultman P, Enestrom S. 1986. Localization of mercury in the kidney during experimental acute tubular necrosis studied by the cytochemical silver amplification method. Br J Exp Pathol. 67:493–503.
- Jo SY, Hu X, Yuen PS, Aslamkhan AG, Pritchard JB, Dear JW, Star RA. 2004. Delayed DMSO administration protects the kidney from mercuric chloride-induced injury. J Am Soc Nephrol. 15:2648–2654.
- Khaper N, Singal PK. 2001. Modulation of oxidative stress by a selective inhibition of angiotensin II type 1 receptors in MI rats. J Am Coll Cardiol. 37:1461–1466.
- Krivosikova Z, Dusinska M, Spustova V, Serekova K, Blazicek P, Heidland A, Dzurik R. 2001. DNA damage of lymphocytes in experimental chronic renal failure: Beneficial effects of losartan. Kidney Intl. 59:S212–S215.
- Ma F, Feng J, Zhang C, Li Y, Qi G, Li H, Wu Y, Fu Y, Zhao Y, Chen H, et al. 2014. The requirement of CD8+ T-cells to initiate and augment acute cardiac inflammatory response to high blood pressure. J Immunol. 192:3365–3373.
- Madden EF, Fowler BA. 2000. Mechanisms of nephrotoxicity from metal combinations: A review. Drug Chem Toxicol. 23:1–12.
- Milstein O, Hagin D, Lask A, Reich-Zeliger S, Shezan E, Ophir E, Eidelshtein Y, Afik R, Antebi YE, Dustin ML. 2011. CTLs respond with activation and granule secretion when serving target for T-cell recognition. Blood 117:1042–1052.
- Muñoz M, Rincón J, Pedreañez A, Viera N, Hernández-Fonseca JP, Mosquera J. 2011. Pro-inflammatory role of angiotensin II in a rat nephrosis model induced by adriamycin. J Renin Ang Aldo Syst. 12:404–412.
- Nath KA, Croatt AJ, Likely S, Behrens TW, Warden D. 1996. Renal oxidant injury and oxidant response induced by mercury. Kidney Intl. 50:1032–1043.
- Ohkawa H, Ohishi N, Yagi K. 1979. Assay for lipid peroxides in animal tissues by thiobarbituric acid reaction. Anal Biochem. 95:351–358.
- Peña C, Hernández-Fonseca JP, Rincón J, Pedreañez A, Viera N, Mosquera J. 2012. Pro-inflammatory role of angiotensin II in mercuric-chloride-induced nephropathy in rats. J Immunotoxicol. 10:125–132.
- Pilones K, Tatum A, Gavalchin J. 2009. Gestational exposure to mercury leads to persistent changes in T-cell phenotype and function in adult DBF-1 mice. J. Immunotoxicol. 6:161–170.
- Rahal A, Kumar A, Singh V, Yadav B, Tiwari R, Chakraborty S, Dhama K. 2014. Oxidative stress, pro-oxidants, and anti-oxidants: The inter-play. Biomed Res Int. 2014:761264.
- Sharma B, Singh S, Siddiqi NJ. 2014. Biomedical implications of heavy metals-induced imbalances in redox systems. Bio Res Inter. 2014:1–26.
- Shimojo N, Kumagai Y, Nagafune J. 2002. Differences kidney and liver in decreased manganese superoxide activity caused by exposure of mice to mercury. Toxicology 76:383–387.
- Silva-Filho JL, Souza MC, Henriques MD, Morrot A, Savino W, Nunes MP, Carruso-Neves C, Pinheiro AA. 2011. AT1 receptor-mediated angiotensin II activation and chemotaxis of T-lymphocytes. Mol Immunol. 48:1835–43.
- Son HY, Lee S, Park SB, Kim MS, Choi EJ, Singh TS, Bae Y, Kwack SJ, Kang TS, Shin HI. 2010. Toxic effects of mercuric sulfide on immune organs in mice. Immunopharmacol Immunotoxicol. 32:277–283.
- Stacchiotti A, Borsani E, Rodella L, Rezzani R, Bianchi R, Lavazza A. 2003. Dose- dependent mercuric chloride tubular injury in rat kidney. Ultrastruct Pathol. 27:253–259.
- Tietz N., (Ed.). 1970. Fundamentals of Clinical Chemistry, 2nd Edition. Toronto: Saunders, pp. 360–363.
- Toda N, Ayajiki K, Okamura T. 2007. Interaction of endothelial nitric oxide and angiotensin in the circulation. Pharmacol Rev. 59:54–87.
- Trott DW, Thabet SR, Kirabo A, Saleh MA, Itani H, Norlander AE, Wu J, Goldstein A, Arendshorst WJ, Madhur MS, et al. 2014. Oligoclonal CD8+ T-cells play a critical role in the development of hypertension. Hypertension 64:1108–1115.
- U.S. Environmental Protection Agency (USEPA). 1994. Summary Review of Health Effects Associated with Mercuric Chloride: Health Issue Assessment. EPA/600/R-92/199. Washington, DC: Office of Health and Environmental Assessment.
- van der Meer IM, Cravedi P, Remuzzi G. 2010. Role of renin angiotensin system inhibition in kidney repair. Fibrogen Tissue Repair. 4:3–7.
- Vargas R, Rincón J, Pedreañez A, Viera N, Hernández-Fonseca JP, Peña C, Mosquera J. 2012. Role of Angiotensin II in the brain inflammatory events during experimental diabetes in rats. Brain Res. 1453:64–76.
- Velyka A, Pshak VP, Lopushinska IV. 2014. Activity of anti-oxidant enzymes of the rat kidneys under mercury dichloride effect. Ukr Biokhim Zh. 86:124–130.
- Wiehelman K, Braun R, Fitzpatrick J. 1988. Investigation of bicinchoninic acid protein assay. Identification of groups responsible for color formation. Anal Biochem. 175:231–237.
- Wysocki J, Ortiz-Melo DI, Mattocks NK, Xu K, Prescott J, Evora K, Ye M, Sparks MA, Haque SK, Batlle D, et al. 2014. ACE2 deficiency increases NADPH-mediated oxidative stress in the kidney. Physiol Report. 2:3.
- Yanagisawa H. 1998. HgCl2-induced acute renal failure and its pathophysiology. Nihon Eiseigaku Zasshi. 52:618–623.
- Yanagisawa H, Nodera M, Umemori Y, Shimoguchi Y, Wada O. 1998. Role of angiotensin II, endothelin-1, and nitric oxide in HgCl2-induced acute renal failure. Toxicol Appl Pharmacol. 152:315–326.
- Yang W, Zhang J, Wang H, Gao P, Singh M, Shen K, Fang N. 2011. Angiotensin II down-regulates catalase expression and activity in vascular adventitial fibroblasts through an AT1R/ERK1/2-dependent pathway. Mol Cell Biochem. 358:21–29.