
Abstract
Multiple sclerosis (MS) is a central nervous system disorder mainly characterized by inflammation, demyelination and axonal injury. Anti-inflammatory agents can be used to ameliorate the disease process. Hypericum perforatum L or St. John’s wort is widely used as an anti-depressant and anti-inflammatory remedy in traditional and herbal medicine. Based on St. John’s wort properties, the therapeutic potentials of an H. perforatum extract (HPE) and a single component, hyperforin were evaluated for effectiveness against MOG35–55-induced experimental autoimmune encephalomyelitis (EAE), an animal model for human multiple sclerosis. Female C57BL/6 mice were immunized with specific antigen MOG35–55 and then administered different doses of hyperforin or HPE post-immunization. Clinical symptoms/other relevant parameters were assessed daily. Histological analysis of the spinal cord was performed. T-cell proliferative activity was also evaluated using a BrdU assay. The effect of hyperforin on regulatory T-cells (Treg cells) was assessed using flow cytometry. The results indicate hyperforin and HPE reduced the incidence and severity of EAE, an outcome that closely correlated with an inhibition of pathological features (leukocyte infiltration and demyelination) and antigen-specific T-cell proliferation. The study also showed that hyperforin caused increased Treg cell levels in the spleen. These results indicated that hyperforin and HPE could attenuate EAE autoimmune responses by inhibiting immune cell infiltration and expansion of Treg cell and could eventually be considered as a potential candidate for use in the treatment of MS.
Introduction
Multiple sclerosis (MS) is a chronic and unpredictable disease of the central nervous system (CNS) (Barten et al. Citation2010). MS is characterized by inflammation, demyelination and axonal damage wherein CNS lesions develop that contain a high number of infiltrating auto-reactive cells (Brück Citation2005; Stadelmann et al. Citation2011; Cristofanilli et al. Citation2014). The pathogenesis of MS is due, in part, to aberrant autoreactive T-cell responses and a subsequent loss of/reduction in function of the regulatory network of the immune system. Experimental autoimmune encephalo-myelitis (EAE) is a well-established model for cell-mediated autoimmunity and studying human MS (Mix et al. Citation2010; Markoullis et al. Citation2012), which mimics clinical, immunological and pathological aspects of MS (Hemmer et al. Citation2006; Schneider et al. Citation2009). Almost all therapies for MS were first examined and validated in EAE model systems.
It has been documented that, in addition to increased number of autoimmune T-cells, the decreased numbers and dysfunction of regulatory T (Treg)-cells are involved in the pathogenesis of MS (Batoulis et al. Citation2010). Treg cells have been defined as CD4+CD25+FoxP3+ T-cells that play a crucial role in maintaining self-tolerance and preventing autoimmune diseases (Sakaguchi et al. Citation2006; Corsini et al. Citation2011; Fritzsching et al. Citation2011). Therefore, any therapy that leads to an increase in the number and functions of Treg cells could be considered as a potential candidate for use in the treatment of MS.
A variety of medications, mainly immune-suppressant drugs, are now approved for the treatment of MS. Although they are partially effective, they are limited because of side-effects (Moreno et al. Citation2006). Thus, there has been growing interest to develop novel and safer medications from medicinal plants with anti-inflammatory or immunomudulatory properties of MS.
Hypericum perforatum (HP) or St. John’s wort, is a member of the Hypericaceae family. It has been used in traditional medicine for treatment of mild-to-moderate depression (Barnes et al. Citation2001). HP has also been used as an anti-oxidant, anti-inflammatory and wound-healing herbal drug (Süntar et al. Citation2010; Wolfle et al. Citation2014). Additionally, its role in the treatment of psychiatric and neurological disorders such as depression, Alzheimer’s and Parkinson’s diseases has been documented (Kraus et al. Citation2007; Gomez del Rio et al. Citation2013). Studies have indicated that HP contains bioactive constituents, including hyperforin (phloroglucinol), hypericin (naphthodianthrone), flavonoids and tannins (Barnes et al. Citation2001). Pharmacological studies have shown that hyperforin is the major component responsible for the anti-depressant and anti-inflammatory activities associated with the use of HP (Bhattacharya et al. Citation1998; Dell’Aica et al. Citation2007; Meinke et al. Citation2012).
According to the properties of H. perforatum extract and hyperforin, the main aim of this study was to evaluate the effects of several concentrations of these vegetal compounds on clinical and pathological symptoms of EAE with focus on the number of Treg cells in the EAE model.
Materials and methods
Animals
C57BL/6 mice (female, 8–10-weeks-old) were purchased from the Pasteur Institute of Iran (Tehran) and maintained in pathogen-free facilities kept at 23 [± 2] °C with a 50 [± 5]% relative humidity and with a 12-h light/dark cycle. All mice had ad libitum access to a standard rodent chow pellet diet and filtered water. The Animal Ethic Committee of Mashhad University of Medical Sciences approved all aspects of these studies.
Plant extract preparation
Aerial parts of H. perforatum were collected at a high altitude during April 2014 from Khorasan (Iran). A botanist at the Botany Research Division of Ferdowsi University (Mashhad, Iran) confirmed the sample identity. Harvested plant materials were dried and then powdered. To prepare a hydro-alcoholic extract, 100 g of powder was dissolved in ethanol-water (70/30, v/v). The solution was then placed on a shaker in the dark for 72 h. The resulting solution was filtered and the eluate placed in a rotary evaporator and processed at 40 °C under vacuum until only a slight residue remained. After collecting and weighing, the yield of extraction was calculated to be ≈10% (g residue/g starting material).
Endotoxin content in the extracts was determined using a limulus amoebocyte lysate (LAL) assay. In brief, equal quantities of endotoxin reference standard (or diluted extract) and LAL reagent (in endotoxin-free test tubes) were combined and incubated for 10 min at 37 °C. Thereafter, 0.1 ml substrate was added and the tubes gently shaken and re-incubated for 5 min at 37 °C. The reaction was stopped by addition of 0.3 ml 50% acetic acid solution and absorbance was read at 405 nm in a UV-1700 spectrophotometer (Shimadzu, Kyoto, Japan). Results indicated there was < 0.01 U endotoxin/μg present in the extract samples.
HPLC analysis of St. John’s wort extract
An HPLC method was developed to determine the hyperforin content in the extract. For sample preparation, 100 mg crude extract powder was weighed and transferred into a volumetric flask containing 70 ml of extraction solution (methanol-water, 80:20 [v/v]). Following 10 min sonication, the mixture was filtered through cellulose paper into a 10 ml volumetric flask and brought to volume with extraction solution. The HPLC analysis was then performed using a Wellchrom HPLC system with a K-1001 pump and K-2600 UV detector (Wellchrom-Knauer GmbH, Berlin, Germany). Specifically, a 20 μl sample of prepared extract [or standard] was injected into an EC Nucleodur C18 (5 μm i.d., 250 × 4.6 mm) column. Elution was then carried out using a mobile phase of acetonitrile: 0.3% phosphoric acid (90:10 [v/v]) at a flow rate of 1.5 ml/min. The effluent was monitored using an in-system UV detector at 273 nm. The quantification of hyperforin was achieved by plotting the peak height of each analyte vs concentration and the amount of hyperforin then extrapolated from a calibration curve constructed in parallel using a series of standard hyperforin solutions containing 10, 50 and 100 μg hyperforin/ml.
Experimental design
For the experiment, the mice were randomly allocated into seven groups (n = 8/group). The first group (vehicle control) had EAE induced and then received daily intraperitoneal (IP) treatment with phosphate-buffered saline (PBS, pH 7.4). For the treatment groups, two protocols were utilized. In the first, H. Perforatum extract (HPE) was administered in 50, 150 or 300 mg HPE/kg (low, intermediate and high doses) daily gavage to mice in Groups 2, 3 and 4, respectively, starting at Day 0 post-immunization (i.e. EAE induction). The doses were selected based on the findings of Bhattacharya et al. (Citation1998). In the second, hyperforin (Phtoplan Diehm & Neuberger GmbH, Heidelberg, Germany) was administered to mice in Groups 5, 6 and 7 at, respectively, 1, 5 and 10 mg/kg (low, intermediate and high doses) by daily IP injection starting at Day 0 post-immunization (i.e. EAE induction). These doses were selected based on the findings of Bray et al. (Citation2002) and Gibon et al. (Citation2013). All mice in the study were treated for 20 days and then processed on Day 21 for use in the various assays.
EAE induction
For EAE induction, all mice were immunized with synthetic peptide from myelin oligo-dendrocyte glycoprotein (MOG) amino acid residues 35–55 (MEVGWYRSPFSRVVHLYRNGK) (SBS Genetech Co. Ltd., Beijing, China). Induction was performed by preparing an emulsion of MOGp35–55 (300 μg) in complete Freund’s adjuvant containing 5 mg/ml heat-killed Mycobacterium tuberculosis (H37Ra strain; Sigma, St. Louis, MO); this yielded a solution of 1 mg MOG/ml. Each mouse received 200 μl of this emulsion by subcutaneous injection into two sites (100 μl/site) on its flank. Each mouse also received 250 ng pertussis toxin (Sigma) in a total volume of 400 μl PBS by IP injection on the day of immunization and 48 h later. Animals were weighed and then observed for clinical symptoms in a blinded manner. Disease severity of the induced EAE was performed according to a standard scale: 0 = no symptoms; 1 = partial loss of tail tonicity; 2 = complete loss of tail tonicity; 3 = flaccid tail and abnormal gait; 4 = hind leg paralysis; 5 = hind leg paralysis with hind body paresis; 6 = hind and foreleg paralysis; and 7 = death (Haghmorad et al. Citation2014).
Histologic analysis
On Day 21 after EAE induction, the mice were anesthetized with a mixture of ketamine (150 mg/kg) and xylazine (10 mg/kg) and their spleens were removed before undergoing intra-cardiac perfusion with PBS containing 4% paraformaldehyde. Paraffin embedded sections (5-μm thick) of the spinal cords were prepared and stained with hematoxylin and eosin (H&E) and Luxol fast blue (LFB) to assess leukocyte infiltration and demyelination, respectively. The sections were then evaluated by light microscopy in a blinded manner. Inflammation was determined using the following scale; 0 = No inflammation; 1 = small number of inflammatory cells; 2 = numerous infiltrating cells; and 3 = widespread infiltration. Demyelination was scored as; 0 = normal white matter; 1 = rare foci; 2 = a few areas of demyelination; and 3 = large areas of demyelination (Soellner et al. Citation2013; Mondal & Pahan Citation2015). Six serial sections of spinal cord/mouse were scored.
Proliferation assay
The effects of hyperforin and HPE on lymphocyte proliferation responses were determined using a BrdU assay. Immediately after euthanasia, spleens were isolated and subsequently dislodged cells then centrifuged at 2000 rpm for 5 min. The pellet was re-suspended in RBC lysis buffer (150 mM NH4Cl, 1 mM KHCO3, 0.1 mM EDTA [pH, 7.2]) for 10 min to lyse red blood cells present. After repeated washing with RPMI 1640 medium (by centrifugation) and then counting, the splenocytes were cultured (in triplicate) at 4 × 10⁵ cells/well in 96-well flat-bottom plates in complete RPMI supplemented with 10% FBS (fetal bovine serum; Gibco, Detroit, MI), 100 U penicillin/ml and 100 μg streptomycin/ml (Sigma), with or without the presence of MOG35–55 (20 μg/ml) for 48 h. For stimulated states, splenocytes were grown for 48 h in the complete RPMI 1640 with 10 μg PHA/ml (phytohemagglutinin, Sigma). Cell proliferation was determined using a BrdU ELISA kit (Roche Diagnostics GmbH, Mannheim, Germany). After 48 h, cells in each well were pulsed with BrdU labeling (100 μl/ml) solution and then incubated for a further 24 h. The plates were then centrifuged at 300 × g, the media was removed from each well and a fixation/denaturing solution was added for 30 min. The fixation/denaturing solution was thoroughly removed by flicking off and tapping and plates were then incubated with 100 μl kit-provided peroxidase-anti-BrdU conjugate solution at room temperature for 90 min. After washing with PBS, 100 μl TMB (tetramethylbenzidine) substrate was added; after 30 min, stop solution (H2SO4, 1 M) was added to each well. The optical density (OD) in each well was then analyzed at 450 nm using a microplate reader (DiaMed EuroGen, Turnhout, Belgium). For the assay, culture medium alone and cells incubated with anti-BrdU conjugated with peroxidase in the absence of BrdU were used as controls.
Detection of T-regulatory- (Treg) cells by flow cytometry
The effects of hyperforin and HPE on Treg cells were assessed by flow cytometry, using a mouse Treg cell staining kit (eBioscience, San Diego, CA). Spleen cells were isolated from all mice as outlined above. For marker staining, aliquots of 106 cells were washed and stained with fluorescein isothiocyanate (FITC)-conjugated rat anti-mouse CD4 (clone RM4) and phycoerythrin (PE)-conjugated rat anti-mouse CD25 (clone PC61.5) antibodies at 4 °C for 30 min. To stain for FoxP3, these cells were then fixed and permeabilized with kit-provided fixation/permeabilization buffer. The cells were then washed with permeabilization buffer and incubated in this buffer containing PE-Cy5 rat anti-mouse Foxp3 (clone FJK16s) antibody or isotype control (PE-Cy5 mouse IgG2a isotype control) at 4 °C for 30 min. Ultimately, all samples were washed and suspended in kit-provided staining buffer and then analyzed in a FACSCalibur system (BD Bioscience, San Diego, CA) with associated WinMDI 2.9 software. A minimum of 20 000 events in the lymphocyte gate was collected per sample.
Data analysis
All data were reported as mean ± SEM. Differences between groups were measured using one-way analysis of variance (ANOVA) followed by a Tukey post-hoc test (a Fishers Least Significant Difference [LSD] test was used in analyses of weight changes). Statistical evaluation was analyzed using SPSS 19 software (IBM SPSS, Armonk, NY). Statistical significance was defined as *p < 0.05, **p < 0.01 and ***p < 0.001.
Results
Chromatography
shows a typical chromatogram of the hyperforin standards and of the extract sample at 270 nm, respectively. Under the elution conditions, hyperforin was eluted at ≈20 min. The results indicated that the H. Perforatum extract (HPE) had a total hyperforin content of 30.6 mg/g HPE (μg/mg), with a good reproducibility between three separate sets of analyses.
Figure 1. HPLC chromatogram of (A) reference hyperforin standard with retention time ≈20 min (at 273 nm). (B) The peak in the HPLC chromatogram of St. John’s wort extract was identified by comparing the retention time and UV spectra of hyperforin in the sample with reference standards of hyperforin.
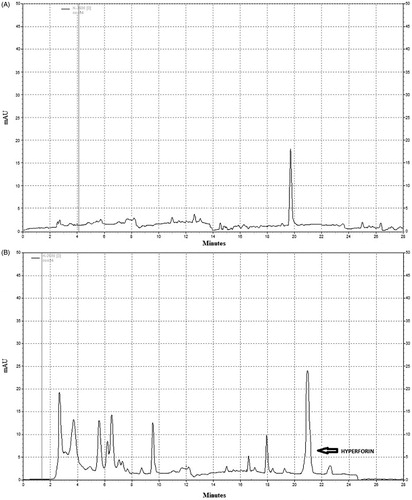
Based on these findings, this would mean that, when HPE was administered at 50, 150 or 300 mg HPE/kg (low, intermediate and high dose groups, respectively), those mice received ≈1.5, ≈4.6 and ≈9.2 mg hyperforin/kg, respectively. Such doses closely approximate those of the hyperforin alone that were administered to mice in the 1.0, 5.0 and 10.0 mg/kg (low, intermediate and high dose, respectively) groups.
Hyperforin and HPE effects on progression of clinical aspects of EAE
To evaluate the therapeutic potential of hyperforin and HPE against the progression of EAE, mice were induced to have EAE by immunization with MOGp35–55 and then treated with hyperforin, HPE or vehicle daily for 20 days. Severe EAE developed in all mice (100%) in the vehicle group (control) by Day 9 [mean day of onset = 9.60 ± 0.41] and reaching a maximum score of 4.5 ± 0.13 by Day 17. The high doses of hyperforin and HPE reduced the incidence of disease to 75% and 77.7%, respectively (, ), In addition, these treatments resulted in the first neurological deficits being observed on, respectively, Day 11.2 [± 0.25] and 10.8 [± 0.35], and reached peak stage only by Day 17.
Figure 2. Hyperforin and HPE ameliorate clinical symptoms associated with EAE. Mice were immunized with MOG35–55 peptide (in CFA) and then administered 1, 5 or 10 mg/kg hyperforin (low, intermediate, high doses) or 50, 150 or 300 mg/kg of HPE (low, intermediate, high doses) starting from Day 0 post-immunization onward for 20 days. Mice were monitored for signs of EAE and results presented as (A, B) mean clinical scores, (C, D) incidence of disease and (E, F) mean body weights. Values shown are mean ± SEM; n = 8 (Groups 1, 5, 6, 7) and n = 9 (Groups 2, 3, 4). *p < 0.05, **p < 0.01 vs vehicle control.
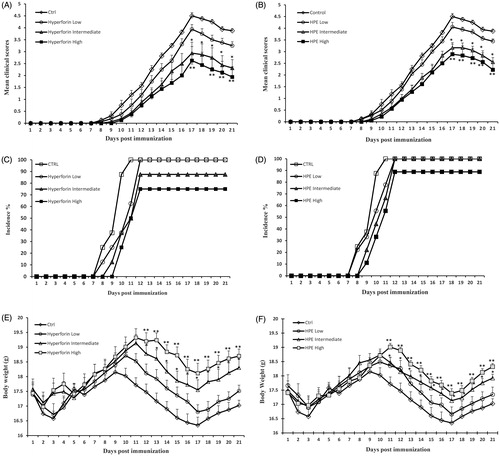
Table 1. Clinical features of EAE and effects of 20-day administration of hyperforin or HPE.
As shown in , treatment with a high dose of hyperforin markedly resulted in a significant reduction in the mean severity of EAE (maximum mean clinical score, MMCS: vehicle group [4.50 ± 0.13] vs hyperforin-treated mice [2.60 ± 0.58]; p < 0.01). The effect was dose-related as the high hyperforin dose imparted a greater inhibitory effect than did low and intermediate doses. Treatment with HPE delayed disease onset (). In Groups 3 and 4 (intermediate and high HPE doses), clinical scores were observed with a mean day of onset of 10.6 [± 0.4] and 10.8 [± 0.4] days post-immunization, respectively. The mean clinical score in mice in Groups 3 and 4 were significantly lower than of the vehicle mice (MMCS: vehicle [4.50 ± 0.13] vs 150 mg HPE/kg [3.10 ± 0.22]; p < 0.05, and vs 300 mg HPE/kg [2.80 ± 0.43]; p < 0.01). Moreover, cumulative scores for the hyperforin and HPE-treated mice were significantly lower (18.8 [± 4.2] and 22.5 [± 3.6]; p < 0.01, respectively) than the scores for the vehicle mice (37 [± 1.4]; ). In mice that received low doses of HPE or hyperforin (i.e. Groups 2 and 5), the hosts developed EAE to a less severe extent than did the control mice. However, the effect was not significant.
Hyperforin and HPE treatments effects on body weight loss
The effects of hyperforin and HPE on clinical signs were consistent with reductions in the expected loss of body weight during EAE hosts. A significant (p < 0.01) weight loss was noted over the 21 day period in the control mice (). High and intermediate doses of hyperforin or HPE markedly (p < 0.01 and p < 0.05, respectively) prevented this weight loss. This “protective” effect was more significant in the hyperforin-treated mice. In each low-dose group, weight loss was lower than that seen in the controls, but the change was not significant.
Hyperforin and HPE effects on inhibition of proliferative responses
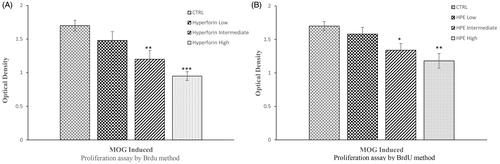
To investigate potential immuno-inhibitory effects from the hyperforin or HPE, a splenocyte proliferation assay was performed using a BrdU cell proliferation ELISA assay. As shown in , splenocytes isolated from MOG-immunized mice displayed a dose-related inhibition of proliferation as a result of the hyperforin or HPE treatments when those hosts’ cells were cultured in the presence of 20 μg MOG/ml (, respectively). Treatment groups that received high and intermediate doses of hyperforin or HPE exhibited markedly lower proliferative responses to MOG35–55, compared with the response of cells from the control mice. However, the inhibitory effect of high-dose hyperforin was slightly stronger than that from HPE. In the case of the low doses of hyperforin or HPE, proliferative responses were again lower than the control mice cells, but the change was not significant.
Figure 3. Hyperforin and HPE inhibit ex vivo splenocyte proliferation. EAE mice received (A) hyperforin or (B) HPE at the indicated doses starting at Day 0. On Day 21, mice were euthanized and splenocytes isolated and cultured with MOG35–55 (20 μg/ml) for 72 h. A BrdU cell proliferation assay was used to compare proliferation abilities of the various splenocyte groups. Data are presented as mean ± SEM; n = 8 (Groups 1, 5, 6, 7) and n = 9 (Groups 2, 3, 4) of three independent experiments. *p < 0.05, **p < 0.01, ***p < 0.001 vs vehicle control.
Hyperforin and HPE effects on demyelination/inflammation in spinal cord of EAE mice
Clinical evaluation of mice during the course of EAE showed that hyperforin and HPE treatments modulated the course/severity of EAE. To investigate underlying reasons for the improved clinical signs, histologic analyses of spinal cord sections from the vehicle and treated mice were performed to evaluate infiltration by mononuclear cells (inflammation) and myelin loss (demyelination). These features were scored semi-quantitatively. Consistent with the clinical results, in vehicle mice, there was both a massive infiltration of inflammatory cells into the spinal cord and significant local demyelination ().
Figure 4. Hyperforin and HPE treatment effects on pathologies associated with EAE. Spinal cords from each mouse (collected on Day 21 post-immunization) were fixed, embedded in paraffin, sections (5-μm) were prepared and the tissues were then stained with (A) H&E to permit enumeration of infiltrating cells and (B) Luxol fast blue to assess the extent of demyelination. (C, D) Histologic features were scored semiquantitatively as described in the Methods section. Values shown are mean ± SEM; n = 8 (Groups 1, 5, 6, 7) and n = 9 (Groups 2, 3, 4). *p < 0.05, **p < 0.01 vs vehicle-treated control.
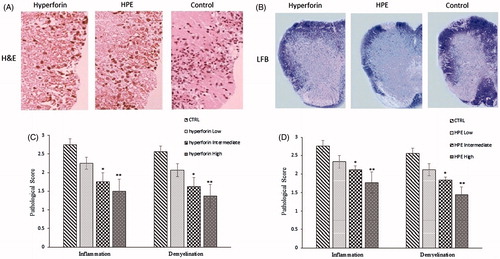
In spinal cords from hyperforin- or HPE-treated (intermediate or high dose) mice, inflammatory cell infiltration was decreased and there was also less demyelinated lesions noted. While cell infiltration and demyelination in response to the low doses of hyperforin and HPE were less than levels noted in the tissues from the control mice, these change differences were not significant. The results showed that a high dose of hyperforin or HPE could reduce the duration and clinical severity of EAE, in part due to reduced cellular infiltration into the spinal cord.
Analysis of Treg cell population in EAE mice
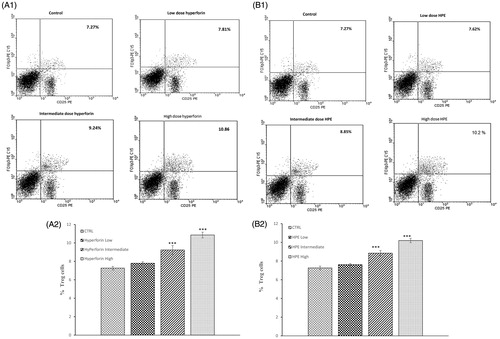
To investigate the effect of hyperforin and HPE on Treg cell populations in EAE mice, splenocytes from all mice were isolated on Day 21 post-immunization and analyzed by flow cytometry for CD4+CD25+Foxp3+ cells. The results revealed there was a dose-related increase in the percentage of Treg cells in the spleens of mice treated with HPE or hyperforin. Specifically, with the high or intermediate doses of hyperforin, levels of Treg cells increased to 9.24% (intermediate) and 10.86% (high) from 7.27% in the controls (), With the high or intermediate doses of HPE, levels of Treg cells increased to 8.85% (intermediate) and 10.2% (high) from 7.27% in the controls (). The low doses of either agent had no significant effect on this endpoint.
Figure 5. Effects from hyperforin and HPE administration upon T-regulatory (Treg) cell levels. Splenocytes from immunized mice treated with vehicle, Hyperforin (A1 and A2) or HPE (B1 and B2) were isolated at time of sacrifice (Day 21) and analyzed by flow cytometry. Mouse splenocytes were stained with anti-CD4 FITC, anti-CD25 PE, after which the cells were fixed, permeabilized and stained with anti-Foxp3 PE-CY5. Lymphocytes were gated by forward and side-scatter. Lymphocytes were then gated on the CD4+ population and quadrant marker then set on CD25 PE vs isotype control antibody-PE-CY5. Results shown are mean ± SEM; n = 8 (Groups 1, 5, 6, 7) and n = 9 (Groups 2, 3, 4). ***p < 0.001 vs vehicle control. Three independent experiments were performed with similar results.
Discussion
In this study, the efficacy of hyperforin and HPE in treating EAE in C57BL/6 mice was investigated. The results demonstrated that hyperforin and HPE reduced the severity of EAE and its associated loss of body weight and cell proliferation. These changes were observed in conjunction with reductions in expected levels of inflammatory cell infiltration into and demyelinated lesions within the spinal cord and occurred in a dose-related manner. Overall, the treatment with the high dose of hyperforin led to a more significant reduction in the severity of complications in EAE in comparison to that by HPE. In general, hyperforin was more effective than HPE in decreasing the severity of EAE and other clinical and laboratory outcomes, even though levels of hyperforin introduced into the hosts at matching low, intermediate and high doses were roughly equivalent. The potential for other agents in the HPE mitigating the impact of the hyperforin present remains to be determined.
Autoreactive T-cells play a crucial role in the pathogenesis of EAE (Kawakami et al. Citation2012). After EAE induction, autoantigen (in this study, MOG) is processed by antigen-presenting cells (APC) and presented to T-cells in the periphery. The T-cells proliferate and expand into autoreactive myelin specific T-cells that can then infiltrate into the central nervous system (CNS) and induce tissue damage and inflammation. In this study, it was found that both hyperforin and HPE inhibited T-cell proliferation after re-challenge with the autoantigen MOG. These results also showed that inhibition of EAE-associated clinical paralysis by hyperforin and HPE was associated with a decrease in infiltration of inflammatory cells and demyelination in the CNS.
Although the exact mechanism underlying how hyperforin and HPE reduced leukocyte infiltration is still unknown, it seemed likely that reduced proliferation of autoreactive T-cells in the periphery would lead to a decreased frequency of autoreactive T-cells available to attack the CNS. Such an outcome was consistent with the histological results here that showed less severe CNS damage and inflammation in the treatment groups in comparison with what was noted in tissues from the vehicle-treated EAE mice. Inhibitory effects of hyperforin and HPE on progression of autoimmune diseases have been reported previously (Kraus et al. Citation2007; Mohanasundari & Sabesan Citation2007). Cabrelle et al. (Citation2008) also showed both in vitro and in vivo, hyper-forin administration inhibited T-cell proliferation. Dell’Aica et al. (Citation2007) also reported that hyperforin reduced leukocyte infiltration into the CNS via down-regulation of signaling chemokines and expression of adhesion molecules.
These potential mechanisms of action of hyperforin and HPE were also supported, in part, by the results of the evaluation of CD4+CD25+Foxp3+ Treg cell populations in the spleens of treated hosts in the current study. Several studies have shown that a decreased number of Treg cells in patients with MS led to an expansion of autoreactive T-cells (Koutrolos et al. Citation2014). Therefore, an up-regulation of Foxp3+ Treg cells might be useful in suppressing the activation of autoreactive T-cells and, thus, controlling autoimmune disorders. Because Treg cell are involved in the pathogenesis of autoimmune diseases, the present study examined the effect of hyperforin and HPE on Treg cell populations in EAE mice. The results showed that administration of these agents led to an increase in the percentage of Treg cells in the spleen, in a dose-related manner. Interestingly, this change was more significant in hosts that received the hyperforin. Thus, it seems hyperforin and HPE (especially the former) might be exerting immunoregulatory effects by decreasing inflammation and causing subsequent improvements in the clinical outcomes of EAE hosts. These effects would be in keeping with those seen in several investigations in animal models that reported that hyperforin regulated inflammation associated with immune-based diseases such as irritable bowel syndrome, Parkinson’s disease and Alzheimer’s diseases (Kraus et al. Citation2007; Mohanasundari & Sabesan Citation2007; Mozaffari et al. Citation2011). Similarly, the current results would be in line with earlier studies that reported on how H. perforatum could be used as an anti-inflammatory, an anti-oxidant and/or a wound healing agent (Süntar et al. Citation2010; Wolfle et al. Citation2014).
Taking all of the results together, it could be concluded that hyperforin or HPE ameliorate clinical manifestations of EAE; in part, by decreasing the number/function of immune cells. Further, the results here demonstrated that hyperforin or HPE could cause augmentation in Treg cell levels in situ. Thus, although, it may be hypothesized that one mechanism by which each of these agents suppresses inflammatory responses in an EAE model is by specifically inducing/enhancing Treg cells.
Conclusions
The current results showed that hyperforin and HPE treatment were effective in ameliorating the clinical and pathological signs of EAE in mice. These effects were associated with a reduced infiltration of inflammatory cells and demyelination in the CNS, as well as with a reduced proliferation of autoreactive T-cells, especially those which could lead to Treg cell number expansion. According to these findings, it would appear that hyperforin and HPE could play crucial roles in the modulation of immune responses and, hence, have the potential to be considered as useful candidates for the treatment of MS.
Acknowledgements
The authors wish to thank the authorities in the Research Council of Mashhad University of Medical Sciences (MUMS) for financial support (Grant #910234).
Disclosure statement
The authors report no conflicts of interest. The authors alone are responsible for the content and writing of the paper.
References
- Barnes J, Anderson LA, Phillipson JD. 2001. St John's wort (Hypericum perforatum L.): a review of its chemistry, pharmacology and clinical properties. J Pharm Pharmacol. 53:583–600.
- Barten LJ, Allington DR, Procacci KA, Rivey MP. 2010. New approaches in the management of multiple sclerosis. Drug Design Devel Ther. 4:343.
- Batoulis H, Addicks K, Kuerten S. 2010. Emerging concepts in autoimmune encephalomyelitis beyond the CD4/T H 1 paradigm. Ann Anat-Anatom Anzeiger. 192:179–193.
- Bhattacharya S, Chakrabarti A, Chatterjee S. 1998. Activity profiles of two hyperforin-containing hypericum extracts in behavioral models. Pharmacopsychiatry. 31:22–29.
- Bray BJ, Brennan NJ, Perry NB, Menkes D, Rosengren R. 2002. Short-term treatment with St. John's wort, hypericin or hyperforin fails to induce CYP450 isoforms in Swiss Webster mouse. Life Sci. 70:1325–1335.
- Brück W. 2005. Pathology of multiple sclerosis is the result of focal inflammatory demyelination with axonal damage. J Neuro. 252:v3–v9.
- Cabrelle A, Dell’aica I, Melchiori L, Carraro S, Brunetta E, Niero R, Scquizzato E, D Intino G, Calzà L, Garbisa S. 2008. Hyperforin down-regulates effector function of activated T-lymphocytes and shows efficacy against TH1-triggered CNS inflammatory-demyelinating disease. J Leukocyte Biol. 83:212–219.
- Corsini E, Oukka M, Pieters R, Kerkvliet NI, Ponce R, Germolec DR. 2011. Alterations in regulatory T-cells: Re-discovered pathways in immunotoxicology. J Immunotoxicol. 8:251–257.
- Cristofanilli M, Rosenthal H, Cymring B, Gratch D, Pagano B, Xie B, Sadiq SA. 2014. Progressive multiple sclerosis cerebrospinal fluid induces inflammatory demyelination, axonal loss, and astrogliosis in mice. Exp Neurol. 261:620–632.
- Dell’aica I, Niero R, Piazza F, Cabrelle A, Sartor L, Colalto C, Brunetta E, Lorusso G, Benelli R, Albini A. 2007. Hyperforin blocks neutrophil activation of matrix metalloproteinase-9, motility and recruitment, and restrains inflammation-triggered angio-genesis and lung fibrosis. J Pharmacol Exp Ther. 321:492–500.
- Fritzsching B, Haas J, König F, Kunz P, Fritzsching E, Pöschl J, Krammer PH, Brück W, Suri-Payer E, Wildemann B. 2011. Intracerebral human regulatory T-cells: Analysis of CD4+CD25+FoxP3+ T-cells in brain lesions and cerebrospinal fluid of multiple sclerosis patients. PLoS One. 6:e17988.
- Gibon J, Deloulme JC, Chevallier T, Ladeveze E, Abrous DN, Bouron A. 2013. The anti-depressant hyperforin increases the phosphorylation of CREB and expression of TrkB in a tissue-specific manner. Intl J Neuropsychopharmacol. 16:189–198.
- Gomez Del Rio M, Sánchez-Reus M, Iglesias I, Pozo M, Garcia-Arencibia M, Fernandez-Ruiz J, García-García L, Delgado M, Benedí J. 2013. Neuroprotective properties of standardized extracts of Hypericum perforatum on rotenone model of Parkinson’s disease. CNS Neurol Disorders. 12:665–679.
- Haghmorad D, Amini AA, Mahmoudi MB, Rastin M, Hosseini M, Mahmoudi M. 2014. Pregnancy level of estrogen attenuates experimental autoimmune encephalomyelitis in both ovariectomized and pregnant C57BL/6 mice through expansion of Treg and TH2 cells. J Neuroimmunol. 277:85–95.
- Hemmer B, Nessler S, Zhou D, Kieseier B, Hartung H-P. 2006. Immunopathogenesis and immunotherapy of multiple sclerosis. Nat. Clin. Practice Neurol. 2:201–211.
- Kawakami N, Bartholomäus I, Pesic M, Mues M. 2012. An autoimmunity odyssey: How autoreactive T-cells infiltrate into the CNS. Immunol Rev. 248:140–155.
- Koutrolos M, Berer K, Kawakami N, Wekerle H, Krishnamoorthy G. 2014. Treg cells mediate recovery from EAE by controlling effector T-cell proliferation and motility in the CNS. Acta Neuropathol Commun. 2:163.
- Kraus B, Wolff H, Heilmann J, Elstner EF. 2007. Influence of Hypericum perforatum extract and its single compounds on amyloid-β-mediated toxicity in microglial cells. Life Sci. 81:884–894.
- Markoullis K, Sargiannidou I, Gardner C, Hadjisavvas A, Reynolds R, Kleopa KA. 2012. Disruption of oligodendrocyte gap junctions in experimental autoimmune encephalo-myelitis. Glia. 60:1053–1066.
- Meinke MC, Schanzer S, Haag SF, Casetti F, Müller ML, Wölfle U, Kleemann A, Lademann J, Schempp CM. 2012. In vivo photoprotective and anti-inflammatory effect of hyperforin is associated with high anti-oxidant activity in vitro and ex vivo. Eur J Pharm Biopharm. 81:346–350.
- Mix E, Meyer-Rienecker H, Hartung HP, Zettl UK. 2010. Animal models of multiple sclerosis – potentials and limitations. Prog Neurobiol. 92:386–404.
- Mohanasundari M, Sabesan M. 2007. extract on astrocytes in MPTP induced Parkinson’s disease in mice. Eur Rev Med Pharmacolog Sci. 11:17–20.
- Mondal S, Pahan K. 2015. Cinnamon ameliorates experimental allergic encephalomyelitis in mice via regulatory T-cells: Implications for Multiple Sclerosis therapy. PLoS One 10:e0116566.
- Moreno B, Hevia H, Santamaria M, Sepulcre J, Muñoz J, García-Trevijano ER, Berasain C, Corrales FJ, Avila MA, Villoslada P. 2006. Methylthioadenosine reverses brain auto-immune disease. Ann Neurol. 60:323–334.
- Mozaffari S, Esmaily H, Rahimi R, Baeeri M, Sanei Y, Asadi-Shahmirzadi A, Salehi-Surmaghi M-H, Abdollahi M. 2011. Effects of Hypericum perforatum extract on rat irritable bowel syndrome. Pharmacog Mag. 7:213.
- Sakaguchi S, Ono M, Setoguchi R, Yagi H, Hori S, Fehervari Z, Shimizu J, Takahashi T, Nomura T. 2006. FoxP3+CD25+CD4+ natural regulatory T-cells in dominant self‐tolerance and autoimmune disease. Immunol Rev. 212:8–27.
- Schneider C, Schuetz G, Zollner TM. 2009. Acute neuroinflammation in Lewis rats: A model for acute multiple sclerosis relapses. J Neuroimmunol. 213:84–90.
- Soellner IA, Rabe J, Mauri V, Kaufmann J, Addicks K, Kuerten S. 2013. Differential aspects of immune cell infiltration and neurodegeneration in acute and relapse experimental autoimmune encephalomyelitis. Clin Immunol. 149:519–529.
- Stadelmann C, Wegner C, Brück W. 2011. Inflammation, demyelination, and degeneration – recent insights from MS pathology. Biochim Biophys Acta. 1812:275–282.
- Süntar IP, Akkol EK, Yılmazer D, Baykal T, Kirmizibekmez H, Alper M, Yesilada E. 2010. Investigations on the in vivo wound healing potential of Hypericum perforatum L. J Ethnopharmacol. 127:468–477.
- Wolfle U, Seelinger G, Schempp CM. 2014. Topical application of St. John's wort (Hypericum perforatum). Planta Med. 80:109–120.