
Abstract
Regulatory guidelines for pharmaceutical toxicity studies recommend using one dose near the maximum tolerated. At that level significant toxicities may occur, leading to systemic stress and secondary immune suppression which can be difficult to differentiate from a primary drug effect. Therefore, there is a need for a biomarker of stress applicable to toxicity studies. This study evaluated urinary corticosterone as a biomarker, using as a pharmacologic stressor fenitrothion, which was previously shown not to cause primary immune suppression. Rats were administered fenitrothion orally at 20 and 30 mg/kg daily for 2 or 8 days, with matched vehicle controls (n = 6/group). Urine was collected for 6 and 24 h, before treatment and on Day 2 and Day 8. Urine was assayed for corticosterone, separately for the first 6 h of collection and for the whole 24 h sample. Animals were euthanized on Day 3 or Day 9 and lymphoid tissue samples were collected, weighed and examined histologically. Treated rats showed neurologic signs following treatment. Findings also included time- and dose-dependent decreases in body weight and spleen and thymus weight decreases supra-proportional to body weight on Day 9. Histologic changes were mild at a dose of 20 mg/kg, but significant at 30 mg/kg, consisting of lymphocytolysis at Day 3 and lymphoid depletion at Day 9. Urine corticosterone levels were increased on Day 2 and Day 8, in the 6-h samples, but not the 24-h ones, at both dose levels. Based on the results, urine corticosterone appears to be a sensitive biomarker of systemic stress caused by fenitrothion. Other chemical stressors should be evaluated in a similar manner in order to fully validate urine corticosterone measurement as a stress biomarker.
Introduction
Pre-clinical safety assessment of drugs in animals currently requires using dosages close to the maximum tolerated dose (MTD). Such doses may cause significant toxicity in at least one organ system, which in turn can lead to a systemic neuroendocrine stress response releasing high levels of endogenous stress hormones such as cortisol or corticosterone (Vos Citation1977). These hormones can have significant immunosuppressive effects (O’Connor et al. Citation2000). Therefore, in the safety assessment of a drug, it is necessary to be able to differentiate a primary immunotoxic effect from secondary stress-induced immunosuppression, because the latter should not occur in humans using the drug at an appropriate dosage and, thus, has little relevance to the toxicity profile of a drug. Currently, this differentiation is done mainly on an empirical basis. Effects seen at the highest dose only, associated with systemic toxicity and body weight loss, and consistent with known hematologic and histologic effects of stress hormones are interpreted as most likely due to stress (Everds et al. Citation2013). However, because of the significant variability of these parameters, there is a need for methods that would allow one to identify stress responses in a more specific and definitive way.
The blood level of corticosterone, the principal stress hormone of rodents, is an obvious choice as a biomarker of stress. However, because of the physiologic circadian variation and the pulsatile secretion of corticosterone in rodents (Windle et al. Citation1998), a representative measurement of blood corticosterone levels requires multiple daily sampling and calculation of the area under the curve of concentration over time (Pruett et al. Citation1999). This makes serum corticosterone measurement labor intensive, requires significant amounts of blood and, because of the repeated sampling, may in itself stress the animals, confounding the results. Measurement of corticosterone in urine could be an easier way of detecting an increase in production, as samples can be easily collected with minimal handling and urine excreted over a certain time period is expected to reflect total corticosterone production during that period (Pruett et al. Citation2008). However, the proper methodologic approach for urine collection and analysis has not been thoroughly investigated and the feasibility and sensitivity of urine corticosterone measurement as a marker of stress in the context of a typical preclinical toxicity study have not been previously evaluated.
Reported models of stress in rats have mostly used situational stressors (restraint, swimming, cold temperature, etc.) or feed restriction (Levin et al. Citation1993). It is not clear whether such methods yield results that can be extrapolated to situations of chemically-induced stress. Ethanol has been used as a chemical stressor in mice and rats; however, ethanol administration leads to complete habituation within a few days (Seeley et al. Citation1996) and is, therefore, not an appropriate model for the sub-chronic or chronic stress observed in pre-clinical studies.
Fenitrothion (Ft) is an organophosphate pesticide that has been shown to be non-toxic to lymphoid tissues and not to cause immune function changes when administered below the MTD, but to cause a significant stress response and stress-related immune changes at the MTD, without habituation (Kunimatsu et al. Citation1996). It was, therefore, used in the present study as a model of chemically-induced stress, in order to investigate the feasibility, sampling methodology and sensitivity of urinary corticosterone measurement as a stress biomarker.
Materials and methods
Animals
Thirty-six male Sprague-Dawley (Crl:CD IGS BR) rats were obtained from Charles River Laboratories (Raleigh, NC). The rats were housed in a pathogen-free facility maintained at 20–26 °C with 30–70% relative humidity and a 12-h light:dark cycle. Food (PMI 5002, PMI Feeds, St. Louis, MO) and water were provided ad libitum for the duration of the study. All experiments were carried out as per guidelines and study protocols reviewed and approved by the Pfizer Institutional Animal Care and Use Committee.
Treatment
All rats were allowed 10 days to acclimate prior to the start of dosing. For the experiments, rats were randomly assigned to six groups of equivalent mean weights (mean group weights = 311–318 g at dosing start). Fenitrothion (purity 99.5%, ChemService, West Chester, PA) was dissolved in corn oil and administered at 20 or 30 mg/kg/day (groups Ft20 and Ft30, respectively) by oral gavage (4 ml/kg dose volume). Dosing was once a day between 7 and 8 AM, for either 2 or 8 consecutive days (Groups Ft20-2d, Ft20-8d, Ft30-2d, Ft30-8d). Matched control groups were administered similar volumes of corn oil only, for the same dosing periods (Groups Ctl-2d, Ctl-8d).
Parameters
Body weight was measured daily during dosing. Clinical signs were recorded twice daily. Urine was collected for 24-h periods at three timepoints: 5 days before dosing start (pre-sample, all groups), then immediately after dosing on Day 2 (all groups) and Day 8 (Groups Ctl-8d, Ft20-8d, Ft30-8d). Animals were euthanatized by CO2 inhalation and exsanguination 24 h after their final dose, either on Day 3 (groups Ctl-2d, Ft20-2d, Ft30-2d) or Day 9 (Ctl-8d, Ft20-8d, Ft30-8d). Blood for hematology was collected in EDTA by abdominal vena cava puncture immediately after CO2 inhalation and a complete blood count (CBC) was performed on an Advia 120 hematology analyzer (Bayer, Tarrytown, NJ).
At necropsy, the adrenal glands, brain, liver, spleen and thymus were dissected from surrounding tissues and weighed. Adrenal glands, brain, ileum with Peyer’s patch, liver, lymph nodes (inguino-femoral and mesenteric), pituitary gland, spleen and thymus were each immersion-fixed in 10% neutral-buffered formalin solution and processed for hematoxylin and eosin (H&E) staining by routine methods. Histologic changes were graded as slight, mild, moderate or marked.
Urine collection
The rats were placed in metabolic cages for 24 h, during which time they had access to food and water. Urine was collected in conical tubes kept at 4 °C by a cooling system. All the urine obtained after 6 h of collection was removed and separate tubes then used for collection over the remaining 18 h. The volumes of all samples were recorded. Urine samples were centrifuged at 2200 rpm for 10 min, to separate fluid from sediment. A 0.5 ml aliquot was taken from each of the 6-h samples for the assays and the remainder was combined with the corresponding 18-h samples to provide 24-h samples. All samples were then frozen at −80 °C until assayed. Urine corticosterone (including metabolites) was assayed using a double-antibody 125I-radioimmunoassay kit for rat serum corticosterone (MP Biomedicals, Irvine, CA). The assay was performed per manufacturer protocols, but with samples diluted 1:20 instead of 1:200. Urinary creatinine was measured on a Hitachi 917 chemistry analyzer (Roche Diagnostics, Indianapolis, IN) using a modified Jaffe method. Urine corticosterone levels were compiled as concentration (in ng/ml), as the ratio of corticosterone to creatinine and as total corticosterone output (in ng) that was obtained by multiplying concentration by urine volume.
Statistical analysis
Differences in various parameters between treated and control rats were evaluated for statistical significance using Prism (v.4.0) software (GraphPad, San Diego, CA). By default, one-way analysis of variance (ANOVA) was used to test for differences between control, Ft20 and Ft30 groups separately at each timepoint (Day 2 or Day 8). When a significant (p < 0.05) p value was found with ANOVA, a Tukey’s multiple comparison test was used to evaluate between-group differences. When a Bartlett’s test for equal variances showed significant between-group differences, a non-parametric analysis Kruskal-Wallis test was used instead of the ANOVA, with Dunn’s test as a post-hoc test for assessing between-group differences. In addition, the correlation between total urine corticosterone and organ:brain weight ratios was investigated using Pearson’s test and calculating the r2.
Results
In the Ft20 groups, the main clinical signs were intermittent loose stools (5/11 rats) and intermittent muscle fasciculations or tremors (9/11). In the rats treated for 8 days, there was also fur staining in the peri-nasal and/or ano-genital areas (4/6) and decreased activity (2/6). In the Ft30 groups, all animals had the above clinical signs and, in addition, showed salivation and hyper-reactivity. Because of worsening signs and body condition on Day 7, rats in the Ft30-8d group were not dosed that day and one rat was euthanatized. The remaining animals received their last dose on Day 8.
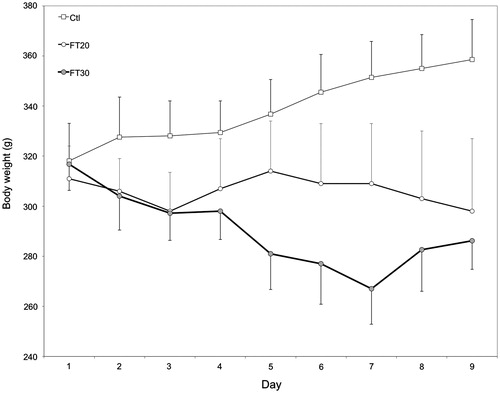
shows body weight changes during dosing. Animals in the Ft20-8d group lost 13 g between Day 1 and Day 9 (4% weight loss) and the Ft30-8d group lost 31 g (10% weight loss). In contrast, control rats gained 44 g (15% weight gain). The mean terminal body weights of the Ft20-8d and Ft30-8d groups were 83% and 80% that of the Ctl-8d group, respectively.
Figure 1. Body weight changes during administration of fenitrothion at 20 or 30 mg/kg/day (Ft20, Ft30). Bar = 1 SD. *Ft30-8d rats were not dosed on Day 7 because of marked weight loss and clinical signs.
The major hematology parameters are shown in . There was a mild increase in erythrocyte count in the Ft30-2d group, but not in the Ft30-8d group.
Table 1. Hematologic values in rats administered fenitrothion.
Urine corticosterone levels measured either as total output or as corticosterone/creatinine ratio showed similar patterns in results, but with somewhat more variability in the corticosterone/creatinine ratio data. Corticosterone concentration showed the highest degree of variability, most likely because of individual variability in urine output. Therefore, the total corticosterone output data was considered most robust and is presented below.
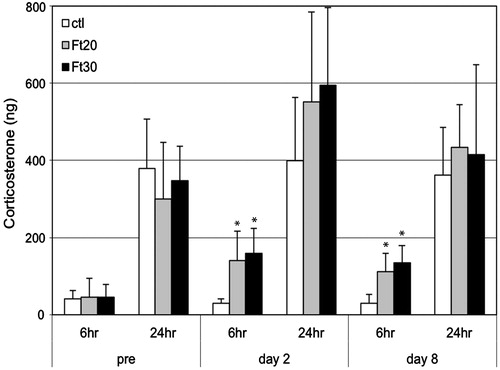
Urine corticosterone was significantly increased in the 6-h samples of Ft20 and Ft30 rats compared to controls, both on Day 2 and Day 8 (). Mean urine corti-costerone in the Ft20 and Ft30 groups was 3.8–5.5-times higher than controls at these timepoints. There was no significant difference between the Ft20 and the Ft30 groups. In the 24 h samples, differences between treated and control groups were not statistically significant.
Figure 2. Total urinary corticosterone output at pre-treatment and at Day 2 and Day 8 of fenitrothion administration at 20 or 30 mg/kg/day (Ft20, Ft30). Values are from urine samples collected for 6 h or for 24 h post-administration. Bar = 1 SD. *Value significantly different from control (p < 0.01).
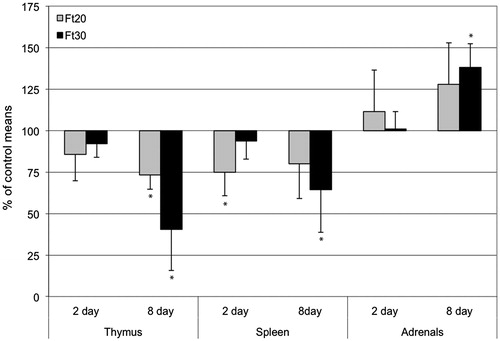
Because of the lower terminal body weights in treated rats, organ weights were evaluated relative to brain weights. Differences with control organ weights are shown in . After 2 days of treatment, only spleen weights of the Ft20 group were significantly changed (75% of control mean). After 8 days, thymus and spleen weights of the Ft30-8d group were decreased (40% and 64% of control means, respectively) and adrenal weights of both Ft20-8d and Ft30-8d groups were increased (128% and 138% of control means, respectively). In rats treated for 8 days, there was a significant negative correlation between urine corticosterone and the weight ratios of thymus (p < 0.05, r2 = 0.33) and spleen (p < 0.01, r2 = 0.40) and a positive correlation with adrenals (p < 0.01, r2 = 0.44). There was no significant correlation between urine corticosterone and organ weights in animals treated for 2 days.
Figure 3. Changes in organ weights (relative to brain weight) after 2 and 8 days of administration of fenitrothion at 20 or 30 mg/kg/day (Ft20, Ft30). Values shown are percentages of corresponding control group means. Bar = 1 SD. *Value significantly different from control (p < 0.01).
The only histologic finding observed in the Ft20 animals was a slight increase in apoptotic lymphocytes and cell debris in the thymic cortex of 1/6 rats treated for 8 days (). In the Ft30 rats, this thymic lymphocyte lysis was more pronounced and seen in the 2d (2/6) or 8d (3/6) groups. In addition, there was mild-to-moderate thymic cortical lymphocyte depletion in 5/6 Ft30-8d rats. All Ft30-8d rats had either lymphocyte lysis or depletion. The spleen and lymph nodes did not show clear histologic changes, apart from the one animal of the Ft30 group which was euthanized in poor condition at Day 7 and which showed lymphocyte lysis and depletion in all lymphoid tissues.
Table 2. Histologic findings in rats administered fenitrothion.
Discussion
Fenitrothion at 30 mg/kg/day caused clinical signs of cholinesterase inhibition, with decreases in body weight up to 10%. One animal at this dose had to be euthanized because of poor body condition. The typical stress-induced tissue changes of lymphocyte apoptosis and/or depletion in the thymic cortex (Gopinath Citation1996) was observed in some 2-day-treated animals and in all 8-day treated, with significant decreases in the weights of spleen and thymus in the latter. This dose level was, therefore, considered close to the maximum tolerated dose and an adequate model to evaluate high stress due to systemic toxicity. In contrast, at 20 mg/kg/day, the clinical signs were milder, body weights remained similar to pre-treatment levels, organ weight changes were less pronounced and histologic changes were absent or slight. This dose level was, therefore, interpreted as causing a lower stress level. Stress studies using moderate feed restriction, leading to stable body weight rather than weight loss, similarly show no histologic changes in lymphoid tissues, even though organ weights may be decreased (Levin et al. Citation1993; Mitsumori et al. Citation1996).
Urinary corticosterone levels (measured as total corticosterone output or normalized to creatinine) were significantly increased in treated rats, at ∼ 3–5-times the level of controls. The increases in corticosterone were seen in the samples collected for 6 h post-final dose, but not in the cumulative 24 h samples. This is likely because the 6 h collection coincided with the main clinical effects of fenitrothion; clinical signs were generally not apparent by 24 h post-dose. In addition, the 24 h collection included the hours from 2 PM to 8 AM, when normal urine corticosterone is known to be highest in the rat (Eriksson et al. Citation2004). Stress-induced increases in corticosterone are, therefore, likely easier to detect during morning hours, at the physiologic trough of corticosterone production. However, the collection period for other potential chemical stressors should be adapted to each chemical such that it coincides with its maximal pharmacologic effects.
Interestingly, the increases were of similar amplitude in the Ft20 and Ft30 rats, even though the Ft20 rats had clearly milder stress-related tissue changes. The cause for this was unclear, but it may have been related to a limit in the rate of renal corticosterone excretion. In any case it suggests that urine corticosterone measurement is a sensitive stress marker, as it was significantly increased in animals that had only slight stress-induced tissue changes. However, it might not be adequate to quantitatively grade different stress levels or may not correlate fully with histopathologic tissue effects, when measured as it was in this study.
Stress is well known to cause a hematologic response, characterized in rats by variable combinations of increased neutrophil and monocyte counts and decreased lymphocyte and eosinophil counts (Bean-Knudsen and Wagner Citation1987; Ogawa et al. Citation1985). This stress response was not apparent in rats of this study, at either treatment duration. The cause for this was unclear. The only treatment-related change noted was an increase in red blood cell counts in the Ft30-2d group; the cause for this change was uncertain, but may have been related to mild transient dehydration.
Results of this study suggest that measurement of urine corticosterone can be a valid and sensitive biomarker of pharmacologically-induced stress. Although urine collection required the use of metabolic cages, results showed that a relatively short, 6-h collection period was amply sufficient to detect corticosterone increases after dosing and that measurement of corticosterone output over that period was sufficiently robust and did not require normalization with a measure of urine concentration like creatinine. Therefore, use of this biomarker should be well within the reach of any well-appointed pre-clinical testing facility. Although we would not advocate this measurement as a routine procedure, it could be indicated as a prospective approach for studies in which high-dose animals show body weight decreases during the in vivo phase, suggesting that stress effects may be need to be investigated. Although histology and terminal hematology may often be sufficient to conclude that observed lymphoid tissue changes are stress-induced, this interpretation can sometimes be open to doubt, especially considering the normal individual variability of these changes. Having a direct measurement of increased corticosterone production would provide strong additional support for lymphoid changes being due to a stress response, rather than due to primary immune suppression.
To our knowledge, this is the first published study evaluating methodologic factors affecting urine corticosterone measurement as a stress biomarker in a context representative of a pre-clinical toxicologic study. As such, it should be considered a pilot biomarker development study. Further work is indicated to evaluate urine corticosterone measurement in situations of more long-lasting stress and in stress models using compounds of different pharmacology, in order to conclude whether the changes observed with fenitrothion can be generalized to other pharmacologic stressors. It may also be useful to show that primary immune suppression due to a test compound does not in itself lead to a stress response.
Acknowledgements
The authors wish to thank Thomas T. Kawabata for his input on study design, data analysis and manuscript review.
Disclosure statement
The authors report no conflicts of interest. The authors alone are responsible for the content and writing of the paper.
References
- Bean-Knudsen DE, Wagner JE. 1987. Effect of shipping stress on clinicopathologic indicators in F344/N rats. Am J Vet Res. 48:306–308.
- Eriksson E, Royo F, Lyberg K, Carlsson HE, Hau J. 2004. Effect of metabolic cage housing on immunoglobulin A and corticosterone excretion in feces and urine of young male rats. Exp Physiol. 89:427–433.
- Everds NE, Snyder PW, Bailey KL, Bolon B, Creasy DM, Folwy GL, Rosoal TJ, Sellers T. 2013. Interpreting stress responses during routine toxicity studies: A review of the biology, impact and assessment. Toxicol Pathol. 41:560–614.
- Gopinath C. 1996. Pathology of toxic effects on immune system. Inflamm Res. 45 (Suppl 2):S74–78.
- Kunimatsu T, Kamita Y, Isobe N, Kawasaki H. 1996. Immunotoxicological insignificance of fenitrothion in mice and rats. Fundam Appl Toxicol. 33:246–253.
- Levin S, Semler D, Ruben Z. 1993. Effects of two weeks of feed restriction on some common toxicologic parameters in Sprague-Dawley rats. Toxicol Pathol. 21:1–14.
- Mitsumori K, Takegawa K, Shimo T, Onodera H, Yasuhara K, Takahashi M. 1996. Morphometric and immunohistochemical studies on atrophic changes in lymphohemato-poietic organs of rats treated with piperonyl butoxide or subjected to dietary restriction. Arch Toxicol. 70:809–814.
- O’Connor TM, O'Halloran DJ, Shanahan F. 2000. The stress response and the hypothalamic-pituitary-adrenal axis: From molecule to melancholia. QJM 93:323–333.
- Ogawa Y, Matsumoto K, Kamata E, Ikeda Y, Kaneko T. 1985. Effect of feed restriction on peripheral blood and bone marrow cell counts of Wistar rats. Jikken Dobutsu. 34:407–416.
- Pruett SB, Collier S, Wu WJ, Fan R. 1999. Quantitative relationships between the suppression of selected immunological parameters and the area under the corticosterone concentration vs. time curve in B6C3F1 mice subjected to exogenous corticosterone or to restraint stress. Toxicol Sci. 49:272–280.
- Pruett S, Lapointe JM, Reagan W, Lawton M, Kawabata TT. 2008. Urinary cortico-sterone as an indicator of stress-mediated immunological changes in rats. J Immunotoxicol. 5:17–22.
- Seeley RJ, Hawkins M, Ramsay DS, Wilkinson C, Woods SC. 1996. Learned tolerance to corticosterone-increasing action of ethanol in rats. Pharmacol Biochem Behav. 55:268–273.
- Vos JG. 1977. Immune suppression as related to toxicology. CRC Crit Rev Toxicol. 5:67–101.
- Windle RJ, Wood SA, Lightman SL, Ingram CD. 1998. The pulsatile characteristics of hypothalamo-pituitary-adrenal activity in female Lewis and Fischer 344 rats and its relationship to differential stress responses. Endocrinology. 139:4044–4052.