
Abstract
Individuals exposed to beryllium (Be) may develop Be sensitization (BeS) and progress to chronic beryllium disease (CBD). Recent studies with other metal antigens suggest epigenetic mechanisms may be involved in inflammatory disease processes, including granulomatous lung disorders and that a number of metal cations alter gene methylation. The objective of this study was to determine if Be can exert an epigenetic effect on gene expression by altering methylation in the promoter region of specific genes known to be involved in Be antigen-mediated gene expression. To investigate this objective, three macrophage tumor mouse cell lines known to differentially produce tumor necrosis factor (TNF)-α, but not interferon (IFN)-γ, in response to Be antigen were cultured with Be or controls. Following challenges, ELISA were performed to quantify induced TNFα and IFNγ expression. Bisulfate-converted DNA was evaluated by pyrosequencing to quantify CpG methylation within the promoters of TNFα and IFNγ. Be-challenged H36.12J cells expressed higher levels of TNFα compared to either H36.12E cells or P388D.1 cells. However, there were no variations in TNFα promoter CpG methylation levels between cell lines at the six CpG sites tested. H36.12J cell TNFα expression was shown to be metal-specific by the induction of significantly more TNFα when exposed to Be than when exposed to aluminum sulfate, or nickel (II) chloride, but not when exposed to cobalt (II) chloride. However, H36.12J cell methylation levels at the six CpG sites examined in the TNFα promoter did not correlate with cytokine expression differences. Nonetheless, all three cell lines had significantly more promoter methylation at the six CpG sites investigated within the IFNγ promoter (a gene that is not expressed) when compared to the six CpG sites investigated in the TNFα promoter, regardless of treatment condition (p < 1.17 × 10⁻⁹). These findings suggest that, in this cell system, promoter hypo-methylation may be necessary to allow expression of metal-induced TNFα and that promoter hyper-methylation in the IFNγ promoter may interfere with expression. Also, at the dozen CpG sites investigated in the promoter regions of both genes, beryllium had no impact on promoter methylation status, despite its ability to induce pro-inflammatory cytokine expression.
Introduction
Inhalation of particulate forms of beryllium (Be) metal, beryllium oxide ceramics or Be-containing alloys can lead to beryllium sensitization (BeS) (Baggerly et al. Citation2004), an adaptive immune response to Be (Newman & Kreiss Citation1992; Kelleher et al. Citation2001; Infante & Newman Citation2004; Maier et al. Citation2008) in a proportion of exposed individuals. BeS has been shown to presage the development of chronic beryllium disease (CBD) at a rate of 6–8% per year (Newman et al. Citation2005). In CBD, individuals demonstrate an inflammatory process in the lung characterized by non-caseating granulomas and/or mononuclear cell infiltrates in lung tissue (Newman et al. Citation1989). A substantial body of literature has demonstrated differences in pro-inflammatory cytokine levels such as interferon (IFN)-γ, interleukin (IL)-2, (IL)-6 and tumor necrosis factor (TNF)-α (Bost et al. Citation1994; Tinkle et al. Citation1997, Citation1999; Kelleher et al. Citation2001) between patients with BeS and CBD when either white blood cells or lung lavage cells, especially CD4+ T-lymphocytes and macrophages, are incubated ex vivo the presence of Be salts. However, we have only a limited understanding of the underlying mechanisms by which Be may affect the expression of these pro-inflammatory cytokines.
Two lines of evidence have led us to investigate the hypothesis that variations in DNA promoter region methylation may explain variations in gene expression and that Be, a metal cation, may be able to alter DNA methylation states. First, although there have been no published studies in CBD to date, preliminary data from a recent abstract suggests differential methylation between patients with BeS and CBD in bronchoalveolar lavage (BAL)-derived cell populations. In these cells, lower levels of methylation (hypo-methylation) were observed in TNFα promoters of patients with CBD when compared to methylation levels of BAL-derived cells from patients with BeS (Silveira et al. Citation2013). Further, Maeda et al. (Citation2009) demonstrated gene-associated hypo-methylation in patients with sarcoidosis, a granulomatous disorder immuno-pathogenically similar to CBD. Liu et al. showed that epigenetics might play a role in immune-mediated pulmonary diseases (He et al. Citation2013). Second, an emerging body of literature demonstrates that certain metal cations, i.e. nickel, lead, chromium, arsenic and cadmium, can induce epigenetic alterations, although Be has not yet been studied (Lee et al. Citation1995; Baggerly et al. Citation2004; Baccarelli and Bollati Citation2009; Hanna et al. Citation2012).
To investigate the hypothesis that Be can affect gene expression by modulating promoter methylation, our group utilized three related macrophage mouse tumor cell lines, H36.12J, H36.12E and P388D.1, that are known to differentially express TNFα when challenged with Be (Hamada et al. Citation2000; Sawyer et al. Citation2000b). In previous studies, P388D.1 (parental cell line) and H36.12E (daughter line) both failed to express high levels of TNFα when challenged with beryllium sulfate (BeSO4), cobalt sulfate (CoSO4) or aluminum sulfate (Al2[SO4]3). However, H36.12J, a daughter cell line derived from P388D.1, expressed high levels of TNFα when challenged with BeSO4, but not Al2(SO4)3 nor CoSO4 (Sawyer et al. Citation2000b).
In the studies reported here, these three cell lines were exposed to either Be, other multivalent metal salts as metal controls, PBS as a volume control and a no-addition as an additional negative control to confirm differential TNFα expression and a lack of IFNγ expression. DNA from challenged cells was then isolated, subjected to sodium bisulfite treatment and evaluated using pyrosequencing to assess specific CpG methylation in both the IFNγ and TNFα promoter regions.
Materials and methods
Cell culture and challenge
Three mouse macrophage tumor cell lines, H36.12J, H36.12E and P388D.1 which have been shown to be differentially responsive to Be (Sawyer et al. Citation2000a, Citationb), were obtained from the American Type Culture Collection (ATCC, Manassas, VA) and cultured at 37 °C under 5% CO2 in HyClone DMEM (Thermo Fisher, Pittsburgh, PA) with the addition of 10% fetal bovine sera (Sigma, St. Louis, MO), 100 U penicillin/ml, 100 μg streptomycin/ml, 100 mM HEPES and 10 mM sodium pyruvate (all Thermo Fisher, Pittsburgh, PA).
For challenges, cells were removed from culture flasks and centrifuged (400 × g, 5 min) to pellet cells. Supernatants were decanted and cells suspended at 106 cells/ml media and transferred to 24-well plates (Corning Inc. Corning, NY) at 106 cells/well and cells were allowed to recover for 2 h at 37 °C, under 5% CO2. Cells were then challenged with 100 μM BeSO4, 100 μM CoCl2, 100 μM Ni(II)Cl2, 100 μM Al2(SO4)3, 100 μl phosphate-buffered saline (PBS, pH 7.4) or non-addition control (NC) and then incubated at 37 °C under 5% CO2 for 18 h. In separate experiments, it was confirmed by trypan blue exclusion studies that none of the metal salts used in these experiments induced cell death (data not shown). Following challenges, there were mixtures of suspension and adherent cells in culture wells. Well supernatants were transferred to 15-ml tubes and centrifuged (400×g, 5 min) to pellet suspension cells. Supernatants were removed to 96-well plates and stored at −80 °C until utilized for ELISA.
Adherent cells were removed from treatment wells by first washing wells twice with 2 ml PBS pH 7.4 to remove trace amounts of FBS and residual growth media. These and subsequent washes were added to corresponding 15-ml tubes holding the suspension cell pellets. Treatment wells were then incubated with 500 μl of 0.025% trypsin (Thermo Fisher) for 3 min at 37 °C. Trypsin was quenched by the addition of 2 ml growth media and cells dislodged from wells by scraping and repeated pipetting. Previously adherent cells were transferred to 15-ml tubes holding corresponding suspension cells and wells washed twice with 2 ml PBS pH 7.4. Tubes containing suspension and adherent cells were centrifuged (400×g, 5 min) to pellet cells. Supernatants were decanted and the cell pellets immediately subjected to DNA isolation (see below).
ELISA
Cell culture supernatants were analyzed for the presence of both TNFα and IFNγ according to a standard eBioscience (San Diego, CA) ELISA protocol. Briefly, capture antibody was diluted in eBioscience Coating Buffer and 100 μl added to each well of Costar 96-well high binding EIA/RIA plates (Corning). Wells were then sealed with Nunc Aluminum sealing tape (Nalge Nunc, Rochester, NY) and incubated overnight at 4 °C. Following incubation, capture antibody solutions were decanted and wells washed 5 × with 250 μl PBS-0.5% Tween 20 solution (PBST). Wells were then blocked for 60 min at room temperature, with shaking on a MicroMix 5 system (Siemens, Washington, DC) at settings of Form: 20 and Amplitude: 7, with the addition of 100 μl of the assay diluent to limit non-specific binding. Blocking solution was then removed and plates washed 5× as described above.
Culture supernatants were diluted 1:1 in assay diluent and 100 μl added to wells of ELISA plates. Standards were serially diluted as per manufacturer instructions and 100 μl also added to ELISA plates. Plates containing samples/standards were incubated for 2 h at room temperature with shaking on the MicroMix 5 as above. Following incubation, well contents were discarded and wells washed 5× as above. Secondary biotin-labeled detection antibodies were diluted in assay diluent as per manufacturer instructions and 100 μl added to each well; plates were then incubated for 60 min at room temperature with gentle shaking. Supernatants containing unbound detection antibodies were then discarded and wells washed 5 × as above. Avidin-horseradish peroxidase (HRP) solution was diluted to manufacturer specifications and 100 μl added to each well for a 30 min incubation at room temperature, with gentle shaking. Avidin-HRP was removed and wells washed 7× as above. To each well, 100 μl substrate solution (TMB; 3,3′,5,5′-tetramethylbenzidine) was added and plates incubated at room temperature in the dark for up to 15 min. Substrate color changes were halted by addition of 100 μl 2M H2SO4. Absorbances at 450 and 570 nm were then determined on a Powerwave HT plate reader (BioTek, Winooski, VT). OD values at 570 nm were subtracted from the OD at 450 nm to obtain a normalized OD 450 nm and sample cytokine concentrations were determined by extrapolation from the standard curves generated in parallel.
DNA isolation and bisulfate conversion
Cell culture pellets were moved to 1.5 ml Eppendorf tubes, washed in 500 μl PBS pH 7.4 and centrifuged for 10 s at 14 000×g. Resulting supernatants were aspirated, leaving ∼50 μl supernatant atop each cell pellet. Pellets were suspended and DNA isolated utilizing a Wizard Genomic DNA purification kit (Promega, Madison, WI). DNA quantity and quality were determined by absorbance at 260 and 280 nm on the Powerwave HT plate reader. DNA was stored under ethanol (2.5 vol of 100% ethanol and 1/10 vol 3 M sodium acetate) at −80 °C until utilized.
DNA bisulfite conversion was performed using an EpiTect Bisulfite Kit (Qiagen, Hiden, Germany) as per manufacturer protocols. Briefly, up to 2 μg DNA was subjected to the bisulfite conversion and converted DNA finally suspended at 10 ng/μl and aliquoted into individual tubes at 100 ng/tube. Aliquoting was performed to avoid freeze/thaw cycles that the manufacturer states may interfere with downstream bisulfite sequencing. Aliquoted bisulfite converted DNA was stored at −20 °C until utilized.
Pyrosequencing
In duplicate, bisulfite-converted DNA was amplified utilizing PyroMark PCR kits (Qiagen) following manufacturer protocols with some minor modifications. Five primer sets for amplification and six corresponding sequencing primers were designed utilizing PyroMark Assay Design 2.0 Software (Qiagen), to investigate CpG methylation in both IFNγ and TNFα promoter regions (). Amplicon generation, evaluated by agarose gel electrophoresis and DNA Sanger sequencing (data not shown), was performed using the following reaction mixture: 10 μl of 2× Master Mix, 2 μl of 5× Q Solution, 1.6 μl of a mixed Forward/Reverse primer set (3 μM biotinylated primer and 5 μM non-biotinylated primer) (), 10 ng of bisulfite converted DNA and H2O to 20 μl. Amplification with primers TNF1-3 F/R had all the constituents above, but used 20 ng converted DNA and had an additional 3.75 mM MgCl2 in each reaction. Amplifications were preformed using the conditions: 95 °C, 15 min (94 °C, 1 min; Tm (), 1 min; 72 °C, 1 min)40; 72 °C, 10 min. Amplifications were held at 22 °C until subjected to pyrosequencing.
Table 1. Amplification and pyrosequencing primer sets.
Pyrosequencing was performed on the amplicons using a Pryomark Q96 according to manufacturer protocols (Qiagen) and involved four steps: sequencing primer () hybridization, dNTP addition, ATP sulfurylase addition for conversion of pyrophosphate (PPi) to ATP and addition of apyrase to degrade non-incorporated nucleotides. These steps were repeated until the program reached the end of the sequence to analyze. Incorporation of dNTP and PPi release revealed the percentage of cytosine methylation at the specific sites investigated in the amplicon, namely the CpG sites.
Statistical analysis
All statistical analysis was preformed utilizing a Student’s t-test with Bonferroni corrections for multiple comparisons.
Results
ELISA
TNFα and IFNγ ELISA were performed on the cell culture supernatants of cells exposed to Be or control solutions to confirm that H36.12J, H36.12E and P388D.1 cells differentially-expressed cytokines. Further, this study sought to confirm this TNFα production was Be-specific within the H36.12J Be-responsive cells, as previous studies have shown (Sawyer et al. Citation2000b).
None of the conditions tested induced any of the three cell lines to produce IFNγ. However, when H36.12J (Be-responsive) cells were treated with 100 μM BeSO4, they expressed significantly more TNFα (446.93 [± 110.98] pg/ml) than when treated with either Al2(SO4)3, Ni(II)Cl2, PBS or NC (p < 0.008) (). When Be-responsive cells were treated with 100 μM cobalt chloride, they produced levels of TNFα that were not significantly different from the amount of TNFα produced with 100 μM BeSO4 treatment (p < 0.068). Further, when comparing levels of TNFα produced by the three lines challenged with 100 μM BeSO4, the H36.12J cells (Be-responsive) produced significantly more TNFα than H36.12E cells (Be-non-responsive) or P388D.1 (parental) cells (p < 0.003, p < 0.034), confirming previous study results using these lines (Sawyer et al. Citation2000b).
Figure 1. TNFα expression (mean ± standard deviation) of cells treated with 100 μM BeSO4, 100 μM CoCl2, 100 μM Ni(II)Cl2, 100 μM Al2(SO4)3, 100 μl phosphate-buffered saline (PBS, pH 7.4) or non-addition control (NC); n = 3 experiments. H36.12J cells treated with Be expressed 446.90 [± 110.98] pg TNFα/ml, significantly more than produced by H36.12J cells treated with either Al2(SO4)3 239.78 [± 10.85] pg TNFα/ml, Ni(II)Cl2 170.38 [± 19.12] pg TNFα/ml, PBS 122.41 [± 23.23] pg TNFα/ml or NC 152.95 [± 22.01] pg TNFα/ml (p < 0.01). This amount of TNFα was also significantly greater than amounts made by either the H36.12E or P388D.1 cells (p < 0.03) treated with Be.
![Figure 1. TNFα expression (mean ± standard deviation) of cells treated with 100 μM BeSO4, 100 μM CoCl2, 100 μM Ni(II)Cl2, 100 μM Al2(SO4)3, 100 μl phosphate-buffered saline (PBS, pH 7.4) or non-addition control (NC); n = 3 experiments. H36.12J cells treated with Be expressed 446.90 [± 110.98] pg TNFα/ml, significantly more than produced by H36.12J cells treated with either Al2(SO4)3 239.78 [± 10.85] pg TNFα/ml, Ni(II)Cl2 170.38 [± 19.12] pg TNFα/ml, PBS 122.41 [± 23.23] pg TNFα/ml or NC 152.95 [± 22.01] pg TNFα/ml (p < 0.01). This amount of TNFα was also significantly greater than amounts made by either the H36.12E or P388D.1 cells (p < 0.03) treated with Be.](/cms/asset/5eda1f89-0c8c-467a-8fdb-9dc0655c5fbd/iimt_a_1115447_f0001_c.jpg)
Pyrosequencing
By performing pyrosequencing on the sodium bisulfite converted DNA of treated cells, percentage methylation was determined for 12 CpG sites within the promoter regions for TNFα (six CpG sites at positions: 35 337 466, 35 337 464, 35 337 458, 35 337 443, 35 337 403 and 35 337 274 of NCBI Accessions Number NC_8000083.5) and IFNγ (six CpG sites at positions: 117 883 310, 117 883 029, 117 883 285, 117 883 283, 117 883 274 and 117 883 231 of NCBI Accessions Number NC_000076.5), with notably different results (). The percentage methylation of the six CpG sites assayed in the TNFα promoter region varied from 0.29–29.17% across cell lines and treatment ( and ). In contrast, percentage methylation of the six CpG sites assayed in the IFNγ promoter region varied from 83.17–98.67% across cell lines and treatment ( and ).
Figure 2. Representative CpG methylation for TNFα (a) and IFNγ (b) (mean ± standard deviation) of cells treated with 100 μM BeSO4, 100 μM CoCl2, 100 μM Ni(II)Cl2, 100 μM Al2(SO4)3, 100 μl phosphate-buffered saline (PBS, pH 7.4) or a non-addition control (NC); n = 3 experiments. (a) Percentage methylation of TNF1-1 CpG by treatment for each of the three cell types is representative of CpG methylation seen at this site within TNFα promoter region. (b) Percentage methylation observed for the three cell types (by treatment) for the IFN1-1 CpG site is representative of methylation levels observed in the IFNγ promoter region.
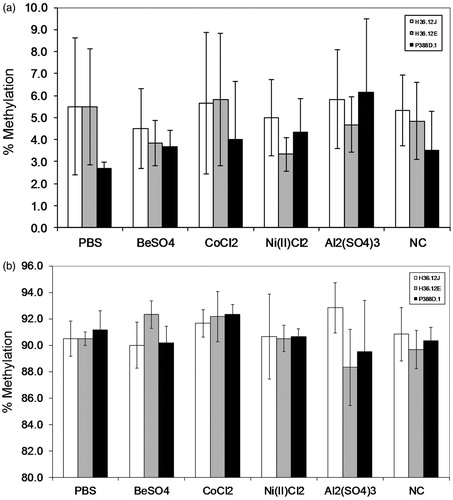
Table 2. Percentage CpG methylation.
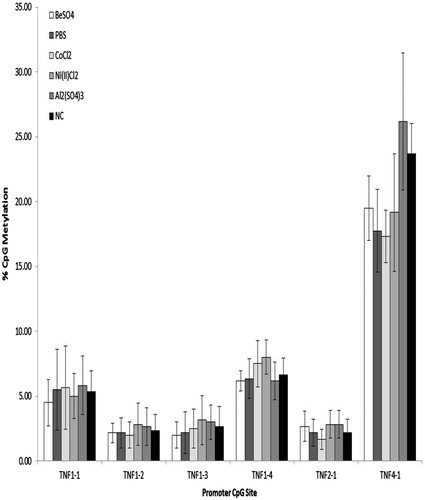
To investigate treatment differences in levels of TNFα CpG promoter methylation in the Be-responsive cell line, H36.12J, methylation levels in Be-treated cells were compared to methylation levels in aluminum-treated, cobalt-treated, nickel-treated, PBS-treated or NC-cells (). There was no significant difference in methylation levels across treatment in the H36.12J at the six TNFα promoter CpG sites investigated.
Figure 3. H36.12J percentage TNFα promoter CpG methylation (mean ± standard deviation) of cells treated with 100 μM BeSO4, 100 μM CoCl2, 100 μM Ni(II)Cl2, 100 μM Al2(SO4)3, 100 μl phosphate-buffered saline (PBS, pH 7.4) or a non-addition control (NC); n = 3 experiments. Percentage methylation observed with each treatment at each of the six TNFα promoter CpG sites investigated showed no significant difference between treatments.
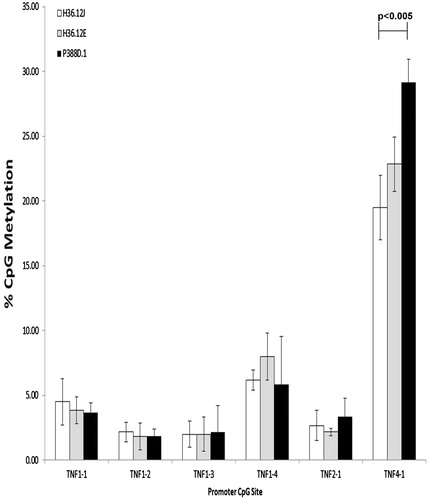
These sites were further investigated for possible methylation differences across the three cell types treated with Be. Although TNFα production varied across the three cell types with Be treatment (H36.12J: 446.93 [± 110.98], H36.12E: 35.37 [± 6.20] and P388D.1: 242.83 [± 9.50] ng/ml) comparing CpG percentage methylation levels between Be-responsive cells vs parental cells or Be-responsive cells vs Be-non-responsive cells at the six TNFα promoter CpG investigated, revealed no significant variation, after Bonferroni correction, which required a p < 0.004 for significance (see ). However, between the Be-responsive cells and the parental cells, the level of TNFα promoter CpG methylation at site TNF4-1 approached significance (p < 0.005).
Figure 4. Percentage TNFα promoter CpG methylation (mean ± standard deviation) of cells treated with 100 μM BeSO4, 100 μM CoCl2, 100 μM Ni(II)Cl2, 100 μM Al2(SO4)3, 100 μl phosphate-buffered saline (PBS, pH 7.4) or a non-addition control (NC); n = 3 experiments. Comparing the levels of CpG promoter methylation between the three mouse cell lines cultured with 100 μM BeSO4 overnight revealed significantly less (p < 0.005) methylation at CpG site TNF 4-1 in H36.12J cells when compared to in P388D.1 cells, the parental cell line.
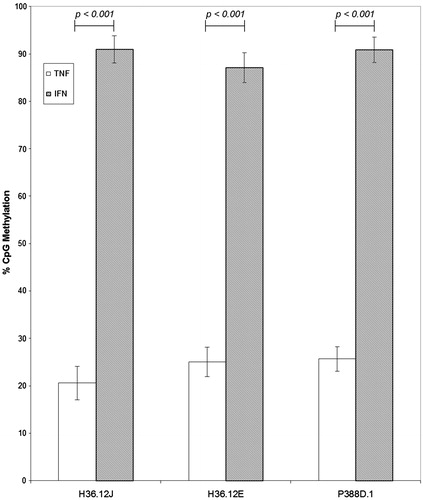
Finally, overall promoter methylation levels at the two genes of interest, TNFα and IFNγ, was investigated. Within each of the three cell lines, means and standard deviations of percentage methylation, regardless of treatment, were calculated using the 12 CpG (six in TNFα and six in IFNγ) methylation percentages determined in this study. As shown in , in each of the three cell lines, overall promoter percentage CpG methylation was significantly higher in the IFNγ promoter than in the TNFα promoter (H36.12J: p < 0.001, H36.12E: p < 0.001 and P388D.1: p < 0.001).
Figure 5. Comparisons of TNFα and IFNγ CpG percentage methylation (mean ± standard deviation) of cells treated with 100 μM BeSO4, 100 μM CoCl2, 100 μM Ni(II)Cl2, 100 μM Al2(SO4)3, 100 μl phosphate-buffered saline (PBS, pH 7.4) or non-addition control (NC); n = 3 experiments. Comparison of overall percentage CpG methylation for each promoter region separated by cell type, regardless of cell treatment, shows percentage CpG methylation of the TNFα promoter was much lower than that of the IFNγ promoter within each cell type.
Discussion
The goals of this set of experiments were two-fold. First, to determine if beryllium (Be) could modulate gene expression in an epigenetic fashion by altering promoter CpG DNA methylation in a gene-specific fashion and, second, to determine if differences in CpG promoter methylation may contribute to controlling gene expression in a model system with beryllium stimulation. Here, we utilized a mouse macrophage tumor cell line known to express TNFα but not IFNγ in response to Be-stimulation (H36.12J). As controls we utilized a sister mouse macrophage tumor cell line that does not respond to Be stimulation (H36.12E) and the parental mouse macrophage tumor cell line (P388D.1) that also fails to respond to Be stimulation. This study determined there was an overall state of hypo-methylation present at all investigated CpG in the TNFα promoter and an overall state of hyper-methylation present at all investigated CpG in the IFNγ promoter for all three cell lines. Furthermore, the study establishes that Be, unlike a number of other metal cations, had no impact on the promoter methylation status at the 12 CpG sites investigated in these three cell lines, despite an ability to induce pro-inflammatory cytokine expression. Although we observed no detrimental effects to culturing the cells in the presence of these metal salts, we did not exhaustively investigate metal toxicity, but did observe metal salts failed to induce cell death by trypan blue exclusion testing (data not shown).
Be-responsive H36.12J cells treated with Be did express high levels of TNFα and this cell line was shown to have a TNFα promoter CpG sites with methylation levels from 2.17–17.75% (). This correlates well with human data from a genome wide methylation study (Silveira et al. Citation2013) that showed less DNA methylation in the TNFα promoter of BAL cells from CBD patients than BAL cells from BeS patients. However when treated with Be, the TNFα promoter CpG sites in both the Be-non-responsive H36.12E cell line and the parental P388D.1 cell line also revealed very low states of methylation (0.29–22.83% and 0.58–29.17%, respectively). Also, unlike other metal cations such as Cr, As, Ni, Pb or Cd (Lee et al. Citation1995; Chanda et al. Citation2006; Jiang et al. Citation2008; Rozhon et al. Citation2008; Verstraeten et al. Citation2008) that have been shown in other systems to change CpG methylation states in other genes, this hypo-methylation was not a phenomenon of Be treatment. The state of hypo-methylation was observed at all TNFα promoter CpG, regardless of treatment ().
These studies, thus far, investigated the levels of CpG methylation between three cell lines that differentially expressed TNFα, when challenged with Be. To determine if this promoter CpG hypo-methylation was specific only to expressed genes, as expected in an epigenetically controlled gene (Bird Citation1986; Meehan et al. Citation1992) or an overall genome-wide phenomenon in these cell lines, pyrosequencing was performed on several CpG in the IFNγ promoter, a gene whose expression was not inducible with treatments investigated in these studies. It was expected that this set of promoter CpG should be highly methylated.
Of the six IFNγ promoter CpG methylation sites tested, all had levels of methylation that were at least 4-times higher, in most cases 16–20-times higher, than the six TNFα promoter CpG methylation sites examined in these studies. When we compared the overall promoter methylation states within each of the cell lines, we obtained highly significant differences (p < 0.001; see ) in the levels of CpG methylation between the expressed (TNFα) and non-expressed cytokine (IFNγ) in each of the three cell lines.
In this set of experiments we attempted to determine if there was epigenetic control of gene expression at the level of DNA promoter CpG methylation. These observations, that the TNFα promoter is in a state of hypo-methylation corresponding to gene expression (Bird Citation1986; Antequera Citation2003) and the IFNγ promoter is in a state of hyper-methylation corresponding to gene silencing (Meehan et al. Citation1992), correlates well with the majority of the epigenetic literature (Alam et al. Citation2010; Huang et al. Citation2011; Hanna et al. Citation2012; Lou et al. Citation2013; Niedzwiecki et al. Citation2013; Sanders et al. Citation2014). Although, in the six TNFα promoter CpG investigated in these three mouse macrophage tumor cell lines, these studies suggest that CpG methylation does not correlate with pro-inflammatory gene expression in response to Be. It is possible that Be may interact with other CpG located within the promoter regions of either the TNFα gene (21 CpG total). It is also possible that there are alternative mechanisms, beyond the purview of this study, which may control pro-inflammatory gene expression in this cell system. Future research may be warranted to examine these other epigenetic mechanisms – such as microRNA modulation or histone modifications – which have been implicated in the response to cations such as nickel, cobalt, lead and chromium (Chen et al. Citation2006; Li et al. Citation2009; Bollati et al. Citation2010; He et al. Citation2013).
Acknowledgements
The authors would like to thank Dr Ivana Yang and Miss Corinne Hennessy for their help in the design of pyrosequencing primers and Dr Ivana Yang and Dr David Schwartz for allowing us to utilize their pyrosequencing machine and laboratory space.
Declaration of interest
The authors report no conflicts of interest. The authors alone are responsible for the content and writing of the paper.
References
- Alam MP, Datta S, Majumdar S, Mehta AK, Baskaran S, Gulati N, Brahmachari V. 2010. Comparative analysis of DNA methylation in transgenic mice with unstable CGG repeats from FMR1 gene. Epigenetics 5:241–248.
- Antequera F. 2003. Structure, function and evolution of CpG island promoters. Cell Mol Life Sci 60:1647–1658.
- Baccarelli A, Bollati V. 2009. Epigenetics and environmental chemicals. Curr Opin Pediatr 21:243–251.
- Baggerly KA, Morris JS, Coombes KR. 2004. Reproducibility of SELDI-TOF protein patterns in serum: comparing datasets from different experiments. Bioinformatics 20:777–785.
- Bird AP. 1986. CpG-rich islands and the function of DNA methylation. Nature 321:209–213.
- Bollati V, Marinelli B, Apostoli P, Bonzini M, Nordio F, Hoxha M, Pegoraro V, Motta V, Tarantini L, Cantone L, et al. 2010. Exposure to metal-rich particulate matter modifies the expression of candidate microRNAs in peripheral blood leukocytes. Environ Health Perspect 118:763–768.
- Bost TW, Riches DW, Schumacher B, Carre PC, Khan TZ, Martinez JA, Newman LS. 1994. Alveolar macrophages from patients with beryllium disease and sarcoidosis express increased levels of mRNA for TNFα and IL-6 but not IL-1β. Am J Respir Cell Mol Biol 10:506–513.
- Chanda S, Dasgupta UB, Guhamazumder D, Gupta M, Chaudhuri U, Lahiri S, Das S, Ghosh N, Chatterjee D. 2006. DNA hyper-methylation of promoter of gene p53 and p16 in arsenic-exposed people with and without malignancy. Toxicol Sci 89:431–437.
- Chen H, Ke Q, Kluz T, Yan Y, Costa M. 2006. Nickel ions increase histone H3 lysine-9 di-methylation and induce transgene silencing. Mol Cell Biol 26:3728–3737.
- Hamada H, Sawyer RT, Kittle LA, Newman LS. 2000. Beryllium-stimulation does not activate transcription factors in a mouse hybrid macrophage cell line. Toxicology 143:249–261.
- Hanna CW, Bloom MS, Robinson WP, Kim D, Parsons PJ, vom Saal FS, Taylor JA, Steuerwald AJ, Fujimoto VY. 2012. DNA methylation changes in whole blood is associated with exposure to the environmental contaminants, mercury, lead, cadmium and bisphenol A, in women undergoing ovarian stimulation for IVF. Human Reprod 27:1401–1410.
- He J, Qian X, Carpenter R, Xu Q, Wang L, Qi Y, Wang ZX, Liu LZ, Jiang BH. 2013. Repression of miR-143 mediates Cr (VI)-induced tumor angiogenesis via IGF-IR/IRS1/ERK/IL-8 pathway. Toxicol Sci 134:26–38.
- Huang YC, Hung WC, Chen WT, Yu HS, Chai CY. 2011. Effects of DNMT and MEK inhibitors on the expression of RECK, MMP-9, -2, uPA and VEGF in response to arsenite stimulation in human uroepithelial cells. Toxicol Lett 201:62–71.
- Infante PF, Newman LS. 2004. Beryllium exposure and chronic beryllium disease. Lancet 363:415–416.
- Jiang G, Xu L, Song S, Zhu C, Wu Q, Zhang L, Wu L. 2008. Effects of long-term low-dose cadmium exposure on genomic DNA methylation in human embryo lung fibroblast cells. Toxicology 244:49–55.
- Kelleher PC, Martyny JW, Mroz MM, Maier LA, Ruttenber AJ, Young DA, Newman LS. 2001. Beryllium particulate exposure and disease relations in a beryllium machining plant. J Occup Environ Med 43:238–249.
- Lee YW, Klein CB, Kargacin B, Salnikow K, Kitahara J, Dowjat K, Zhitkovich A, Christie NT, Costa M. 1995. Carcinogenic nickel silences gene expression by chromatin condensation and DNA methylation: A new model for epigenetic carcinogens. Mol Cell Biol 15:2547–2557.
- Li Q, Ke Q, Costa M. 2009. Alterations of histone modifications by cobalt compounds. Carcinogenesis 30:1243–1251.
- Lou J, Wang Y, Yao C, Jin L, Wang X, Xiao Y, Wu N, Song P, Song Y, Tan Y, et al. 2013. Role of DNA methylation in cell cycle arrest induced by Cr (VI) in two cell lines. PLoS One 8:e71031.
- Maeda T, Guan JZ, Higuchi Y, Oyama J, Makino N. 2009. Aging-related alterations of sub-telomeric methylation in sarcoidosis patients. J Gerontol 64:752–760.
- Maier LA, Martyny JW, Liang J, Rossman MD. 2008. Recent chronic beryllium disease in residents surrounding a beryllium facility. Am J Respir Crit Care Med 177:1012–1017.
- Meehan R, Lewis J, Cross S, Nan X, Jeppesen P, Bird A. 1992. Transcriptional represssion by methylation of CpG. J Cell Sci Suppl 16:9–14.
- Newman LS, Kreiss K. 1992. Non-occupational chronic beryllium disease masquerading as sarcoidosis: Identification by blood lymphocyte proliferative response to beryllium. Am Rev Respir Dis 145:1212–1214.
- Newman LS, Kreiss K, King TE, Seay S, Campbell PA. 1989. Pathologic and immunologic alterations in early stages of beryllium disease. Re-examination of disease definition and natural history. Am Rev Respir Dis 139:1479–1486.
- Newman LS, Mroz MM, Balkissoon R, Maier LA. 2005. Beryllium sensitization progresses to chronic beryllium disease: A longitudinal study of disease risk. Am J Respir. Crit. Care Med 171:54–60.
- Niedzwiecki MM, Hall MN, Liu X, Oka J, Harper KN, Slavkovich V, Ilievski V, Levy D, van Geen A, Mey JL, et al. 2013. A dose-response study of arsenic exposure and global methylation of peripheral blood mononuclear cell DNA in Bangladeshi adults. Environ Health Perspect 121:1306–1312.
- Rozhon W, Baubec T, Mayerhofer J, Mittelsten Scheid O, Jonak C. 2008. Rapid quantification of global DNA methylation by isocratic cation exchange high-performance liquid chromatography. Anal Biochem 375:354–360.
- Sanders AP, Smeester L, Rojas D, DeBussycher T, Wu MC, Wright FA, Zhou YH, Laine JE, Rager JE, Swamy GK, et al. 2014. Cadmium exposure and the epigenome: Exposure-associated patterns of DNA methylation in leukocytes from mother-baby pairs. Epigenetics 9:212–221.
- Sawyer RT, Fadok VA, Kittle LA, Maier LA, Newman LS. 2000a. Beryllium-stimulated apoptosis in macrophage cell lines. Toxicology 149:129–142.
- Sawyer RT, Kittle LA, Hamada H, Newman LS, Campbell PA. 2000b. Beryllium-stimulated production of TNFα by a mouse hybrid macrophage cell line. Toxicology 143:235–247.
- Silveira LJ, Yang IV, Li L, Mac Phail K, Hamzeh NY, Fingerlin T, Maier LA. 2013. Epigenetic alterations and the development of chronic beryllium disease. Philadelphia, PA: American Thoracic Society.
- Tinkle SS, Kittle LA, Newman LS. 1999. Partial IL-10 inhibition of the cell-mediated immune response in chronic beryllium disease. J Immunol 163:2747–2753.
- Tinkle SS, Kittle LA, Schumacher BA, Newman LS. 1997. Beryllium induces IL-2 and IFNγ in berylliosis. J Immunol 158:518–526.
- Verstraeten SV, Aimo L, Oteiza PI. 2008. Aluminium and lead: Molecular mechanisms of brain toxicity. Arch Toxicol 82:789–802