
Abstract
The neurodegeneration in intracerebroventricular (icv) colchicine injected (ICIR) rats is linked with neuroinflammation. Glutamate excitotoxicity through NMDA receptors is involved with the neuroinflammation in some animal models of Alzheimer Disease (AD), but it has not been explored in ICIR rats. The aim of this study was to investigate the role of NMDA receptors (by blocking it's activity with memantine) in colchicine-induced neuroinflammation and neurodegeneration and impacts on peripheral immune parameters in ICIR rats. Levels of inflammatory markers (IL-1β, TNFα, ROS, nitrite) in the hippocampus and serum, histopathology of the hippocampus and select peripheral immune parameters were measured 14 and 21-days after icv colchicine injection in rats. These parameters were also measured in rats that received daily per os administration of memantine (20 mg/kg) in both study durations. Neuroinflammation in the hippocampus of ICIR rats was associated with neurodegeneration (chromatolysis, plaque formation), along with changes in inflammatory markers in the serum and alterations in peripheral immune parameters (phagocytic activity of WBC and splenic PMN, cytotoxic activity/leukocyte adhesion inhibition by splenic MNC). Administration of memantine to ICIR rats resulted in mitigation of colchicine-induced inflammation in the hippocampus, inflammatory markers in the serum and neurodegeneration and also led to recovery of the measured immune endpoints; most of these effects were greater with the longer duration of study. Phagocytic activity of WBC and splenic PMN cells appeared to correlate with levels of the measured central inflammatory markers. It appears from the results that neuroinflammation might be linked with the NMDA receptor activity in ICIR rats and that this receptor is involved in the process of progressive neuroinflammation and neurodegeneration in the hippocampus of ICIR and potentially in immunomodulation in these same hosts.
Introduction
Animal models are considered valuable tools for studying the pathological mechanisms involved in the disease processes as well as for evaluating new therapeutic strategies for treatment of human diseases (Benedikz et al. Citation2009). Several animal models have been used to assess the mechanism of neurodegeneration in Alzheimer Disease (AD) (Eijkenboom et al. Citation2000; Kumar et al. Citation2007; Rai et al. Citation2013; Nazem et al. Citation2015). Neuroinflammation has been proposed by several investigators as one of the causing factors for neurodegeneration in different chemically-induced animal models of AD, e.g. streptozotocin (STZ), okadaic acid and colchicine when injected intracerebroventricularly (icv) (Nazem et al. Citation2015; Sil et al. Citation2015). Sil et al. (Citation2014) reported that neurodegeneration in icv colchicine-injected rats was dependent on cyclooxygenase (COX)-induced neuroinflammation, as naproxen (non-specific COX blocker) could inhibit this neuroinflammation/-degeneration. Colchicine can block axoplasmic flow, leading to the damage of hippocampal granule cells (Tilson et al. Citation1987; Nakayama & Sawada Citation2002), thereby initiating inflammation.
Neuroinflammation during the early phase of AD activates M-1 microglia (involved in neurodegeneration) as well as M-2 (related to neuroprotection) (Wang et al. Citation2015). However, during the course of the disease, microglia undergo a switch from neuroprotective (M-2 type) to a classically activated phenotype (M-1), resulting in over-production of a variety of neurotoxic factors, e.g. pro-inflammatory cytokines, as well as reactive oxygen and nitrogen species (Banati et al. Citation1993; Minghetti & Levi Citation1998; Wang et al. Citation2015) that are involved in neurodegeneration in AD, likely by inducing caspase-mediated apoptotic pathways (Siripin et al. Citation2011). In addition, these neurotoxic factors activate surrounding microglia/astrocytes and further increase the presence of neurotoxic factors that facilitate the death of neurons (including glutamatergic neurons), resulting in over-production of glutamate that may cause excitotoxicity-induced cell death (Rai et al. Citation2013). It has been reported that degenerating neurons in AD cause progressive neurodegeneration in the brain by glutamate excitotoxicity (Lipton Citation2006).
Attachment of glutamate to cell surface docking sites called N-methyl-d-aspartate (NMDA) receptors permits calcium ions (Ca2+) to enter the cell and this process is important for cell signaling, as well as learning and memory (Li & Tsien Citation2009). In AD, however, excess glutamate can be released from damaged neuronal cells and activated microglia, leading to chronic overexposure to calcium, which can in turn speed up cell damage (Manev et al. Citation1989). Neuroinflammation and glutamate excitotoxicity are linked to one another. Pro-inflammatory cytokines enhance NMDA-induced intracellular Ca2+ increase in a dose-dependent manner (Yoshiyama & Groat Citation2007) by increasing glutamate release from astrocytes (Malarkey & Parpura Citation2008), resulting in neuronal death.
The progressive neurodegeneration in ICIR (Sil et al. Citation2014) has been explained, in part, on the basis of increasing inflammation resulting from a higher level of inflammatory agents (ROS, nitrite, TNFα and IL1β) released from the degenerating neurons; however, the possibility of participation of other mechanisms of neurodegeneration during AD – such as Aβ neurotoxicity, insulin insensitivity, cholinergic insufficiency, glutamate toxicity, etc. (Blennow et al. Citation2006) remain to be investigated in this particular animal model. Nevertheless, higher levels of glutamate may evolve as a result of this inflammation and this is likely to activate NMDA receptors, resulting in glutamate excitotoxicity and neurodegeneration. Nakagawa et al. (Citation1987) noted increased levels of glutamate and its receptors after colchicine injection into the rat hippocampus. Although the participation of NMDA receptors in neurodegeneration is critical for understanding the mechanism of degeneration in ICIR, there is no information in the literature in this regard.
Memantine is an NMDA receptor antagonist that can uncompetitively block the binding of glutamate and so it has been used as a neuroprotective agent in AD patients (Danysz & Parsons Citation2003). A role for glutamate excitotoxicity in colchicine-induced neurodegeneration can be assessed by administering memantine to ICIR rats. Sil et al. (Citation2014) reported that colchicine-induced neuroinflammation was not only involved with the process of neurodegeneration, but it altered some peripheral immune parameters, probably by transmitting inflammatory signals to the periphery through the blood–brain barrier.
Analyses of changes in colchicine-induced peripheral immune parameters after blocking of NMDA receptors may further provide the status of inflammation in the brain. Accordingly, this study was designed to investigate the effects of memantine on colchicine-induced neuroinflammation induced neurodegeneration and associated changes in the peripheral immune parameters in ICIR rats.
Materials and methods
Animals
Charles-Foster rats (male, 200–250 g, 6–8-weeks-of-age) and Swiss mice (male, 20–30 g, 6–8-weeks-of-age; for use in passaging of Ehrlich ascites cells in one study outlined below) were obtained from local animal supplier (M/s Chakraborty Enterprise, Kolkata, India) for use in this study. All animals were housed individually in polypropylene cages in a facility maintained at 25 ± 1 °C with a 12-h light–dark cycle. All animals had ad libitum access to standard rodent chow food pellets and filtered water. The Department of Physiology, University of Calcutta Animal Ethics Committee approved all protocols used in these studies.
Experimental design
Experiment I
Rats were allocated into two groups (with sub-groups therein): Group I (14-day study) or Group II (21-day study). In each case the sub-groups were: control rat; sham-operated rats (receiving only intra-cerebroventricular [icv] injection of artificial CSF [generated according to protocols outlined in Kumar et al. (Citation2007)]); and AD rats (receiving only icv colchicine). On Day 14/Day 21 after the icv injection of colchicine or artificial CSF, all rats (including controls) were euthanized by ether asphyxiation and the spleens of subsets of three rats within each group (i.e. with nine rats/group, this yielded three sets of observations) were pooled to provide the requisite number of spleen cells to measure leukocyte adhesive inhibition indices (LAI) or phagocytosis by polymorphonuclear (PMN) cells or cytotoxic activity of mononuclear cells (MNC). The ex vivo phagocytic activity of white blood cells (WBC), levels of TNFα, IL 1β, ROS and nitrite (as a marker for NO) in the serum were also assessed. At necropsy, samples from the hippocampus were also collected and either processed for histologic analyses of plaques and Nissl granules (i.e. fixation, dehydration and paraffin block preparation, section cutting and staining) or for assessing ROS, nitrite, TNFα and IL-1β levels.
Experiment II
Rats were divided into two groups (with sub-groups therein): Group I (14-day study) or Group II (21-day study). In each case the sub-groups were: control rat + daily per os memantine (20 mg/kg BS); sham (icv artificial CSF) + daily per os 20 mg memantine/kg; and AD (icv colchicine) + daily per os 20 mg memantine/kg). The various parameters as noted in Experiment I were also measured here, following the same experimental design in all the groups of rats.
Intra-cerebroventricular injection of colchicine in rats
Colchicine (7.5 μg in 2.5 μl of artificial CSF) was injected into the lateral ventricle of each side of the rat brain using stereotaxic coordinates: AP = −0.6 mm from bregma, L. ± 1.5 mm from midline and V = 2.8 mm from the skull surface (Paxinos & Watson Citation1986). Rats were anesthetized with Na-thiopentone (50 mg/kg BW) and the head of the rat was fixed on the stereotaxic apparatus (ST141, INCO Ambala, Delhi, India) with the help of ear bars, incisor bar and nose clip. The skin covering the skull was opened by midline incision and the periostium over the skull surface was retracted. Burr holes were made on the two points over the skull surface (right and left side) according to the AP and L coordinates, with a dental drill. A steel microcannula (0.45 mm diameter) connected to a 10 μl Hamilton syringe (Hamilton, Australia) with polyethylene tubing was inserted into the lateral ventricle using the V coordinate. The cannula was left in place for 2–3 min after the icv injection. Sham-operated rats received the same volume (2.5 μl) of artificial CSF in each lateral ventricle by the same procedure. The trephine hole was covered with sterile bone wax after withdrawal of injecting needle. The muscles and skin were then sutured separately. Lignocaine-HCl local anesthetic (Neon Laboratories, Mumbai, India) was applied on the cut end of skin/muscles to minimize pain during surgery. Neosporin powder was sprayed over the cut surface as an antiseptic measure.
Treatment with memantine
Memantine (Sun Pharma Laboratories Ltd., Mumbai, India) was dissolved in distilled water and administered per os at 20 mg/kg body weight (to each rat) through a gastric cannula attached to a 1-ml syringe. Memantine was administered per os daily to rats in the Experiment II study for 14 or 21 days, in each case starting 4 days prior to the icv colchicine (ICIR) or vehicle injection (for sham-operated rats). Control rats were also treated with memantine daily per os for the same time period.
Blood collection
Upon ether dosing, blood for use in the flow cytometric (FACS) analyses was collected (0.5 ml, between 11:00–11:30 AM) from the heart of each rat using syringes containing 100 μl Na-citrate (3.8%, Sigma, St. Louis, MO). Another 1.5 ml blood was also collected without any anti-coagulant and used for serum isolation.
Cytokine assay
TNFα levels were assayed in the hippocampus and serum using a Rat TNF Flex Set and a BD Cytometric Bead Array (CBA) Rat Soluble Protein Master Buffer kit (BD Biosciences, San Jose, CA) in BD Verse FACS instrument. FCAP Array software was used for the data analysis. Sample preparation was done according to the methods of Csolle and Sperlagh (Citation2010, Citation2011). In brief, isolated brain areas were homogenized separately in 500 μl of 10 mM Tris-HCl buffer containing 1 mM EGTA, 1 mM EDTA, 0.2 mM PMSF and 4 M urea – per 0.1 g tissue. The samples were then centrifuged (15000 × g, 4 °C, 20 min) and the resultant supernatant collected. A sample (25 μl) of this material was assessed for protein content using the method of Lowry et al. (Citation1951), with bovine serum albumin (BSA) as standard. An additional sample (400 μl) was then mixed with 500 μl of a solution containing 10 mM Tris-HCl buffer, 1% BSA and 0.2% Tween-20. An aliquot (50 μl) of this solution was then used to assay TNFα levels, according to manufacturer protocols. Cytokine levels were expressed as pg TNFα/100 mg protein in sample.
IL-1β levels in the hippocampus and serum were assayed using a commercial rat IL-1β ELISA kit (Ray Bio, Norcross, GA), according to manufacturer protocols. For the analyses, 100 μl of solutions prepared above were used to assay IL-1β levels. Here, sample content was based on measures of absorbance at 450 nm/well in an automated ELISA plate reader (Ray Bio). Cytokine levels were expressed as pg IL-1β/mg protein in sample.
ROS estimation
Reactive oxygen species (ROS) levels in the hippocampus and serum were estimated according to the method of Socci et al. (Citation1999). The hippocampus was homogenized in 500 μl ice-cold 40 mM Tris–HCl buffer (pH 7.4). The samples were then centrifuged at 15 000 x g (4 °C for 20 min) and each supernatant collected for ROS estimation (same solution was used for nitrite estimates). The brain homogenate (10 μl) and serum (10 μl) were each incubated with 5 μM DCF-DA (Loba Cheme) for 30 min at 37 °C waterbath. Thereafter, formation of fluorescent DCF product was measured in a FP 6200 spectrofluorometer (JASCO, Baltimore, MD) at excitation and emission wavelengths of 495 and 529 nm, respectively. ROS levels were expressed as a percentage of control levels.
Nitrite estimation
Nitrite (used as indicator of nitric oxide [NO] in samples) levels were estimated by the method of Green et al. (Citation1982). In brief, 10 μl of the supernatant from the hippocampal homogenate (as described for ROS estimation) or serum (10 μl) were mixed with an equal volume of Griess reagent [0.1% N-(1-naphthyl)-ethylenediamine-2HCl, 1% sulfanilamide, 2.5% phosphoric acid] and incubated at 37 °C for 10 min. Thereafter, the absorbance in the sample was assessed at 550 nm in a spectrophotometer (BioRad, Hercules, CA). Nitrite level in a sample was expressed as a percentage of control (set at 100% based on average OD550 values).
Peripheral immunologic endpoints
Leukocyte adhesive inhibition index (LAI)
At necropsy, as noted above, the spleens of three rats in a sub-group were placed together in phosphate-buffered saline (PBS, pH 7.4) containing 3.8% Na-citrate solution. Single cell suspensions of these spleens were then prepared using standard aseptic techniques. Thereafter, splenic leukocyte samples containing mononuclear cells (MNC) as well as polymorphonuclear (PMN) cells were isolated by Percoll density gradient (ρ = 1.092 g/ml) centrifugation. Smears of the isolated MNC suspension was made and stained with Leishman stain (Merck, New Delhi, India) so that the percentage MNC in each could be determined to verify of separation purity (routinely ≈ 98% purity).
To perform the LAI according to the methods of Maluish and Halliday (Citation1979), isolated MNC (108/ml, 10 μl) were placed in a Neubauer hemocytometer and incubated for 30 min at 37 °C in a humidified environment. After this period, the counted field was washed gently with PBS by Pasteur pipette and adhered cells were counted. The percentage of LAI was calculated as 100% × (number of adhered cell after incubation/total cell count before incubation).
Phagocytic activity of WBC
Using the method of Oben and Foreman (Citation1988), the fluorescein isothiocyanate (FITC) (Sigma)-tagged bacterial cell membranes were prepared. Aliquots (100 μl) of the collected blood samples were placed in each of four microcentrifuge tubes. Thereafter, 20 μl of FITC-tagged bacterial cell membrane and 380 μl RPMI 1640 medium (HiMedia, Mumbai, India) were added to each tube and these were then incubated for 0, 15, 60 or 90 min at 37 °C. After the respective incubation, each tube was dipped in ice for 15 min to stop the reaction. One milliliter of RBC lysing solution (BD Biosciences, Franklin Lakes, NJ) was then added and the tube left in the dark at room temperature (RT) for 5 min. The tube was then centrifuged (800 x g, 3 min) and the cells then washed with PBS. Mean fluorescence was then analyzed using a Becton Dickinson FACS Verse system (BD Biosciences) and associated Cell-Quest Software. A minimum of 10 000 events was acquired for each sample.
Mean fluorescence values for samples collected at the different time durations were calculated from FITC+ cell populations indicated in individual histograms. A regression line was then drawn based on mean fluorescence values of different time intervals (MINITAB statistical software) for each group of rats. The slope of the regression line was considered as the phagocytic index (PI) of WBC. For example, a negative slope of the regression line was an indicator of greater phagocytic activity, as time-dependent changes in mean fluorescence values indicated the equilibrium of the bidirectional component of phagocytosis by the WBC.
Polymorphonuclear (PMN) assay (Sil et al. Citation2014)
For use as target cells in this assay, mice bearing Ehrlich ascites carcinoma (EAC) cells were obtained from the Chittaranjan National Cancer Institute (Kolkata, India) and EAC cells were passaged weekly in the peritoneal cavities of Swiss albino mice using standard protocols (Justo et al. Citation2000; Lawal et al. Citation2013). At the time of the assays here, EAC cells were obtained by collecting peritoneal fluid from the EAC-bearing mice, washing the isolated cells in PBS, and then counting their numbers in a hemocytometer.
For the assay, polymorphonuclear (PMN) cells were isolated from the splenic single cell suspensions prepared above and then these effector cells, as well as the target EAC cells, were washed separately in 15 ml centrifuge tubes with PBS and the pellets of these two cell types were each re-suspended in phenol red free RPMI 1640 (HiMedia) medium. PMN (98% purity) and target cell counts were confirmed using a Neubauer hemocytometer. Effector and target cells were then combined at a 10:1 ratio in a 15 ml centrifuge tube, 200 μl of 1% nitroblue tetrazolium (NBT) solution (Sigma) was added and the tube volume made up to 3 ml with RPMI (Tube T). In another 15 ml tube (Tube B), only effector cells (same number as in Tube T) were added along with 200 μl 1% NBT and the tube volume made up to 3 ml with RPMI. The mixtures were then incubated at 37 °C for 18 h; 3 ml chilled 0.1 M HCl was then added to stop the reaction. The centrifuge tube was then held at RT for 5–10 min, centrifuged at 2000 x g for 30 min and the resultant supernatant discarded. Pyridine (Merck; 3 ml) was added to the tube and the mixture placed in a boiling water bath for 10 min. After being cooled to RT, the materials were then centrifuged at a 2000 x g for 10 min before the resulting blue supernatant was isolated and its absorbance measured at 480 nm.
Phagocytic activity of the PMN in the presence of EAC target cells was expressed by the percentage increase in reducing equivalents generated during phagocytosis – taking basal release of equivalents (measured by reduction of NBT) by the PMN in the absence of target cells. The percentage increase in phagocytic activity by the PMN was then calculated as: 100 × (T − B)/B, where each letter represents the OD480 value for the given parameter.
Cytotoxic activity assay
Cytotoxic activity of splenic MNC (effector cells collected from spleen by procedure described above) against target EAC cells was tested in a lactate dehydrogenase (LDH) release assay using an LDH-FS Non-Radioactive Cytotoxicity Assay kit (DiaSys Diagnostic Systems GmbH, Holzheim, Germany) and the method of Weidmann et al. (Citation1995). In brief, from each host, collected effector were washed with PBS and the pellets then suspended in 3 ml phenol red-free RPMI 1640 (HiMedia) and counted in a hemocytometer. Target cells were processed in parallel in a similar manner. For the assay, Effector (E) cells (10 μl from 108 cells/ml RPMI suspension) were placed into each of two tubes (Tubes 1 and 2). Target (T) cells (10 μl from 107 cells/ml suspension) were then placed into Tube 1 (E:T ratio = 10:1) and into each of another two micro-tubes (Tubes 3 and 4). To Tube 4, 100 μl of 1% Triton X-100 (Merck) was added to completely lyse the target cells. The volume of all four tubes was then brought to 500 μl with phenol-red free RPMI 1640. Tube 3 was used to assess spontaneous release/lysis of the target cells.
All four tubes were incubated for 3 h at 37 °C before each was centrifuged at 200 × g for 2 min. Each resulting supernatant was collected and the LDH that had been released it into was quantified per kit instructions, with absorbance values being measured at 340 nm. Tube 1 provided measures of LDC release from the E:T co-cultures (C). Spontaneous release of LDH from E and T cells was determined from Tubes 2 (E) and 3 (T) measures, respectively. Tube 4 yielded the total possible target cell LDH release (M). All tests were performed in triplicate. The amount of LDH released was calculated using the formula: % Cytotoxicity = 100 × [(C − E) – T]/(M − T), where each letter represents the OD340 value for the given parameter.
Histology
The brains were isolated from the anesthetized rats as per the study design and stored in 4% formaldehyde solution for fixation. These were then processed for paraffin section (dehydration, embedding, paraffin block, section cutting and staining for plaques and stained for plaques (Congo red) and Nissl granules (Cresyl violet).
Cresyl violet staining for Nissl granules
Paraffin sections of the brain were made and Nissl granules were stained with cresyl violet acetate (Sigma, Dusseldorf, Germany) (Cox Citation1977). In brief, the sections were de-paraffinized, dehydrated and then treated with water. The slides were then incubated in cresyl violet (1%) for 20–30 min. After rinsing with distilled water, the slide was treated with 96% alcohol and then absolute alcohol. The dehydrated section was then mounted with DPX and intensity of Nissl granules was measured using Image J Launcher software (v1.4.3.67; NIH, Bethesda, MD). The intensity of granules in the hippocampus of an animal on both sides was measured at the level of AP – 4.3 mm. A total of five microscopic fields on the unilateral hippocampus were calculated and, thereby, 10 fields were measured on both sides. The mean value of intensity of Nissl granules present/field of the unilateral hippocampus/animal was calculated from six rats/group.
Congo red staining
Plaques in the neurons of paraffin brain sections were stained with Congo red (Central Drug House, India) (Stevens & Bancroft Citation1977). In brief, brain sections were deparaffinized, dehydrated and then treated with water. The sections were then stained with Gill’s hematoxylin and rinsed in tap water for 2 min before being immersed in alkaline sodium chloride solution for 20 min. The slides were then incubated in Congo red working solution (1% Congo red stock solution) for 20 min. After rinsing the section with distilled water, the material was differentiated with alkaline alcohol and again rinsed in distilled water. The sections were then dehydrated, mounted with DPX and examined under a light microscope. The number of plaques in the hippocampus of an animal on both sides were counted at the level of AP – 4.3 mm. The mean value of plaques present in unilateral hippocampus per animal was calculated from the record of six rats and represented graphically. The squared dimensions of the sampled fields were 10 mm2 for each brain area.
Statistical analysis
Data are expressed as mean ± SEM. A one-way analysis of variance (ANOVA) was used to compare the data of each parameter among 12 groups in the study (six groups in each of the two study durations, i.e. control, sham-operated, ICIR, memantine treated control, memantine treated sham-operated and memantine treated ICIR), followed by a Tukey’s Multiple Comparison test. A Pearson correlation coefficient test followed by a 2-tailed significance test was also performed between outcomes for the hippocampal inflammatory markers and for the peripheral immune parameters. All analyses were performed using Statistical Package for Social Science Software (SPSS software: 20.0.0, Cary, NC).
Results
Histopathology of hippocampus
Nissl stain
There was a significant decrease (p < 0.001) in stain intensity of Nissl granules in the hippocampus of ICIR rats compared to in control and sham-operated rats (indicating chromatolysis) in both study durations. However, Nissl staining was significantly lower (p < 0.001) in the 21-day ICIR rats vs in the 14-day rats. After administration of memantine to ICIR rats, the Nissl granules in the hippocampus had a significantly higher intensity (p < 0.001) compared to in ICIR rats in both study durations and attained a control level (as there was no significant difference between control and ICIR + memantine groups). Recovery of intensity of Nissl granules in ICIR rats after administration of memantine was significantly greater (p < 0.05) in the 21-day rats vs in the 14-day rats. Nissl granule intensity was not significantly changed in memantine-treated control and sham-operated rats with or without memantine treatment ().
Figure 1. Nissl granules (cresyl violet staining) of hippocampal neurons in experimental rats. (A) Nissl staining of hippocampal neurons in rats. [A1] 14-day control; [A2] 21-day control; [B1] 14-day sham-operated; [B2] 21-day sham-operated; [C1] 14-day colchicine-injected; [C2] 21-day colchicine-injected; [D1] 14-day memantine-treated ICIR; [D2] 21-day memantine-treated ICIR. Magnification = 400×, Bar = 16.18 μm. Arrows indicate Nissl granules. (B) Intensity of Nissl granules in hippocampus: *Significant decrease in ICIR rats compared to in control and sham-operated rats in 14-day (p < 0.001) and 21-day (p < 0.001) study. #Significant decrease in intensity in ICIR rats in 21- vs 14-day study (p < 0.001). $Significant increase in intensity in memantine-treated ICIR rats in 14- (p < 0.001) and 21-day (p < 0.001) study compared to in timepoint counterpart ICIR rats. £Significant increase in intensity in memantine-treated ICIR rats at 21- vs at 14-days (p < 0.05). Ca, 14-day control rats; Cb, 21-day control; Sa, 14-day sham-operated rats; Sb, 21-day sham-operated; ICIRa, 14-day icv colchicine-injected rats; ICIRb, 21-day icv colchicine-injected rats. Arrows indicate Nissl granules. Values shown are means ± SEM (n = 6/group).
![Figure 1. Nissl granules (cresyl violet staining) of hippocampal neurons in experimental rats. (A) Nissl staining of hippocampal neurons in rats. [A1] 14-day control; [A2] 21-day control; [B1] 14-day sham-operated; [B2] 21-day sham-operated; [C1] 14-day colchicine-injected; [C2] 21-day colchicine-injected; [D1] 14-day memantine-treated ICIR; [D2] 21-day memantine-treated ICIR. Magnification = 400×, Bar = 16.18 μm. Arrows indicate Nissl granules. (B) Intensity of Nissl granules in hippocampus: *Significant decrease in ICIR rats compared to in control and sham-operated rats in 14-day (p < 0.001) and 21-day (p < 0.001) study. #Significant decrease in intensity in ICIR rats in 21- vs 14-day study (p < 0.001). $Significant increase in intensity in memantine-treated ICIR rats in 14- (p < 0.001) and 21-day (p < 0.001) study compared to in timepoint counterpart ICIR rats. £Significant increase in intensity in memantine-treated ICIR rats at 21- vs at 14-days (p < 0.05). Ca, 14-day control rats; Cb, 21-day control; Sa, 14-day sham-operated rats; Sb, 21-day sham-operated; ICIRa, 14-day icv colchicine-injected rats; ICIRb, 21-day icv colchicine-injected rats. Arrows indicate Nissl granules. Values shown are means ± SEM (n = 6/group).](/cms/asset/0d8b061c-2538-432e-976d-8b5aa423ede2/iimt_a_1130760_f0001_c.jpg)
Amyloid plaque stain
Plaques were present in the hippocampus of ICIR rats in both study durations. Numbers of plaques in the ICIR rats were significantly higher (p < 0.001) in the 21-day study compared to in the 14-day group. After administration of memantine, the number of plaques in ICIR rats was significantly (p < 0.001) reduced in both study durations. After dosing with memantine, the number of plaques in ICIR rats in the 21-day study was significantly decreased (p < 0.05) vs in rats in the 14-day study. No plaques were present in control and sham-operated rats with or without memantine treatment ().
Figure 2. Congo red staining of plaques in hippocampus of experimental rats. (A) Staining of plaques in different rats. [A1] 14-day and [A2] 21-day colchicine-injected. Memantine-treated ICIR in [B1] 14-day and [B2] 21-day study. Magnification = 400×, Bar = 16.18 μm. Arrows indicate plaques. (B) Number of plaques in hippocampus: Plaques were present in the hippocampus of ICIR rats. *Significant increase in number of plaques in ICIR rats in 21- vs 14-day study (p < 0.001). #Significant decrease in memantine-treated ICIR rats in 14- (p < 0.001) and 21-day (p < 0.001) study vs in timepoint counterpart ICIR rats. $Significant decrease in memantine-treated ICIR rats in 21- vs 14-day study (p < 0.05). Abbreviations are as in . Values shown are means ± SEM (n = 6/group).
![Figure 2. Congo red staining of plaques in hippocampus of experimental rats. (A) Staining of plaques in different rats. [A1] 14-day and [A2] 21-day colchicine-injected. Memantine-treated ICIR in [B1] 14-day and [B2] 21-day study. Magnification = 400×, Bar = 16.18 μm. Arrows indicate plaques. (B) Number of plaques in hippocampus: Plaques were present in the hippocampus of ICIR rats. *Significant increase in number of plaques in ICIR rats in 21- vs 14-day study (p < 0.001). #Significant decrease in memantine-treated ICIR rats in 14- (p < 0.001) and 21-day (p < 0.001) study vs in timepoint counterpart ICIR rats. $Significant decrease in memantine-treated ICIR rats in 21- vs 14-day study (p < 0.05). Abbreviations are as in Figure 1. Values shown are means ± SEM (n = 6/group).](/cms/asset/c9fa1e50-a872-493d-b9b6-e75d426f437a/iimt_a_1130760_f0002_c.jpg)
Inflammatory markers in the hippocampus (TNFα, IL 1β, ROS, nitrite)
In the ICIR rat, hippocampus levels of all four measured inflammatory markers (TNFα, IL-1β, ROS and nitrite) were increased significantly (TNFα, IL-1β, nitrite, p < 0.001 in both study durations: ROS, 14-day study, p < 0.01; 21-day study, p < 0.001) compared to in tissues of control or sham-operated rats. All marker levels in the hippocampus of ICIR rats in the 21-day study were significantly greater compared to levels in corresponding 14-day study rats. In either duration, after dosing with memantine, hippocampus levels of all four markers were significantly decreased (p < 0.001) in ICIR rats compared to in untreated ICIR rats. Recovery of hippocampus TNFα and IL-1β levels in ICIR rats after memantine was significantly (p < 0.05) greater in the 21-day vs in the 14-day study. Inflammatory marker levels in the hippocampus were not significantly affected in memantine-treated control/sham-operated rats in comparison to in tissues from control/sham-operated rats without memantine ( and , and ).
Figure 3. Effects of memantine on TNFα levels. (A) Hippocampus. *Significant increase in TNFα in ICIR rats compared to control and sham-operated rats in 14- (p < 0.001) and 21-day (p < 0.001) study. #Significant increase in ICIR rats in 21- vs 14-day study (p < 0.001). $Significant decrease in memantine-treated ICIR rats in 14- (p < 0.001) and 21-day (p < 0.001) study vs in timepoint counterpart ICIR rats. £Significant decrease in memantine-treated ICIR rats in 21- vs 14-day study (p < 0.05). €Significant decrease in memantine-treated ICIR rats in 21-day study (p < 0.001) vs in timepoint counterpart control/sham-operated rats. (B) Serum. *Significant increase in TNFα levels in ICIR rats compared to in control and sham-operated rats in 14- (p < 0.05) and 21-day (p < 0.001) study. #Significant decrease in memantine-treated ICIR rats in 14- (p < 0.001) and 21-day (p < 0.001) study vs timepoint counterpart ICIR rats. $Significant decrease in memantine-treated ICIR rats in 21- vs 14-day study (ep < 0.001). €Significant decrease in memantine-treated ICIR rats in 14- and 21-day (p < 0.001) study vs in timepoint counter-part control/sham-operated rats. Abbreviations are as in . Values are expressed in mean ± SEM (n = 6 in each group).
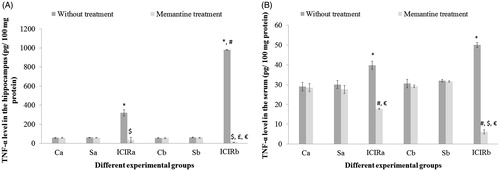
Figure 4. Effects of memantine on IL-1β levels. (A) Hippocampus. *Significant increase in IL-1β levels in ICIR rats compared to control and sham-operated rats in 14- (p < 0.001) and 21-day (p < 0.001) study. #Significant increase in ICIR rats in 21- vs 14-day study (p < 0.001). $Significant decrease in memantine-treated ICIR rats in 14-day (p < 0.001) and 21-day (p < 0.001) studies vs in timepoint counterpart ICIR rats. £Significant decrease in IL-1β in memantine-treated ICIR rats in 21-day vs 14-day study (p < 0.05). (B) Serum. No significant differences in IL-1β levels were noted among the experimental groups in either study duration. Abbreviations are as in . Values shown are means ± SEM (n = 6/group).
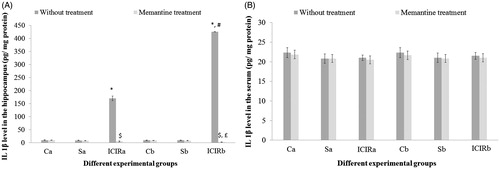
Table 1. Effects of memantine on hippocampal ROS levels of experimental rats.
Table 2. Effects of memantine on hippocampal nitrite levels in experimental rats.
Inflammatory markers in the serum
In the sera of ICIR rats, each of the measured inflammatory markers (TNFα, IL-1β, ROS and nitrite) was increased significantly (ROS, nitrite: p < 0.001 in both durations and TNFα: 14-day study, p < 0.05; 21-day study, p < 0.001) compared to in the sera of control or sham-operated rats. Serum nitrite levels were significantly higher (p < 0.001) in ICIR rats in the 21-day vs in the 14-day study. After treatment with memantine, serum TNFα, IL-1β, ROS and nitrite levels in ICIR rats were significantly decreased (p < 0.001) in both durations. Recovery of TNFα levels in the serum of ICIR rats after memantine treatment was significantly (p < 0.001) greater in the 21-day than in the 14-day regimen. In ICIR rats, serum IL-1β levels were not significantly changed compared to control and sham-operated rats in both study durations. Levels of inflammatory markers in the serum were not significantly impacted in memantine-treated control/sham-operated rats in comparison to in sera of control/sham-operated rats without memantine ( and , and ).
Peripheral immune parameters
The phagocytic index (PI) of WBC was significantly lower (p < 0.001) in ICIR rats in either study duration compared to that of WBC from control and sham-operated counterparts, indicating that phagocytic activity had increased. As mentioned in the Methods section, PI is based on time-dependent phagocytic activity of WBC; in cases of higher phagocytic activity, the slope of the regression line becomes negative.
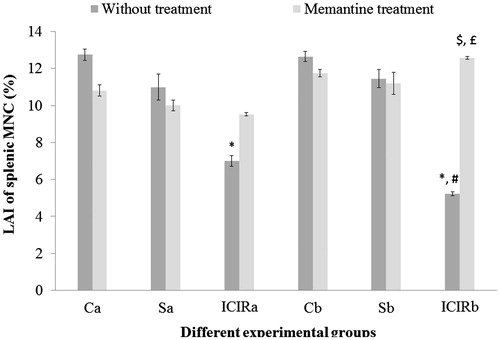
In both study durations, splenic PMN phagocytic activity and splenic MNC cytotoxic activity were significantly higher (p < 0.001) and the LAI of splenic MNC significantly lower (p < 0.001) by cells from ICIR rats compared to that by cells from control and sham-operated rats. The LAI of splenic MNC was significantly lower (p < 0.001) and the phagocytic activity of splenic PMN was significantly higher (p < 0.001) in cells from ICIR rats in the 21-day vs that by cells from 14-day study counterparts. After memantine treatment, the PI of WBC from ICIR rats was significantly increased (p < 0.001) compared to that by WBC from ICIR rats (no treatment) in both durations, indicating phagocytic activity had decreased. Similarly, in both durations, the phagocytic activity of memantine-treated ICIR rats’ splenic PMN was significantly decreased (p < 0.001) compared to that by cells from ICIR rats. However, after this dosing of memantine, the splenic MNC cytotoxic activity was significantly decreased and splenic MNC LAI significantly increased (p < 0.001) compared to that by cells from ICIR rats in the 21-day study. The recoveries of the WBC PI, splenic PMN phagocytic activity and cytotoxic activity and LAI of splenic MNC from the ICIR rats after administration of memantine were significantly (p < 0.05) greater in the 21-day study than in the 14-day study. Assessed peripheral immune parameters were not significantly affected by memantine treatment of control or sham-operated rats ().
Figure 5. Effects of memantine on WBC phagocytic index for experimental rats. *Significant decrease in index for cells from ICIR rats compared to for cells from control and sham-operated rats in 14- (p < 0.001) and 21-day (p < 0.001) study. #Significant increase for cells from memantine-treated ICIR rats in 14- (p < 0.001) and 21-day (p < 0.001) study vs for cells from timepoint counterpart ICIR rats. $Significant increase for cells from memantine-treated ICIR rats of 21- vs 14-day study (p < 0.05). €Significant increase for WBC in memantine-treated ICIR rats in 14- and 21-day (p < 0.001) study vs for cells from timepoint counterpart control/sham-operated rats. Abbreviations are as in . Values shown are means ± SEM (n = 6/group).
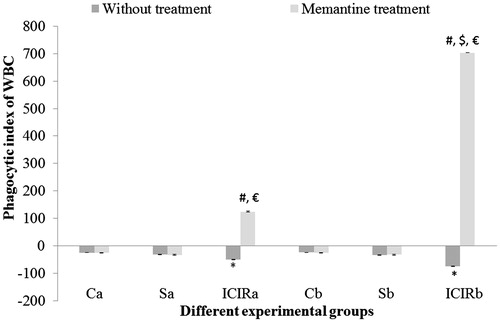
Figure 6. Effects of memantine on splenic PMN phagocytic activity for experimental rats. *Significant increase in activity for cells from ICIR rats compared to for cells from control and sham-operated rats in 14- (p < 0.001) and 21-day (p < 0.001) study. #Significant increase by cells from ICIR rats in 21- vs 14-day study (p < 0.001). $Significant decrease by cells from memantine-treated ICIR rats in 14- (p < 0.001) and 21-day (p < 0.001) study compared to by cells of timepoint counterpart ICIR rats. £Significant decrease in activity by cells from memantine-treated ICIR rats in 21- vs 14- day study (p < 0.05). Abbreviations are as in . Values shown are means ± SEM (n = 3/group).

Figure 7. Effects of memantine on splenic MNC cytotoxic activity. *Significant increase in activity for cells from ICIR rats compared to for cells from control and sham-operated rats in 14- (p < 0.001) and 21-day (p < 0.001) study. #Significant decrease by cells from memantine-treated ICIR rats in 21-day (p < 0.001) study vs by cells of timepoint counterpart ICIR rats. $Significant decrease for cells from memantine-treated from ICIR rats in 21- vs 14-day study (p < 0.05). Abbreviations are as in . Values shown are means ± SEM (n = 3/group).
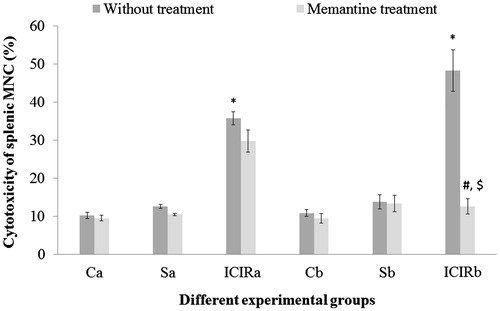
Figure 8. Effects of memantine on of splenic MNC LAI for experimental rats. *Significant decrease in LAI for cells from ICIR rats compared to by cells from control and sham-operated rats in 14- (p < 0.001) and 21-day (p < 0.001) study. #Significant decrease for cells from ICIR rats in 21- vs 14-day study (c p < 0.001). $Significant increase for cells of memantine-treated ICIR rats in 21-day study (p < 0.001) vs for cells from time-matched ICIR rat counterparts. £Significant increase for cells from memantine-treated ICIR rats in 21- vs 14-day study (p < 0.05). Abbreviations are as in . Values shown are means ± SEM (n = 3/group).
Correlations between inflammatory marker levels in the hippocampus and peripheral immune parameters
The peripheral immune parameters assayed (e.g. WBC PI, phagocytic activity of splenic PMN, splenic MNC cytotoxic activity) were found to be significantly correlated (p < 0.001) with the levels of IL-1β, ROS and nitrite in the hippocampus of ICIR rats in the 21-day study (). Levels of TNFα were significantly correlated (p < 0.001) with the phagocytic activity of splenic PMN and LAI of splenic of MNC in these same ICIR rats. After memantine administration, the cytotoxic activity of splenic MNC only showed a significant correlation with each of the inflammatory markers in the hippocampus; the PI of the WBC was also significantly correlated with the levels of TNFα.
As the results here showed that the changes in the assayed central and peripheral immune parameters increased progressively in a time-dependent manner and as maximum inflammation was observed in the 21-day study, only the results of the correlation analyses for the 21-day study are provided here to prove the relationship between central and peripheral inflammation in these rats. For full disclosure, in the 14- day study, only a few of the peripheral immune parameters were significantly correlated with the hippocampal inflammatory markers (data not shown).
Table 3. Pearson’s correlation between inflammatory markers in the hippocampus and peripheral immune parameters in intra-cerebroventricular colchicine injected rats (ICIR) and memantine treated ICIR in the 21-day study.
Discussion
The present study reported progressive neurodegeneration in the hippocampus, evidenced by chromatolysis of Nissl granules and formation of plaques, in ICIR rats. Progressive chromatolysis and plaques were also observed in ICIR rats in earlier studies (Sil et al. Citation2014). The chromatolysis and plaque counts were decreased after administration of memantine in ICIR rats in both study durations assessed here, indicating memantine could protect a host against colchicine-induced neurodegeneration. Moreover, chromatolysis of Nissl granules and plaque numbers were decreased with a longer administration of memantine (21-day study). It should be mentioned here that memantine was reported to decrease cortical amyloid β-protein levels in APP/PS1 transgenic AD mice (Alley et al. Citation2010). Prevention of chromatolysis and decreased plaque presence in the hippocampus after memantine treatment probably indicated an inhibition of neurodegeneration, as memantine can cross the blood–brain barrier (Mehta et al. Citation2013).
Colchicine-induced neurodegeneration and its mitigation/prevention by memantine may be mediated through several factors of neuroinflammation. Here, levels of hippocampal ROS, nitrite, TNFα and IL-1β – mediators of inflammation – were significantly increased in ICIR rats in both study durations, although changes in the markers were greater in the 21-day study. Similar results were noted in an earlier study (Sil et al. Citation2014). However, after memantine administration to ICIR rats, levels of the assayed inflammatory markers were decreased in both study durations, indicating neuroinflammation in the hippocampus was prevented/mitigated by memantine.
The elevated ROS levels seen in the ICIR rats were reduced partially after administration of memantine in the two study durations. While de Felice et al. (Citation2007) reported that increased ROS levels in cultured hippocampal neuronal cells were decreased after memantine treatment, reductions in ROS levels by memantine in ICIR rats has not been reported. Administration of the drug to the ICIR rats resulted in mitigation of the elevated nitrite levels in both study durations; this indicated to us memantine was effective in decreasing nitosative stress in this model. The expression of iNOS and nNOS that help in NO production in situ were reported to be decreased in the hippocampus of STZ-AD rodents after administration of memantine (at 10 mg/kg BW) (Dawson et al. Citation1993). Although the mechanism of STZ-induced AD (i.e. insulin-resistant brain state leading to neuronal damage) differs from that of ICIR (i.e. depolymerization of microtubules, affecting axoplasmic flow), Nazem et al. (Citation2015) reported that neuroinflammation was one of the important components involved in neurodegeneration in both the models. Therefore, changes in levels of neuroinflammatory markers in ICIR rats under different experimental conditions could be compared with those attained in the STZ model.
Several pro-inflammatory cytokines have neurotoxic effects (Gehrmann et al. Citation1995). Here, the higher hippocampal levels of TNFα and IL-1β (as well as ROS) in ICIR rats either returned to (IL-1β and ROS) or fell below (TNFα and nitrite) control values after dosing with memantine in both study durations. Decreases in hippocampal TNFα and IL-1β levels were also achieved with memantine in an STZ-induced AD rat model (Rai et al. Citation2013). This suggests that the decreases in neurodegeneration that occur after administration of memantine may be mediated by a lowering of these inflammatory agents. This viewpoint is supported by the finding here that reductions in hippocampal TNFα and IL-1β levels were significantly greater after longer administration of memantine (21-day) and that these measures paralleled the recovery of chromatolysis and inhibition of plaque formation (i.e. these latter outcomes were better in the 21-day vs in the 14-day study). Thus, it appears that memantine-induced time-dependent inhibition of neuro-degeneration is probably linked with a concurrent time-dependent recovery in the presence of neuroinflammatory markers.
It was indicated in an earlier study (Sil et al. Citation2014) that neuroinflammation in the hippocampus of ICIR rats were associated with alterations in peripheral immune parameters, i.e. phagocytic activity of WBC and splenic PMN, and cytotoxic activity of splenic MNC were increased in ICIR rats. Moreover, these immune parameters showed greater changes with longer durations. The present study again showed these similar increases in the peripheral immune parameters in the ICIR rats. It should be mentioned that some of the peripheral immune parameters, such as phagocytic activity and cytotoxic activity of natural killer cells, have been reported to be altered in AD patients (Britschgi & Wyss-Coray Citation2007). The altered immune parameters in ICIR rats were reversed by memantine administration. Changes in phagocytic activity of WBC and splenic PMN were completely reversed after dosing of memantine in both study durations, while the LAI and cytotoxicity of splenic MNC returned to control values after memantine administration only after the longer study duration. Effects of memantine on the assayed peripheral parameters were higher in the 21-day than in the 14-day study, indicating memantine was more effective in prevention of altered peripheral immune parameters in ICIR rats when administered for longer durations. Such effects of memantine on peripheral immune parameters in ICIR rats have not been reported previously.
It has been reported that memantine inhibited mRNA expression of iNOS (inducible) and nNOS (constitutive) in different chemically-induced animal models of AD (Kamat et al. Citation2012; Rai et al. Citation2013), indicating an ability to inhibit not only inducible, but also constitutive NO formation. It is quite probable memantine inhibited both constitutive and inducible NO production in ICIR rats and, thereby, could be responsible for the ‘sub-control’ levels of NO seen in these rats. This reduced NO presence might have influenced other components of inflammation including TNFα and IL 1β. It has been reported that NO formation may influence COX-2 activation and TNFα production in varying experimental conditions (Fonseca et al. Citation2003; Park et al. Citation2003; Shin et al. Citation2007). The results of the present study showed that memantine in the ICIR rats inhibited the TNFα formation to levels below control values. These particular outcomes, in turn, were linked with reversals in observed effects on the phagocytic index of WBC. This is not surprising in that it has been reported that TNFα influences the phagocytic activity of phagocytes (Roilides et al. Citation1998).
The observed changes in peripheral immune parameters in ICIR rats may be due to an efflux of inflammatory mediators from the brain into the peripheral circulation. The ROS, NO and TNFα levels in sera of ICIR rats were increased in comparison to control and sham-operated rats, but IL-1β levels did not show any significant change. This lack of alteration in serum IL-1β levels may be due to the fact that the fold-increase in hippocampal IL-1β levels in ICIR rats was not as high as that of hippocampal TNFα. Therefore, it is plausible that not enough hippocampal IL-1β could cross the blood–brain barrier in sufficient amounts to impact on (i.e. increase) the measured serum IL-1β levels.
Administration of memantine in both study durations resulted in substantive recovery of ROS and NO, as well as TNFα levels in the serum of ICIR rats, an outcome that might help in recovery of immune parameters in these hosts. Serum TNFα levels were lower after dosing ICIR rats with memantine in the longer study duration compared to that of rats in the shorter study. However, serum ROS and NO levels were not further changed by memantine as the study duration progressed. Thus, the observed difference in peripheral immune parameters between ICIR rats in the two study durations could probably be explained on a basis of changes in serum TNFα levels, although other factors were quite likely also involved. Moreover, all the observed peripheral immune parameters were not sensitive equally to changes in inflammatory markers, as each of the parameters did not recover in tandem with changes in marker expression in the serum.
Each of the inflammatory markers may have an effect on peripheral immune parameters (Roilides et al. Citation1998). The correlation between measured inflammatory markers and immune parameters in the present study were strong, in particular at the 21-day timepoint. While the LAI of the splenic MNC appeared least correlated to hippocampus inflammatory marker levels, it seemed that WBC PI, splenic PMN phagocytic activity and splenic MNC cytotoxic activity did correlate with colchicine-induced neuroinflammation at that site. This correlation appeared to be verified by outcomes for the inflammatory markers and peripheral immune parameters in the memantine-treated ICIR rats. Specifically, only splenic MNC cytotoxic activity remained somewhat correlated with inflammatory marker levels in the memantine-ICIR rats. It would appear that inhibition of neuroinflammation by memantine not only reduced the levels of inflammatory markers, but also almost all the induced peripheral immune parameters.
Various findings have reported that glutamate N-methyl-D-aspartate receptors (NMDAR) are involved in synaptogenesis, neuronal circuitry formation, synaptic plasticity, learning and memory, as well as in the molecular pathogenesis of neurological disorders like AD (During et al. Citation2000). Pro-inflammatory cytokines may increase NMDA-induced intracellular Ca2+ increase by effects on astrocytes, microglia or glutamatergic neurons (Yoshiyama & Groat Citation2007). Sil et al. (Citation2015) reported that ICIR showed increased pro-inflammatory cytokines (TNFα and IL-1β) levels in different brain areas, indicating neuroinflammation in the brain. Soliven and Albert (Citation1992) reported a dysregulation in Ca2+ ion influx via NMDA receptor could produce an elevation in intracellular Ca2+ ions and NO that, in turn, may initiate neuroinflammation in neuronal cells of the superior cervical ganglia. Administration of memantine (NMDA receptor antagonist) probably reduced the increased production of pro-inflammatory cytokines in the colchicine-injected rat brain, resulting in a blocking of changes in peripheral immune parameters in these rats. It is known that if the NMDA receptor is blocked by memantine it, in turn, attenuates pathological consequences of AD by preventing excitotoxicity (Malenka & Nicoll Citation1999). These latest observations now add preventing changes in peripheral immune parameters to this list of effects for memantine.
Although a role for NMDA receptors has been assessed in colchicine-induced neurodegeneration by blocking the NMDA receptor with memantine, the brain concentration of glutamate in ICIR has not yet been measured. An increase in hippocampus glutamate concentration was reported after microinjection of colchicine into the hippocampus (Nakagawa et al. Citation1987). The effect of this glutamate on neurodegeneration was explained to be on the basis of NMDA receptor stimulation (Ikonomidou et al. Citation1999, Citation2000). However, while memantine can block NMDA receptors, it also influences other receptors (α7 nicotinic receptors) that probably help to ameliorate dementia by potentiating cholinergic mechanisms in the brain (Buisson & Bertrand Citation1998; Aracava et al. Citation2005; Chen & Lipton Citation2006). Thus, the role of memantine in mitigating colchicine-induced neurodegeneration – and the underlying mechanisms – remains to be determined. Nonetheless, in the present study, use of memantine led to reversals in colchicine-induced neuroinflammation/-degeneration, indicating that NMDA receptors likely played important roles in colchicine-induced neurotoxicity. Such outcomes support the protective effect of this drug in AD patients (Robinson & Keating Citation2006).
Conclusions
NMDA receptor-mediated activity is involved in colchicine-induced neuroinflammation and neurodegeneration, as blocking of this receptor activity by memantine was able to inhibit parameters of inflammation and neurodegeneration in the treated rodent hosts. It was also clear here that the induced inflammation impacted on host immunoncompetence and that memantine was able to abrograte most of these immunomodulating effects of the colchicine.
Acknowledgments
This research work was supported by the University Grant Commission [Major Research Project {F. No. 42-532/2013 (SR), March 22, 2013}]. The Debajit Bhowmick Center for Research in Nanoscience and Nanotechnology, University of Calcutta, is acknowledged for its assistance with the FACS analysis. Pritha Gupta (junior research fellow), Ramiz Khan (MSc 2015) and Subhadeep Dutta Gupta (MSc 2013) are also acknowledged for their assistance in some parts of this work.
Declaration of interest
The authors report no conflicts of interest. The authors alone are responsible for the content and writing of the paper.
References
- Alley GM, Bailey JA, Chen D, Ray B, Puli LK, Tanila H, Banerjee PK, Lahiri DK. 2010. Memantine lowers amyloid-β peptide levels in neuronal cultures and in APP/PS1 transgenic mice. J Neurosci Res. 88:143–154.
- Aracava Y, Pereira EF, Maelicke A, Albuquerque EX. 2005. Memantine blocks α7 nicotinic acetylcholine receptors more potently than N-methyl-D-aspartate receptors in rat hippocampal neurons. J Pharmacol Exp Ther. 312:1195–1205.
- Banati RB, Gehrmann J, Schubert P, Kreutzberg GW. 1993. Cytotoxicity of microglia. Glia. 7:111–118.
- Benedikz E, Kloskowska E, Winblad B. 2009. The rat as an animal model of Alzheimer’s disease. J Cell Mol Med. 13:1034–1042.
- Blennow K, Leon MJ, Zeterberg H. 2006. Alzheimer’s disease. Lancet. 368:387–403.
- Britschgi M, Wyss-Coray T. 2007. Systemic and acquired immune responses in Alzheimer’s disease. Intl Rev Neurobiol. 82:205–233.
- Buisson B, Bertrand D. 1998. Open-channel blockers at human α4β2 neuronal nicotinic acetylcholine receptor. Mol Pharmacol. 53:555–563.
- Chen HS, Lipton SA. 2006. The chemical biology of clinically-tolerated NMDA receptor antagonists. J Neurochem. 97:1611–1626.
- Cox G. 1977. Neuropathological techniques. In: Bancroft JD, Stevens A, editors. Theory and practice of histological techniques. London: Elsevier; p. 258–259.
- Csolle C, Sperlagh B. 2010. Peripheral origin of IL-1β production in rodent hippocampus under in vivo systemic bacterial lipoplysaccharide (LPS) challenge and regulation by P2X7 receptors. J Neuroimmunol. 219:38–46.
- Csölle C, Sperlagh B. 2011. Endo-cannabinergic modulation of IL-1β in mouse hippocampus under basal conditions and after in vivo systemic LPS stimulation. Neuroimmuno-modulation. 18:226–231.
- Danysz W, Parsons CG. 2003. NMDA receptor antagonist memantine as a symptomatological and neuroprotective treatment for Alzheimer's disease: Pre-clinical evidence. Intl J Geriatr Psych. 18:23–32.
- Dawson VL, Dawson TM, Bartley DA, Uhl GR, Snyder SH. 1993. Mechanisms of nitric oxide-mediated neurotoxicity in primary brain cultures. J Neurosci. 13:2651–2661.
- de Felice FG, Velasco PT, Lambert MP, Viola K, Fernandez SJ, Ferreira ST, Klein WL. 2007. Aβ oligomers induce neuronal oxidative stress through an N-methyl-D-aspartate receptor-dependent mechanism that is blocked by the Alzheimer drug memantine. J Biol Chem. 282:11590–11601.
- During J, Symes CW, Lawlor PA, Lin J, Dunning J, Fitzsimons HL, Poulsen D, Leone P, Xu R, Dicker BL, et al. 2000. An oral vaccine against NMDAR1 with efficacy in experimental stroke and epilepsy. Science. 287:1453.
- Eijkenboom M, Blokland A, Staay FJ. 2000. Modeling cognitive dysfunctions with bilateral injections of ibotenic acid into the rat entorhinal cortex. Neuroscience. 101:27–39.
- Fonseca SG, Romao PR, Figueiredo F, Morais RH, Lima HC, Ferreira SH, Cunha FQ. 2003. TNFα mediates induction of nitric oxide synthase in macrophages but not in neutrophils in experimental cutaneous leishmaniasis. Eur J Immunol. 33:2297–2306.
- Gehrmann J, Matsumoto Y, Kreutzberg GW. 1995. Microglia: Intrinsic immune effector cell of the brain. Brain Res Rev. 20:269–287.
- Green LC, Wagner D, Glogowski J, Skipper PL, Wishnok JS, Tannenbaum SR. 1982. Analysis of nitrate, nitrite, and [15N]-nitrate in biological fluids. Anal Biochem. 126:131–138.
- Ikonomidou C, Bosch F, Miksa M, Bittigau P, Vockler J, Dickranian K, Tenkova TI, Stefovska V, Turski L, Olney JW. 1999. Blockade of NMDA receptors and apoptotic neuro-degeneration in developing brain. Science. 283:70–74.
- Ikonomidou C, Stefovska V, Turski L. 2000. Neuronal death enhanced by N-methyl-D-aspartate antagonists. Proc Natl Acad Sci USA. 97:12885–12890.
- Justo GZ, Duran N, Queiroz ML. 2000. Myelopoietic response in tumor-bearing mice by an aggregated polymer isolated from Aspergillus oryzae. Eur J Pharmacol. 388:219–226.
- Kamat PK, Tota S, Rai S, Swarnkar S, Shukla R, Nath C. 2012. A study on neuro-inflammatory marker in brain areas of okadaic acid (ICV)-induced memory-impaired rats. Life Sci. 90:713–720.
- Kumar A, Seghal N, Naidu PS, Padi SS, Goyal R. 2007. Colchicine-induced neurotoxicity as an animal model of sporadic dementia of Alzheimer’s type. Pharmacol Rep. 59:274–283.
- Lawal RA, Ozaslan MD, Odesanmi OS, Karagoz ID, Kilic IH, Ebuehi OA. 2013. Cytotoxic and anti-proliferative activity of Securidaca longepedunculata aqueous extract on Ehrlich ascites carcinoma cells in Swiss mice. Intl J Appl Res Nat Prod. 5:19–27.
- Li F, Tsien JZ. 2009. Memory and the NMDA receptors. New Engl J Med. 361:302–303.
- Lipton SA. 2006. Paradigm shift in neuroprotection by NMDA receptor blockade: Memantine and beyond. Drug Disc. 5:160–170.
- Lowry OH, Rosebrough NJ, Farr AL, Randall RJ. 1951. Protein measurement with Folin phenol reagent. J Biol Chem. 193:265–275.
- Malarkey EB, Parpura V. 2008. Mechanisms of glutamate release from astrocytes. Neurochem Intl. 52:142–154.
- Malenka RC, Nicoll RA. 1999. Long-term potentiation - a decade of progress. Science. 285:1870–1874.
- Maluish AE, Halliday WJ. 1979. Hemocytometer leukocyte adherence technique. Cancer Res. 39:625–626.
- Manev H, Favaron M, Guidotti A, Costa E. 1989. Delayed increase of Ca2+ influx elicited by glutamate: Role in neuronal death. Mol Pharmacol. 36:106–116.
- Mehta DC, Short JL, Nicolazzo JA. 2013. Memantine transport across the mouse blood-brain barrier is mediated by a cationic influx H+ anti-porter. Mol Pharm. 10:4491–4498.
- Minghetti L, Levi G. 1998. Microglia as effector cells in brain damage and repair: Focus on prostanoids and nitric oxide. Prog Neurobiol. 54:99–125.
- Nakagawa YS, Nakamura S, Kase Y, Noguchi T, Ishihara T. 1987. Colchicine lesions in rat hippocampus mimic alterations of several markers in Alzheimer's Disease. Brain Res. 408:57–64.
- Nakayama T, Sawada T. 2002. Involvement of microtubule integrity in memory impairment caused by colchicine. Pharmacol Biochem Behav. 71:119–138.
- Nazem A, Sankowski R, Bacher M, Al-Abed, Y. 2015. Rodent models of neuroinflammation for Alzheimer’s disease. J Neuroinflamm. 12:2–15.
- Oben JA, Foreman JC. 1988. A simple quantitative fluorimetric assay of in vitro phagocytocis in human neutrophils. J Immunol Meth. 112:99–103.
- Park SW, Lee SG, Song SH, Heo DS, Park BJ, Lee DW, Kim KH, Sung MW. 2003. The effect of nitric oxide on cyclooxygenase-2 (COX-2) over-expression in head and neck cancer cell lines. Intl J Cancer. 107:729–738.
- Paxinos G, Watson C, editors. 1986. The rat brain in stereotaxic coordinates. San Diego, CA: Academic Press.
- Rai S, Kamat PK, Nath C, Shukla R. 2013. A study on neuroinflammation and NMDA receptor function in STZ (ICV)-induced memory impaired rats. J Neuroimmunol. 254:1–9.
- Robinson DM, Keating GM. 2006. Memantine: Review of its use in Alzheimer's disease. Drugs. 66:1515–1534.
- Roilides E, Dimitriadou-Georgiadou A, Sein T, Kadiltsoglou I, Walsh TJ. 1998. Tumor necrosis factor-α enhances antifungal activities of polymorphonuclear and mono-nuclear phagocytes against Aspergillus fumigatus. Infect Immun. 66:5999–6003.
- Shin JI, Lee YK, Kim YM, Hwang JT, Park OJ. 2007. Possible link between NO concentrations and COX-2 expression in systems treated with soy isoflavones. Ann NY Acad Sci. 1095:564–573.
- Sil S, Ghosh R, Sanyal M, Guha D, Ghosh TK. 2015. A comparison of neuro-degeneration linked with neuroinflammation in brain areas of rats after intra-cerebro-ventricular colchicine injection. J Immunotoxicol. [Epub ahead of print]. doi: 10.3109/1547691X.2015.1030804.
- Sil S, Goswami AR, Dutta G, Ghosh T. 2014. Effects of naproxen on some immune responses in colchicine-induced rat model of Alzheimer’s Disease. Neuroimmunomodulation. 21:304–321.
- Siripin D, Fucharoen S, Tanyong DI. 2011. Nitric oxide and caspase 3-mediated cytokine-induced apoptosis in acute leukemia. Asian Pac J Allergy Immunol. 29:102–11.
- Socci DJ, Bjugstad KB, Jones HC, Pattisapu JV, Arendash GW. 1999. Evidence that oxidative stress is associated with the pathophysiology of inherited hydrocephalus in the H-Tx rat model. Exp Neurol. 155:109–117.
- Solivan B, Albert J. 1992. Tumor necrosis factor modulates Ca2+ currents in cultured sympathetic neurons. J Neurosci. 12:2665–2671.
- Stevens A, Bancroft JD, editors. 1977. Proteins and nucleic acids. Theory and practice of histological techniques. London: Elsevier; p. 129.
- Tilson HA, Rogers BC, Grimes L, Harry GJ, Peterson NJ, Hong JS, Dyer RS. 1987. Time-dependent neurobiological effects of colchicine administered directly into the hippocampus of rats. Brain Res. 408:163–172.
- Wang WY, Tan MS, Yu JT, Tan L. 2015. Role of pro-inflammatory cytokines released from microglia in Alzheimer’s disease. Ann Transl Med. 3:136. doi: 10.3978/j.issn.2305-5839.2015.03.49.
- Weidmann E, Brieger J, Jahn B, Hoelzer D, Bergmann L, Mitrou PS. 1995. Lactate dehydrogenase-release assay: A reliable non-radioactive technique for analysis of cytotoxic lymphocyte-mediated lytic activity against blasts from acute myelocytic leukemia. Ann Hematol. 70:153–158.
- Yoshiyama M, Groat WC. 2007. Role of spinal metabotropic glutamate receptors in regulation of lower urinary tract function in the de-cerebrate unanesthetized rat. Neurosci Lett. 420:18–22.