
Abstract
Amodiaquine (AQ) is associated with a relatively high incidence of idiosyncratic drug-induced liver injury (IDILI) and agranulocytosis. A previous study reported that a combination of high dose AQ and glutathione (GSH) depletion led to liver injury. However, the characteristics of this toxicity were very different from AQ-induced liver injury in humans. We developed a model of AQ-induced liver injury with characteristics similar to the injury in humans by treating mice with lower doses of AQ for several weeks. In this study we found that not only did GSH depletion not increase AQ covalent binding to hepatic proteins at this lower dose, but also it paradoxically prevented the liver injury. We extended the model to rats and found AQ treatment led to a mild delayed onset liver injury that resolved despite continued treatment with AQ. Immunohistochemistry indicated the presence of Kupffer cell activation, apoptosis and hepatocyte proliferation in the liver. There was also an increase in serum IL-2, IL-5, IL-9, IL-12, MCP-1 and TGFβ, but a decrease in leptin. Coincident with the elevated serum ALT, the number of liver CD4+ T-cells, IL-17 secreting cells and TH17/Treg cells increased at Week 3 and decreased during continued treatment. Increases in NK1.1+ cells and activated M2 macrophages were also observed during liver injury. These results suggest that the outcome of the liver injury was determined by the balance between effector and regulatory cells. Co-treatment with cyclosporin prevented AQ-induced liver injury, which supports an immune mechanism. Retinoic acid (RA), which has been reported to enhance natural killer (NK) cell activity, exacerbated AQ-induced liver injury. These results suggest that AQ-induced IDILI is immune mediated and the subsequent adaptation appears to represent immune tolerance.
Introduction
Drug-induced liver injury (DILI) is a common reason for withdrawing drugs from the market (Kaplowitz Citation2001). Approximately 50% of liver failure cases are drug-induced and 13% of DILI is idiosyncratic drug-induced liver injury (IDILI), which makes up ≈20% of severe liver injury requiring hospitalization in the United States (Lee Citation2003). The prediction and prevention of IDILI has been impossible due to the low absolute incidence, a lack of screening methods, and limited knowledge of underlying mechanisms and risk factors that lead to severe injury. Valid animal models are essential to rigorously test mechanistic hypotheses. A better understanding of the mechanism(s) of IDILI would have a significant impact on drug development and clinical therapeutics.
Amodiaquine (AQ) is effective for both prophylaxis and treatment of malaria. It was withdrawn from the U.S. market due to agranulocytosis and hepatotoxicity with an incidence of ∼1:2000 (Taylor et al. Citation2004). However, it is still the first-line antimalarial drug in many parts of Africa due to its low price and effectiveness against chloroquine-resistant malaria. It may also be effective in the treatment of Ebola (Gignoux et al. Citation2016). The first case of AQ-associated agranulocytosis was reported in 1957; since then there have been many reports of similar cases of agranulocytosis and hepatotoxicity (Glick Citation1957; Guevart et al. Citation2009). The hepatitis can be severe and several fatal cases or cases requiring liver transplantation have been reported (Guevart et al. Citation2009). As documented in a post-marketing adverse events report in the United Kingdom, the incidence of AQ-induced serious hepatic injury was estimated to be ∼1 in 15 000 (Hirschel Citation2003).
The mechanism by which AQ causes hepatotoxicity is unknown; both direct toxicity and indirect immune-mediated hypersensitivity have been postulated (Lind et al. Citation1973; Clarke et al. Citation1991). AQ is oxidized to a reactive iminoquinone by human liver microsomes and peroxidises. This chemically-reactive iminoquinone covalently binds to glutathione (GSH) and cellular macromolecules. This binding is presumably responsible for the liver injury, either directly or indirectly via an immunological mechanism (Harrison et al. Citation1992; Shimizu et al. Citation2009).
Clinical characteristics of AQ-induced hepatotoxicity suggest an immune-mediated mechanism: a delayed onset, the presence of anti-drug IgG antibodies, and a prompt increase of ALT on re-challenge with AQ (Clark et al. 1991). However, without a valid animal model with characteristics similar to the liver injury in humans it is very difficult to rigorously test mechanistic hypotheses. Others have performed studies in rats and mice; specifically, treatment of rats led to an increase in ALT and anti-drug antibodies, and in mice, co-treatment with buthionine sulfoximine to deplete GSH led to significant liver injury (Clarke et al. Citation1990; Shimizu et al. Citation2009). However, these were acute studies with high doses and the characteristics of the injury were different from the liver injury observed in humans; therefore, the mechanism of injury was likely different.
Recently, this laboratory developed a new model of AQ-induced liver injury in C57BL/6 mice with characteristics similar to mild IDILI in humans (Metushi et al. Citation2015a). Drugs that cause idiosyncratic liver failure always appear to be associated with a much higher incidence of mild injury that resolves despite continued treatment, which is similar to the injury in this model. Studies in this model suggest that natural killer (NK) cells play an important role in mild injury, and that immune tolerance limits the injury, which is similar to the “adaptation” that occurs in most patients. This is the first animal model of IDILI that mimics the clinical characteristics of mild IDILI in humans, and the injury appears to be immune mediated. Further study indicated that co-treatment of PD-1−/− mice with anti-CTL-4 antibody (PD-1 and CTLA-4 are involved in immune tolerance) and AQ resulted in a more severe liver injury with piece-meal necrosis that did not resolve with continued treatment (Metushi et al. Citation2015b). This is the first animal model of IDILI similar to more severe IDILI in humans and it was accomplished by breaking immune tolerance.
AQ is one of the few drugs that causes mild, delayed, and apparently immune-mediated liver injury in wild type animals and also can sometimes cause liver failure in humans. It therefore represents a unique model to test mechanistic hypotheses and to explore possible risk factors that convert mild liver injury into severe injury. The present work is composed of a range of studies to explore the immune response to AQ and factors that might modify the liver injury. Such studies could provide clues to risk factors that can lead in serious liver injury in humans. This is part of a larger goal of testing the hypothesis that even though most patients do not have a clinically evident idiosyncratic reaction to drugs that can cause such reactions, many animals and patients treated with such drugs do have an immune response to these drugs. For example we demonstrated that approximately 20% of patients treated with isoniazid have an increase in Th17 cells in their blood and this is associated with very mild reversible liver injury (Metushi et al. Citation2014).
Materials and methods
Animals and sample preparation
Male Brown Norway (BN), male and female Lewis, or Wistar rats (150–175 g) and male C57BL/6 mice (6–8 w-of-age) were purchased from Charles River (Montreal, QC, Canada). All animals were housed in standard cages (rats, 2/cage; mice 4/cage) in a 12-h light–dark cycle at 22 °C. They were given free access to standard rat or mouse chow and tap water for a week-long acclimatization period. Thereafter, the rats were given AQ (Ipca Laboratories Limited, Mumbai, India) suspended in saline 6 d/week by oral gavage at a dose of 62.5 mg/kg/d; mice were treated with AQ mixed thoroughly with food at a concentration of 0.2% of AQ by weight. Based on food consumption, the dose of AQ to mice was ≈200 mg/kg/d. Blood was collected from the tail veins of rats or from the saphenous veins of mice. The blood was allowed to clot for 30 min at room temperature and then centrifuged at 5000 × g for 5 min at 4 °C to isolate the serum. The serum was aliquoted and stored at −80 °C for future biochemical assays. All animal protocols used in this study were approved by the University of Toronto Animal Care Committee and conducted in an animal facility accredited by the Canadian Council on Animal Care.
Western blotting
Mice or rats were euthanized and a large part of the liver was removed from at least two different lobes and placed in 30 ml of PBS (pH 7.4; Sigma). Liver (0.5 g) was placed in a 15 ml tube and 5 ml Cell Lysis Buffer (Fisher Scientific) with protease inhibitor was added. Liver was homogenized for at least 2 min, followed by centrifugation at 1000 × g for 10 min at 4 °C. Two ml of the middle layer was collected and centrifuged at 9000 × g for 30 min at 4 °C. The middle layer was collected and stored in 100 μl aliquots at −80 °C. Protein content in the various isolates was determined using a Pierce™ BCA Protein Assay Kit (Fisher Scientific, Waltham, MA).
Liver proteins (20 μg) were then loaded onto an 8% SDS gel and resolved for ≈1 h (5 W, 150 V). Protein transfer to a nitrocellulose membrane (Bio-Rad, Hercules, CA) was then performed for 1.5 h at 250 mA (≈25 W, 100 V) in a cold room, after which the membranes were incubated for 1 h in a 5% non-fat milk solution (Bio-Rad) at room temperature. The membrane was then incubated with anti-AQ antibody, 1:10 000 (Lobach & Uetrecht Citation2014) in Tris-buffered saline–0.1% Tween-20 solution (TBST; Bioshop) overnight at 4 °C. The membrane was then washed three times for 15 min with TBST and then incubated with secondary antibody (HRP-conjugated goat anti-rabbit, 1:20 000; Sigma) in TBST for 1.5 h at room temperature. After three TBST washes, the membrane was stained with Pierce Western Blotting Detection System (Fisher Scientific) for 5 min before undergoing imaging using a FluorChem FC2 imager (Alpha Innotech, Toronto, ON).
GSH depletion
Male C57/BL6 mice were treated with AQ in food for 4 weeks at a dose of 200 mg/kg/d. Starting 1 week prior to AQ treatment, buthionine sulfoximine (BSO; Sigma, Oakville, Canada) was given in drinking water (4.4 g/l); this treatment lasted for 5 weeks. One day before AQ treatment, a dose of diethyl maleate (DEM; Sigma, 4 mmol/kg) was administrated to mice by IP injection. Liver proteins were subsequently isolated as described above. Liver GSH levels were then measured using a GSH assay kit (Cayman Chemical, Ann Arbor, MI) according to manufacturer instructions.
Detection of liver injury and cytokines/chemokines
The liver injury marker ALT (Infinity kit, Pittsburgh, PA) was measured according to the manufacturer instructions. Twenty-three cytokines or chemokines (Eotaxin, GM-CSF, G-CSF, GRO/KC, IFNγ, IL-1α, IL-2, IL-4, IL-5, IL-6, IL-9, IL-10, IL-13, IL-17, IL-18, IP-10, leptin, MIP-1α, MCP-1, RANTES, TNFα and VEGF) were measured in serum and liver homogenates using a rat MILLIPlex kit from Millipore (Billerica, MA). The livers were homogenized in 0.9% saline (20 ml/g liver) and then centrifuged at 10 000 × g at 4 °C. Supernatants from the liver homogenates or sera (12.5 μl) were used for cytokine quantification. The fluorescence was measured by a Luminex-100 luminometer (BioRad, Mississauga, ON). Rat IL-12 +p40 ELISA kits were purchased from Invitrogen Corp. (Camarillo, CA), rat TGF-β1 ELISA kits were purchased from R&D Systems (Minneapolis, MN) and the serum levels were measured according to manufacturer instructions. The limits of detection for the IL-12 and TGF-β1 kits were 3.0 and 8.4 pg/ml, respectively.
Histopathology and immunohistochemistry
At the end of each experiment, animals were euthanized by CO2, followed by the removal of livers, spleens and cervical lymph nodes. The organs were then fixed in 10% neutral-buffered formalin (Sigma-Aldrich; Oakville, ON) followed by paraffin-embedment and hematoxylin and eosin (H&E) staining, which were performed by the Department of Pathology at the Hospital of Sick Children (Toronto, ON).
Macrophages in the spleen and liver of rats were stained using mouse anti-rat ED1 (CD68) and ED2 (CD163) and lymphocytes with anti-CD-45RA (OX33) monoclonal antibodies (Santa Cruz Biotechnology Inc., Santa Cruz, CA). The formalin-fixed paraffin-embedded sections of liver and spleen were de-paraffinized with xylene (Sigma) for 5 min (twice) and re-hydrated with 100% ethanol (Sigma) twice, followed by 95%, 80% and 70% ethanol once each for 3 min. After washing, the sections were rinsed with phosphate-buffered saline (PBS, pH 7.4; Sigma) twice and then immersed in 3.0% H2O2 (Sigma) in methanol to block endogenous peroxidases. Antigens were then retrieved by using 10 μg/ml proteinase K (Thermo Fisher Scientific Inc., Rockford, IL) at 37 °C for 10 min. After washing, the samples were blocked with 1% bovine serum albumin (BSA; Fisher Scientific, Toronto) for 1 h and then the samples were covered with the primary antibody in 1% BSA for 2 h. After washing, the sections were incubated with secondary antibody conjugated with horseradish peroxidase (HRP; Bethyl Laboratories, Montgomery, TX) for 1 h. After the final washing in PBS, antibody binding was detected using Vector NovaRED (Vector Laboratories, Inc., Burlingame, CA). Sections were then counterstained with hematoxylin (Sigma), dehydrated and mounted. The sections were imaged under Zeiss light microscopy.
Apoptosis and cell proliferation
Formalin-fixed paraffin-embedded sections of the liver and spleen were stained for the presence of proliferating cell nuclear antigen (PCNA) using a biotinylated anti-PCNA antibody kit (ZYMED Laboratories, San Francisco, CA) according to manufacturer instructions. Formalin-fixed paraffin-embedded sections of the liver were also stained for the presence of inter-nucleasomal DNA fragments using an Apo-Brdu-IHC kit from BioVision (Milpitas, CA), which was a two-color terminal deoxynucleotidyl transferase dUTP nick end labeling (TUNEL) assay for labeling DNA breaks in apoptotic cells. Serum cytochrome C and osteopontin were also measured as possible markers of apoptosis and cell proliferation, respectively using a Quantikine rat/mouse cytochrome C ELISA kit and a Quantikine mouse osteopontin kit purchased from R&D Systems Inc. The levels of sensitivity of the cytochrome C and osteopontin kits were 0.5 ng/ml and 8.5 pg/ml, respectively.
Detection of serum IgG anti-AQ antibody
To determine if AQ-induced liver injury had “immune memory”, male BN rats were treated with AQ at 62.5 mg/kg for 3 weeks, the AQ withdrawn for 4 weeks and then the rats were re-challenged with AQ for 4 weeks. Serum ALT, cytokines, chemokines and anti-AQ antibodies were measured. An AQ-metallothionein conjugate was prepared according to the protocol from Kevin Park’s laboratory except that here manganese dioxide (MnO2, Sigma) was used as the oxidant instead of silver oxide (Clarke et al. Citation1990). In brief, AQ (0.148 mmol) in 2 ml chloroform was stirred with MnO2 (115 mg) in the presence of anhydrous sodium sulfate (50 mg) for 30 min at room temperature. The reaction mixture was then filtered and the solvent evaporated under nitrogen. The quinone imine of amodiaquine (AQQI) precipitated and was dissolved in 6 ml of dioxane (Sigma) that was added dropwise to a stirred solution of 10 mg rabbit metallothionein (rMT) in phosphate buffer (5 ml, 50 mM, pH 7.2) over a period of 30 min. Ascorbic acid (50 mg, Sigma) was added to reduce unreacted AQQI and the solution was dialyzed for 24 h against phosphate buffer (20 mM, pH 7.2).
An ELISA Starter Accessory Package was bought from Bethyl Laboratories and the microwell strips were coated with AQ-rMT (4 μg/well) in coating buffer. Rat serum was diluted 1:400 in saline and 100 μl samples were added to wells and the strips then incubated for 2 h at room temperature. After gentle rinsing to remove non-adhered serum components, anti-rat IgG-HRP antibody (Cell Signaling Technology, Danvers, MA) solution was added followed by a solution of 3,3′,5,5′-tetramethylbenzidine substrate (TMB, 100 μl, Bioshop Canada, Burlington, ON) and the strips were incubated for 10 min at room temperature. Serum IgG anti-AQ anti-body was then assessed according to manufacturer instructions.
Measurement of serum concentrations of AQ
Methanol (80 μl; VWR, Mississauga) containing 0.1 μM internal standard (4-dimethylaminoantipyrene; Sigma) was added to 10 μl of serum sample to precipitate the protein. The mixture was then vortexed and stored at −20 °C for 30 min. The samples were then thawed and centrifuged (15 000 × g, 10 min), and isolated supernatant then evaporated to dryness under a gentle stream of nitrogen. Residues were dissolved in 100 μl of the HPLC mobile phase and 20 μl of the aliquot was injected to the LC–MS/MS system consisting of Shimadzu LC10 HPLC and an API3000 mass spectrometer (PE Sciex, Concord, ON, Canada). Separation was done on a 2.1 × 50 mm Luna® C18 3 μm analytical column from Phenomenex (Torrance, CA); the mobile phase flow rate was 0.2 ml/min. The mobile phases used for chromatography were 0.1% formic acid (Solvent A; Sigma) and methanol (Solvent B; Sigma). The mobile phase was delivered using a linear gradient elution program: 5% methanol (Solvent B) at 0 min and increased to 90% Solvent B at 2.5 min. Multiple reaction monitoring transitions were m/z 356 → m/z 283 for AQ and m/z 232 → m/z 56 for internal standard. Data were collected and processed using Analyst 1.4.2 software (Applied Biosystems, Burlington, ON).
Phenotyping of macrophages and lymphocytes
BN rats treated with AQ were monitored for liver injury by serum ALT and groups of animals were sacrificed weekly for evaluation of the phenotype of mononuclear cells in the blood, liver, spleen and cervical lymph nodes by flow cytometry. Paraffin slices of liver and spleen were also prepared for histological studies.
Lymphocyte isolation from liver: rats were IP injected with 0.2 ml heparin (1000 U/ml; Fisher Scientific) 10 min before being euthanized. Right after, a needle was inserted into the portal vein and the liver was perfused with 50 ml PBS (pH 7.0; Sigma) containing heparin (100 U/ml) and then removed and placed in cold PBS. The liver was dissected and gently passed through a 200-gauge stainless steel mesh; the liberated cells then suspended in RPMI 1640 medium containing 100 ml/l fetal calf serum (FCS; Sigma). The cell suspension was then centrifuged (350 × g, 5 min, 4 °C). The pellet was re-suspended in 35% Percoll solution (Sigma) containing 10 U heparin/ml, loaded atop a layer of 50% Percoll solution and then centrifuged (500 × g, 15 min, 4 °C). The cells at the Percoll interface were harvested by aspiration and centrifuged again. The resultant pellet was suspended in 2 ml RBC lysis buffer (eBioscience, San Diego, CA) for 10 min and then the intact cells were washed twice and suspended in Hanks’ Balanced Salt Solution (HBSS; Sigma) containing 1% FCS.
To isolate macrophages from liver, the cell pellet from liver was prepared as described in the previous paragraph. The pellet was re-suspended in 100 ml digestion buffer and incubated at 37 °C in a waterbath for 30 min. The digestion buffer was comprised of Dulbecco's Modified Eagle's Medium (DMEM; Sigma) containing 250 μg/ml collagenase IV (Life Technology, Burlington, ON) and 15 mg MgSO4/100 ml (VWR). The cell suspension was then centrifuged at 30 × g for 2 min at 4 °C to remove the precipitate. The supernatant was centrifuged (350 × g, 5 min, 4 °C) and the resulting pellet suspended in 10–15 ml of 11% Nycdenz (Sigma) in DMEM. The solution was then loaded atop 3 ml 18% Nycodenz in HBSS and then centrifuged at 800 × g for 15 min at 4 °C. The white interface was collected and washed 3–4 times with DMEM, followed by centrifugation (800 × g, 15 min, 4 °C). The final pellet (i.e. liver macrophages) was suspended in DMEM containing 1% FCS for further analysis.
To perform the flow cytometric analyses, single cell suspensions from spleen, lymph nodes (five nodes) and blood (1 ml) were prepared as previously described (Metushi et al. Citation2015a). Lymphocytes and macrophages were isolated from livers according to the protocols above. Anti-rat CD32 antibody was used to block non-specific binding. T-helper (TH)-17 cells were evaluated by staining with anti-rat CD4 and intracellular anti-mouse IL-17 antibodies in the presence of phorbol 12-myristate 13-acetate (20 ng/ml) + ionomycin (1 μg/ml) incubated for 5 h at 37 °C. T-regulatory (Treg) cells were characterized as CD4+/CD25+/Foxp3+, TH17 cells as CD4+/IL-17+, TC17 cells as CD8+/IL-17+, IL-17 producing cells as IL-17+, NK cells as CD3−/NK1.1+, NKT cells as CD3+/NK1.1+ and NK17 cells as CD3−/NK1.1+/IL-17+. Macrophages were stained using anti-rat CD68, CD163, MHC II, intracellular TNFα, CCL2 and IL-10 antibodies. As shown in , M1 macrophages were characterized as MHC II+/CD163+/CD68−, activated M1 macrophages as MHC II+/CD163+/CD68−/CCL2+/TNFα+/IL10−, M2a macrophages as MHC II+/CD163−/CD68+, activated M2a macrophages as MHC II+/CD163−/CD68+/CCL2−/TNFα−/IL10+, M2b macrophages as MHC II+/CD163+/CD68+, activated M2b macrophages as MHC II+/CD163+/CD68+/CCL2−/TNFα+/IL10+, M2c macrophages as MHC II−/CD163−/CD68+ and activated M2c macrophages as MHC II−/CD163−/CD68+/CCL2−/TNFα−/IL10+. All antibodies above were purchased from eBioscience. 4′,6-Diamidino-2-phenylindole (DAPI, Molecular Probes) was used as a marker for live cells. Cells were counted in a LSRII cytometer (Becton Dickinson Immunocytometry System, San Jose, CA) and analyzed using FlowJo 10 software (Tree Star, Inc., Ashland, OR). A minimum of 0.2 × 10⁶ events/sample was acquired.
Table 1. Antibodies used for macrophage phenotyping and activation.
Modulation of immune response
An immunosuppressant, cyclosporine (20 mg/kg/d) was administrated by oral gavage to male BN rats for 5 weeks during treatment with AQ at the dose of 62.5 mg/kg/d. Control groups were treated with AQ only or water only. Blood samples were obtained on Days 0, 7, 14, 21, 28 and 35. Liver injury was monitored by serum ALT. In another experiment, Poly I:C was used to stimulate the immune system. Poly I:C was intraperitoneally injected at a dose of 10 mg/kg in male BN rats 1 day before the start of AQ treatment. Control groups were treated with AQ only or intraperitoneally injected with PBS only.
NK cell activation/stimulation
It was recently reported that retinoic acid (RA) was able to activate liver NK cell killing of hepatocytes and hepatic stellate cells (Lee et al. Citation2012). RA (Sigma) was dissolved in saline at the concentration of 300 mg/ml. Male BN rats were treated with AQ by gavage at the dose of 62.5 mg/kg/d for 4 weeks. Meanwhile, RA was also given by oral gavage at a dose of 30 mg/kg/d as a co-treatment for 4 weeks.
Dimethyl sulfoxide (DMSO) was reported to be able to activate hepatic NK and NKT cells in vivo as evidenced by increased NK/NKT cell numbers and higher intracellular levels of the cytotoxic effector molecules such as interferon (IFN)γ and granzyme B in both cell types (Masson et al. Citation2008). In another study, DMSO was also employed to activate NK/NKT cells. A 10% DMSO (Sigma) solution was prepared in PBS (pH 7.4). Male BN rats were treated with AQ by gavage at a dose of 62.5 mg/kg/d for 5 weeks. The low-dose DMSO group of animals were IP injected with 2 ml 10% DMSO on Day −1 (1 day before AQ treatment); high-dose DMSO group animals were IP injected with 2 ml 10% DMSO on Day −1, Day 7 and Day 14. Control animals were IP injected with 2 ml PBS.
Regulatory T-cell (Treg) depletion
To decrease immune tolerance, temozolomide (Sigma) was administrated as a co-treatment because it was reported to be able to deplete Treg cells in rats (Banissi et al. Citation2009). Male BN rats were treated with AQ at a dose of 62.5 mg/kg/d for 3 weeks. Temozolomide was administered orally with schedules designed to mimic the temozolomide regimens currently used in humans: The high-dose group was treated with 10 mg temozolomide/kg/d and the low-dose group with 2 mg/kg/d each for 21 days. Peripheral blood Treg cells were analyzed by flow cytometry using CD3, CD4, CD25, and Foxp3 monoclonal antibodies and methods akin to those outlined earlier.
Statistical analyses
Prism software (GraphPad, San Diego) was used to perform all statistical analyses. When there was more than one treatment group, data were analyzed by two-way analysis of variance (ANOVA); with only one treatment group the Mann–Whitney U-test or when there was only one time point a two-tailed Student’s t-test. All p values <0.05 were considered significant (*p < 0.05, **p < 0.01 and ***p < 0.001).
Results
GSH depletion and its effects on covalent binding and liver injury in mice
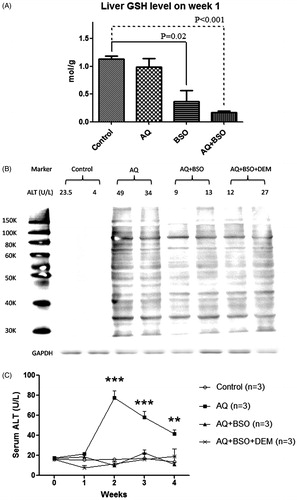
There was a slight and insignificant decrease of total liver GSH after 1 week of treatment with AQ alone, but marked depletion of liver GSH in both BSO- and AQ + BSO-treated animals, and the average depletions were 65 and 82%, respectively, compared to control animals (). GSH depletion by AQ + BSO was greater and more consistent compared to BSO alone. GSH depletion did not increase AQ covalent binding, and if anything, seemed to decrease it (). Paradoxically, co-treatment with BSO or BSO + DEM prevented AQ-induced liver injury (). This phenomenon was also observed in BN rats and Wistar rats (data not shown).
Figure 1. The effects of BSO, DEM and AQ on liver (A) GSH levels, (B) AQ covalent binding and (C) liver injury as determined by serum ALT in C57/BL6 mice after 1 week of treatment. Values shown are means ± SE (n = 4 animals per group). Data were analyzed for statistical significance by a two-way ANOVA. Values are significantly different from the control group; **p < 0.01, ***p < 0.001.
Covalent binding of AQ to hepatic proteins in BN rats treated with AQ
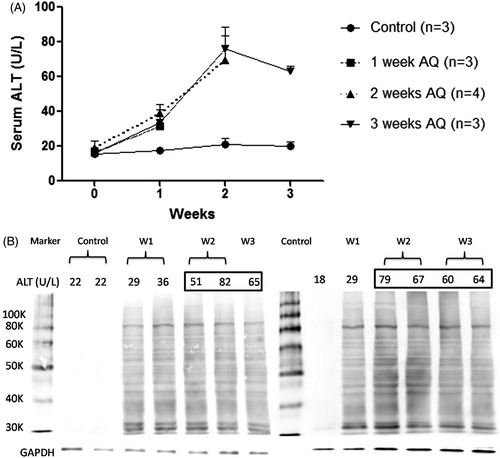
As in previous experiments with mice, treatment of BN rats with AQ led to an increase in ALT that peaked between 2 and 3 weeks as shown in . There was significant covalent binding of AQ at Week 1 and this did not significantly increase at Week 2 (). There was covalent binding to multiple proteins, and there was no difference in covalent binding between animals who had an increase in ALT at Week 1 and those that did not.
Figure 2. Time course of (A) liver injury and (B) hepatic covalent binding of AQ in AQ-treated BN rats. To perform the covalent binding studies the animals had to be sacrificed and that is why there are different animals for each time point. Not all of the liver protein samples could be fitted onto one SDS gel, but there are control samples from untreated animals on both gels.
Serum ALT and AQ concentrations in AQ-treated rats
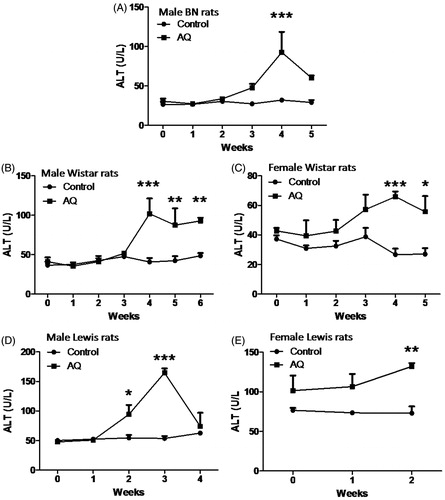
In different experiments, the peak in ALT varies between 2 and 4 weeks. In an examination of differences in strain and sex, the increase in ALT is similar in male Wistar and Lewis rats to that in BN rats, but there is less injury in female rats in each strain (). Although none of the animals appeared ill, as per ethical guidelines, they could not be treated with AQ for longer periods because in all cases the intake of food in AQ-treated rats was only 1/2–2/3 that of the control rats, and this led to a lack of weight gain or even weight loss. The experiments were repeated and the results were similar (data not shown). The serum concentration of AQ in Wistar rats increased over the first week to a level of 0.1 μM and then decreased despite the continued treatment (Supplemental Figure 1 [S1]). In contrast, the serum AQ concentration in BN rats gradually increased and reached a plateau of ∼2 μM at Day 14, which was within the range of therapeutic concentrations of AQ (0.23–2.35 nM) in humans (White et al. Citation1987).
Figure 3. Liver injury induced by AQ treatment in different strains of rats. AQ (62.5 mg/kg/d) was administrated to different strains of rats for 2–6 weeks by oral gavage. (A) Male BN rats, (B) Male Wistar rats, (C) Female Wistar rats, (D) Male Lewis rats and (E) Female Lewis rats. Each bar represents mean ± SD (n = 4 animals). Data were analyzed for statistical significance by a two-way ANOVA. Value is significantly different from control group; *p < 0.05, **p < 0.01, ***p < 0.001.
Liver histological changes induced by AQ treatment in Wistar, BN and Lewis rats
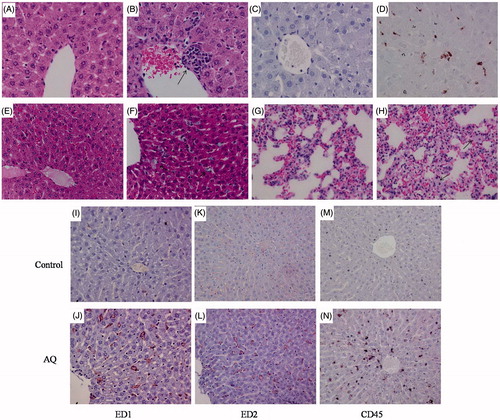
In male Wistar rats treated with AQ for 5 weeks, some focal inflammation infiltrates were observed in the liver with H&E staining (). There was also an increase in cells staining for ED1 (presumably activated macrophages) in Wistar rats after 5 weeks () and also hypertrophic Kupffer cells in AQ-treated male BN rats (). There was also an increase in cells staining for ED1, ED2 and CD45 lymphocytes (, respectively) in AQ-treated male BN rats after 5 weeks. These results suggested that AQ was able to induce an inflammatory response with mild liver injury in rats. Some hypertrophic cells were also observed in lung alveolar cells (). There were no pathological changes observed in the liver of the one AQ-treated male Lewis rat in which histology was performed or in female Lewis rats (data not shown), despite the fact that male Lewis rats had the greatest increase in ALT.
Figure 4. Histological and immunohistochemical staining of the liver from a representative male Wistar rat and a representative male BN rate treated with AQ (62.5 mg/kg/day) for 5 weeks. Wistar rats (A–D): (A) Liver of control (H&E). (B) Liver of AQ-treated rat; arrow shows inflammatory infiltrate (H&E). (C) Liver of control stained with an anti-ED1 antibody (450×). (D) Liver of AQ-treated rat; the ED1+ cells are stained brown (450×). BN rats (E–H, H&E staining, 450×): (E) Control liver. (F) Liver of AQ-treated rat, arrows show hypertrophic Kupffer cells. (G) Control lung. (H) Lung of AQ-treated rat; arrows show some hypertrophic cells. (I–N): Treatment of male BN rats with AQ for 5 weeks is associated with an increase in cells staining for ED1 (I–J), ED2 (K–L) and CD45 (M–N).
Apoptosis and cell proliferation in AQ-treated male BN rats
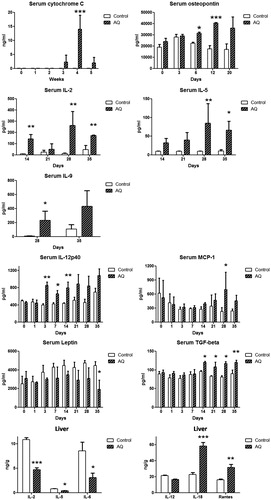
In another experiment, TUNEL and PCNA assays were employed to study apoptosis and cell proliferation, respectively. Apoptosis was found to be significantly increased in the liver of AQ-treated male BN rats compared to control rats (). No significant difference in cell proliferation was observed in the liver of AQ-treated male BN rats (); however, cell proliferation in the germinal center of spleen was significantly increased (). Serum cytochrome C, not detectable in control animals, started to increase from Week 3 and reached a peak at Week 4 followed by a reduction at Week 5 (). This correlated with the serum ALT pattern during AQ treatment () and suggested an increase in cell apoptosis. Serum osteopontin levels were significantly increased at Day 6 (to 1.5-times that of control) and reached a peak at 12 days (to 2.3-times that of control, ), an outcome consistent with lymphocyte activation/cell proliferation.
Figure 5. Cell apoptosis and proliferation in the liver and spleen in AQ-treated BN rats. (A) TUNEL staining in the liver of control rats (400×). (B) TUNEL staining in the liver of AQ-treated rats (400×). (C) PCNA staining in the liver of control rats (400×). (D) PCNA staining in the liver of AQ-treated rats (400×). (E) PCNA staining of spleen of control rats (250×). (F) PCNA staining of the spleen of AQ-treated rats (250×).
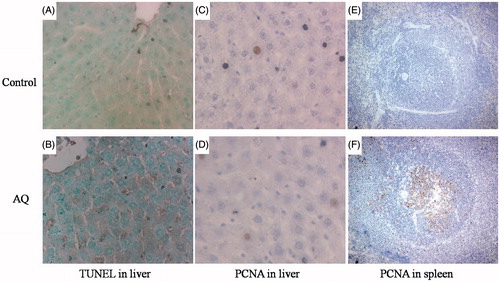
Figure 6. Cytokine and chemokine changes at serum and liver in AQ-treated male BN rats after 5 weeks. Values shown are means ± SE (n = 4 animals per group). Data were analyzed for statistical significance by a two-way ANOVA or Student’s t-test. Values are significantly different from the control group; *p < 0.05, **p < 0.01, ***p < 0.001.
Cytokine and chemokine changes in AQ-treated male BN rats
Changes in serum cytokines and chemokines in BN rats induced by AQ treatment are shown in . Serum IL-12 was increased on Day 3. Serum TGF β 1 and IL-2 were increased on Day 14. Serum IL-5, IL-9 and chemokine MCP-1 were increased on Day 28, although the pattern of MCP-1 with respect to time was unusual. However, leptin was significantly decreased after 35 days of the treatment and this may be related to the decrease in food intake. No significant changes in levels of eotaxin, G-CSF, GRO/KC, IFNγ, IL-1α, IL-4, IL-6, IL-10, IL-13, IL-17, IP-10, MIP-1α or RANTES were seen (data not shown).
Changes in liver cytokines and chemokines were also studied using ELISA and Luminex assays. Hepatic RANTES and IL-18 were significantly increased in the AQ-treated group at 5 weeks compared to the control group (). However, IL-2, IL-5, IL-6 and IL-12 levels were significantly decreased in the liver of the AQ-treated group compared to the control (). No significant changes were observed for eotaxin, G-CSF, GRO/KC, IFNγ, IL-1α, IL-4, IL-9, IL-10, IL-13, IL-17, leptin, TGF β, IP-10, MIP-1α or MCP-1 (data not shown).
Serum ALT, anti-AQ antibody, cytokines and chemokines in re-challenged male BN rats
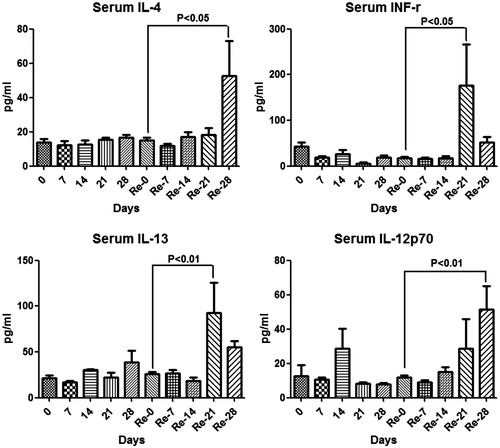
In order to determine if AQ-induced liver injury had “immune memory”, BN rats were treated with AQ for 3 weeks, withdrawn for 4 weeks, and then they were re-challenged with AQ for 4 weeks. The serum ALT started to increase at Week 2 of primary treatment and reached a peak at Week 3, followed by a reduction at Week 4, which was not significantly different from the re-challenge treatment; however, ALT appeared to be higher on re-challenge (). Anti-AQ antibody had increased by Week 1 and plateaued by Week 2 (). This time course is consistent with the resolution of the immune response and the long half-life of antibodies. The Luminex assay for cytokines and chemokines showed that IFNγ (at Day 21), IL-13 (at Day 21), IL-4 (at Day 28) and IL-12p70 (Day 28) were increased after re-challenge where they had not increased significantly on first treatment with AQ (). No significant changes were observed for eotaxin, G-CSF, GRO/KC, IFNγ, IL-1α, IL-2, IL-5, IL-6, IL-9, IL-10, IL-17, IL-18, leptin, TGF β, IP-10, MIP-1α, MCP-1 or RANTES (data not shown).
Figure 7. Serum ALT and anti-AQ antibodies in male BN rats during primary and re-challenge AQ treatment. Values shown are means ± SE (n = 4 animals per group). Data were analyzed for statistical significance by a Mann–Whitney U-test.
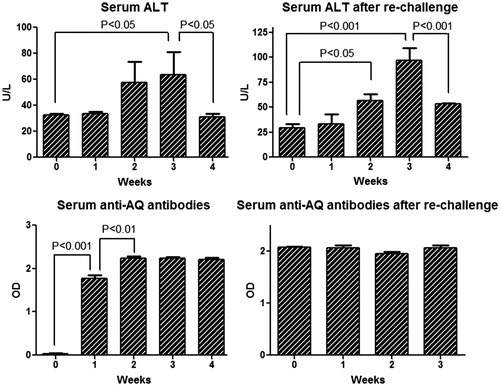
Figure 8. Serum cytokine changes in male BN rats during the primary and re-challenge AQ treatment. Values shown are means ± SE (n = 4 animals per group). The data were analyzed for statistical significance by a Mann–Whitney U-test.
Lymphocyte phenotyping in BN rats
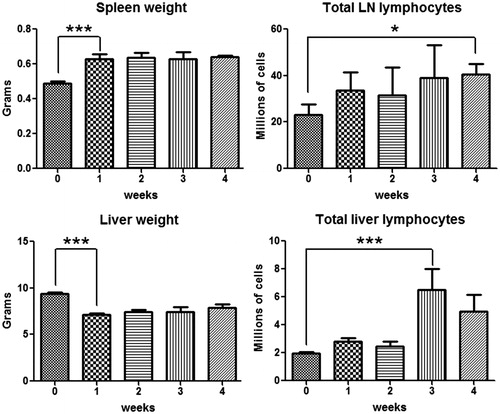
As shown in , a significant ALT increase was observed in AQ-treated BN rats by Week 3 and then decreased by Week 4 although the time course varied somewhat in different experiments. No ALT increase was observed in the control group. However, well before the liver injury was observed, the liver weight significantly decreased (). The total number of lymphocytes in the liver slightly increased from the first week and reached a peak at Week 3, then appeared to decrease by Week 4, which was coincident with the time course of the ALT (). For the secondary lymphoid organs, both spleen and lymph nodes were enlarged from the first week (data not shown); an increase in total lymphocyte number in cervical lymph nodes was also observed during the treatment ().
Figure 9. Time course of changes in liver and spleen weight as well as the number of lymphocytes in lymph nodes and liver induced by AQ treatment. Values represent the mean ± SE from eight BN rats per group. The data were analyzed for statistical significance by a Mann–Whitney U-test. (Significantly different from the control group; *p < 0.05, ***p < 0.001.)
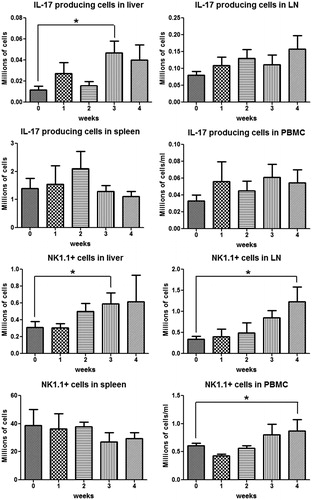
Phenotyping of lymphocytes in the liver revealed an increase in CD4+ T cells at Week 3, and then they appeared to decrease by Week 4 (), which was consistent with the time course of the ALT. Lymph node CD4+ T-cells appeared to increase from the first week, but the change did not reach statistical significance; no significant change was observed in spleen and blood CD4+ T-cells. The phenotyping results of TH17 cells and IL-17-secreting cells () indicate that TH17 and IL-17-secreting cells shared a similar tendency as the CD4+ T-cells in the liver. In addition, it appears that there may be a reciprocal relationship between the TH17 cells in the liver and spleen. As shown in , NK1.1+ cells (NK/NKT cells) started to increase in the liver and lymph nodes, and to a lesser extent in the peripheral blood, from Week 2 and kept increasing as treatment continued. However, no significant change was observed in the spleen.
Figure 10. CD4+ T-cells and TH17 cells in different organs during 4 weeks AQ treatment in BN rats. TH17 cells were characterized as CD4+/IL-17+. Values shown are means ± SE (n = 8 animals per group). Data were analyzed for statistical significance by a Mann–Whitney U-test. Value is significantly different from the control group; *p < 0.05.
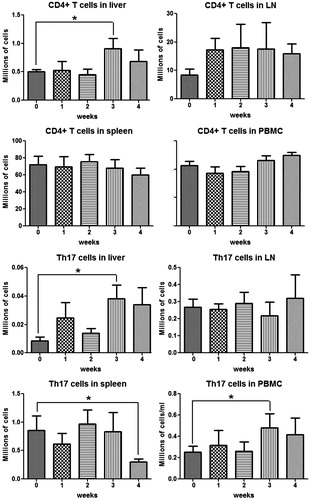
Figure 11. IL-17-secreting cells and NK/NKT cells in different organs during AQ treatment in BN rats. IL-17-secreting cells were characterized as IL-17+, NK/NKT cells as NK1.1+. Values shown are means ± SE (n = 8 animals per group). Data were analyzed for statistical significance by a Mann–Whitney U-test. Value is significantly different from the control group; *p < 0.05.
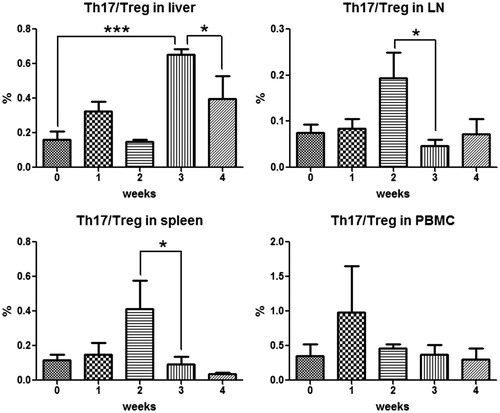
As shown in Figure S2, peripheral blood Treg cells appeared to decrease by Week 1 followed by a return towards normal. There also appeared to be a decrease in Treg cells in the liver at Week 1, and lymph nodes and spleen at Week 2; however, none of these changes were statistically significant. The ratio of TH17/Treg was calculated as an indication of immune-balance and is depicted in . There was a significant increase in the ratio in the spleen and lymph nodes at Week 2 and an increase in the liver at Week 3 – the time of maximal ALT – followed by a return toward normal after that.
Figure 12. The immune balance of Treg and Th17 in different organs during AQ treatment in BN rats. Treg cells were characterized as CD4+/CD25+/Foxp3+ and Th17 cells as CD4+/IL-17+. Values represent the mean ± SE from eight animals per group. The data were analyzed for statistical significance by a Mann–Whitney U-test. (Significantly different from the control group; *p < 0.05, ***p < 0.001.)
Macrophage phenotyping in BN rats
Macrophage phenotyping was performed in AQ-treated BN rats to investigate involvement of macrophages in AQ-induced liver injury. Macrophage levels in the peripheral blood decreased from Week 1 and then gradually returned to normal by Week 3 (Figure S3). Lymph node macrophage number decreased in the first week and then increased to above baseline by Week 3. There was no significant change in the total number of liver macrophages while spleen macrophages appeared to increase slightly by Week 4.
Further phenotyping of macrophages indicated that blood M1 macrophages decreased continuously over the first 4 weeks of AQ treatment (). In contrast, there was a decrease, then an increase and finally a decrease in M1 macrophages in lymph nodes. In the liver, there was a small but significant increase in M1 macrophages at Weeks 3 and 4, which corresponds to the liver injury, while in the spleen there was a corresponding decrease in M1 macrophages (). The pattern of activated M1 macrophages was similar but less distinct. In contrast, in general there was an increase in M2 macrophages of all subtypes and in most locations at later time points; we suspect that is, at least in part, what leads to the resolution of liver injury ( and ).
Figure 13. M1 and M2 macrophage phenotyping in peripheral blood, lymph nodes, liver and spleen of BN rats during AQ treatment. Values shown are means ± SE (n = 8 animals per group). M1 macrophages were characterized as MHC II+/CD163+/CD68−, activated M1 macrophages as MHC II+/CD163+/CD68−/CCL2+/TNFα+/IL10−; M2 = M2a + M2b + M2c, which were characterized as shown in Figure 14. Data were analyzed for statistical significance by a Mann–Whitney U-test. Value is significantly different from the control group; *p < 0.05, **p < 0.01, ***p < 0.001.
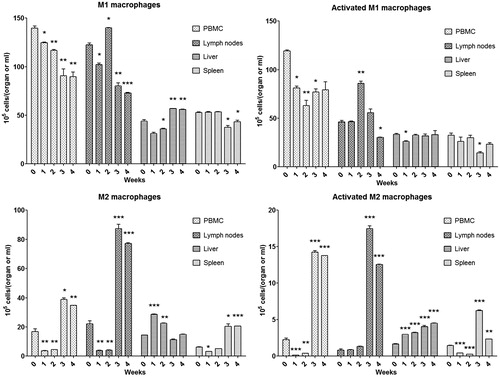
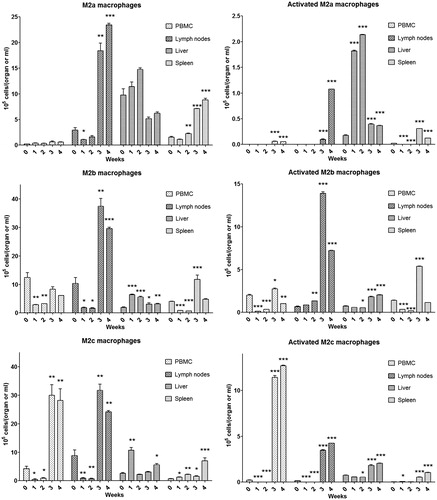
Figure 14. Subtypes of macrophages (M1, M2a, M2b and M2c) in different organs of BN rats during AQ treatment. M2a macrophages were characterized as MHC II+/CD163−/CD68+, activated M2a macrophages as MHC II+/CD163−/CD68+/CCL2−/TNFα−/IL10+; M2b macrophages were characterized as MHC II+/CD163+/CD68+, activated M2b macrophages as MHC II+/CD163+/CD68+/CCL2−/TNFα+/IL10+; M2c macrophages were characterized as MHC II−/CD163−/CD68+, activated M2c macrophages as MHC II−/CD163−/CD68+/CCL2−/TNFα−/IL10+. Values shown are means ± SE (n = 8 animals per group). Data were analyzed for statistical significance by a Mann–Whitney U-test. Value is significantly different from the control group; *p < 0.05, **p < 0.01, ***p < 0.001.
Co-treatment with cyclosporin and Poly I:C in AQ-treated BN rats
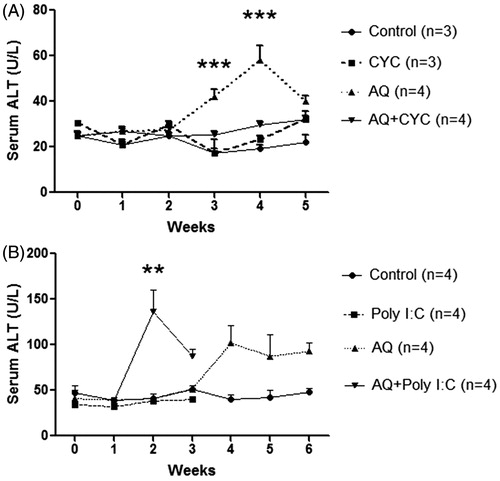
Various co-treatments were used to determine the effect of perturbation of the immune response. Co-treatment with cyclosporine prevented the ALT increase induced by AQ (). As shown in , co-treatment with the toll-like receptor agonist, Poly I:C, led to an earlier onset of ALT elevation, and the animals appeared quite ill so the animals had to be sacrificed, but Poly-I:C did not appear to significantly increase the severity of the liver injury, and the ALT was decreasing at the time of sacrifice.
Figure 15. Time course of serum ALT during co-treatment with cyclosporine or Poly I:C in AQ-treated BN rats. Values shown are means ± SE (n = 3 or 4 animals per group). Data were analyzed for statistical significance by a two-way ANOVA. Value is significantly different from the control group; *p < 0.05, **p < 0.01, ***p < 0.001.
Effect of temozolomide on Treg cell numbers
Although it has been reported that temozolomide selectively depletes Treg cells, it was observed here that co-treatment with temozolomide did not significantly affect liver injury (Figure S4), but actually increased the %Treg cells (Figure S5) in the context of a general lymphopenia (Figure S6).
Effects of RA and DMSO co-treatment on liver injury
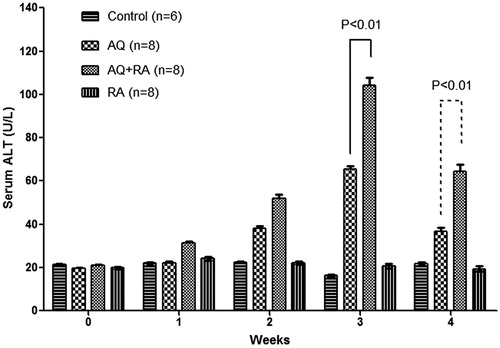
Co-treatment with RA exacerbated AQ-induced liver injury resulting in a greater increase in ALT; however, tolerance was still observed at Week 4 (). DMSO did not appear to have any significant effect on AQ-induced liver injury (Figure S7).
Figure 16. Effects of RA co-treatment on serum ALT in AQ-treated BN rats. Values shown are means ± SE (n = 6–8 animals per group). Data was analyzed for statistical significance by a two-way ANOVA.
Discussion
The characteristics of AQ-induced IDILI and agranulocytosis in humans suggest that they are immune-mediated; however, it is very difficult to perform studies in humans that would conclusively test this hypothesis (Uetrecht Citation2005). The reactive iminoquinone metabolite of AQ is presumed to be responsible for these adverse reactions (Harrison et al. Citation1992), but again there has been no way to conclusively test this hypothesis. The reactive metabolite of AQ is a “soft” electrophile that preferentially binds to thiols such as GSH. GSH-depleted animals have been used to study the mechanism of toxicity caused by reactive metabolites of drugs. A GSH-deficient model has been used to investigate hepatotoxicity induced by styrene, eugenol and methimazole (Mizutani et al. Citation1991, Citation1994, Citation1999). However, with the exception of acetaminophen overdoses, it is unlikely that usual doses of drugs can cause significant depletion of GSH. It the present work, although AQ appeared to cause a slight decrease in GSH, the decrease was unlikely to be biologically significant. At this pharmacologically relevant AQ dose, GSH depletion with BSO did not increase covalent binding and – paradoxically – prevented liver injury. These results conflict with those of Shimizu et al. (Citation2009) who reported that a single dose of AQ (180 mg/kg, by gavage) did not cause significant liver injury in mice unless the AQ administration was combined with BSO-induced GSH depletion. However, the liver injury in the Shimizu model was very different from the liver injury in the model here as well as the liver injury that occurs in humans. Specifically, it was acute toxicity caused by a significantly higher dose of AQ rather than a delayed injury observed in our model and in humans. This suggests that the mechanism of injury in our model is quite different from the injury observed in this previous mouse study and highlights the danger in extrapolating the results from acute studies with high doses to infer the mechanisms of idiosyncratic drug reactions in humans.
There are multiple detoxication pathways; one plausible explanation for the lack of effect of GSH depletion on binding is that the major detoxication mechanism for the reactive metabolite of AQ, especially at moderate doses of the drug, is reduction back to the parent drug either by reductants such as ascorbate or various reductases. In fact, depletion of GSH may have led to Nrf2 activation and increases in other protective pathways. That does not explain why GSH depletion paradoxically protected against AQ-induced liver injury. It has been reported that NK cells are functionally suppressed and undergo apoptosis induced by reactive oxygen species (ROS) such as O2− and H2O2 (Betten et al. Citation2004). The work of Peraldi and colleagues revealed that oxidative stress results in a reduced expression of the NK cell activating receptor NKG2D (Peraldi et al. Citation2009). It is thus not surprising that GSH, as a ROS scavenger, is able to affect NK cell activity: GSH is a key component in NK cell function (Millman et al. Citation2008). Viora et al. (Citation2001) reported that decreased levels of intracellular GSH severely impaired NK cell activity. The fact that GSH depletion prevents AQ-induce hepatotoxicity is consistent with the hypothesis that NK cells play a critical role in mild AQ-induced liver injury.
The present study also extended the AQ model to rats with characterization of the immune response and used different strains and co-treatments to explore the mechanism and possible risk factors for AQ-induced liver injury. The dose chosen was 62.5 mg/kg/day, which results in a serum AQ concentration of about 2 μM, a dose within the therapeutic range in humans (0.23–2.35 μM) (White et al. Citation1987). All of the rat strains tested sustained liver injury when treated with AQ, but unlike mice, female rats were relatively resistant.
The histology of AQ-induced liver injury in rats is characterized by a mild infiltrate of mononuclear cells (CD45RA positive), suggesting that AQ induced an immune response (). The increased number of cells expressing ED1 (CD68) and ED2 (CD163) implied activation of macrophages in response to AQ treatment. CD68 is a pan-macrophage marker whose expression is correlated with the phagocytic activity of macrophages, while CD163 is expressed on resident macrophages and has been used as a Kupffer cell marker in the liver (Dijkstra et al. Citation1985). AQ induced a small amount of apoptosis in liver as indicated by both the TUNEL assay and detection of cytochrome C in serum. The significant increase of PCNA expression in the spleen of AQ-treated animals suggests activation of immune system, and there was also an increase in serum osteopontin. Recent studies have shown that osteopontin is not only able to enhance cell proliferation in many tissues such as kidney, and prostate (Angelucci et al. Citation2004; Liu et al. Citation2009), but it also plays an important role in mediating hepatic inflammation and the ensuing liver toxicity (Ramaiah et al. Citation2007). In addition, osteopontin was reported to be closely related to production of IL-17, a pro-inflammatory cytokine, during the pathogenesis of chronic hepatitis B and concanavalin A-induced hepatitis (Diao et al. Citation2012).
The hypothesis that AQ-induced hepatotoxicity is immune-mediated is supported by the results of this study. Our results show a complex immune response involving many cell types that evolve over time. First, a mild delayed liver injury and the presence of anti-drug antibody were observed in both AQ-treated and re-challenged animals. Second, significant changes in serum cytokines were observed during AQ-treatment; both proinflammatory and antiinflammatory cytokines were produced in response to AQ treatment, and these changes preceded the increase in ALT. Although in most experiments the ALT did not increase until Day 21, IL-12 started to increase on Day 3, followed by elevations of IL-2 and IL-5 on Day 14. IL-12 is a pro-inflammatory cytokine that enhances the cytotoxicity of NK cells and CD8+ T-cells by stimulating production of IFNγ and TNFα from T-cells and NK cells (Trinchieri Citation2003; Papadakis et al. Citation2004). IL-2 is also generally considered a pro-inflammatory cytokine able to activate Kupffer cells, induce leukocyte adhesion, and lead to liver injury (Nakagawa et al. Citation1996). Recent studies reported that MCP-1 was closely associated with hepatotoxicity, possibly by recruiting leukocytes and inducing enhanced expression of pro-inflammatory cytokines. Increased expression of MCP-1 was observed in liver injury induced by carbon tetrachloride and a deficiency of MCP-1 protects mice against alcoholic liver injury (Czaja et al. Citation1994; Mandrekar et al. Citation2011). This is consistent with the macrophage and lymphocyte infiltration observed that we observed in the liver.
As the AQ-induced liver injury resolved, the concentration of several pro-inflammatory cytokines, including IL-2, -5, -6 and -12, also decreased. This decrease in pro-inflammatory cytokines matched the decreases in ALT. However, enhanced IL-18 and RANTES (regulated and normal T-cell expressed and secreted, or CCL5) were observed after 5 weeks of treatment; both appear to be involved in NK cell proliferation and activation. Significant elevation of several cytokines was also found in AQ re-challenged animals, including IL-4, IL-12, IL-13 and IFNγ. Of course it is difficult to determine whether the immune response caused the liver injury or it was a response to the liver injury. However there are many lines of evidence to support the hypothesis that the immune response caused the liver injury. As mentioned, several cytokines, especially IL-12, increased well before the increase in ALT. In these experiments co-treatment with cyclosporine prevented AQ-induced liver injury, while Poly I:C caused an earlier increase in ALT; however, Poly I:C did not lead to a higher ALT and it made the animals appear generally unwell so it is hard to interpret the Poly I:C results. Re-challenge of animals with AQ did not lead to an earlier increase in ALT, which suggested a lack of immune memory; however, the increase in ALT and cytokines was greater on re-challenge. One possible reason for the lack of a rapid onset on re-challenge was that most of the injury was mediated by NK cells that are part of the innate immune system. In addition, the increase in ALT decreased with time, implying immune tolerance, and this may have modulated the immune memory. Although immune mediated reactions classically occur rapidly on re-challenge, there are clearly immune mediated adverse reactions that do not occur rapidly on re-challenge, especially if they are mild reactions (Uetrecht Citation2008).
In addition to the increase in inflammatory cytokines, other changes were observed in the first week in AQ-treated BN rats before the increase in ALT, e.g. lymphocyte infiltration, and enlarged spleen and lymph nodes. These observations suggest that the immune response caused the liver injury rather than being a response to the injury. The increase in CD4+ T-cells, TH17 cells, and NK/NKT in the first week implies the activation of both the innate and adaptive immune systems. A continuous and constant NK/NKT cell accumulation was observed in the liver. Metushi et al. (Citation2015a) previously reported a role for NK cells in AQ-induced liver injury.
The present study also revealed there were changes in M1 and M2 macrophages in the liver during the first week of AQ treatment. AQ may cause mild hepatic injury leading to the activation of macrophages that are involved in repair of tissue damage and regulating the immune response. As the liver injury progressed, more M1 macrophages were observed in the liver; however, the total levels of activated M1 macrophages did not change. The total number of activated M2 macrophages was found to gradually, but significantly increase during the entire AQ treatment, suggesting they functioned to limit the immune response and injury and ultimately led to immune tolerance.
Earlier research from our laboratory already showed the critical role of NK cells in AQ-treated C57BL/6 mice: specifically, depletion of NK cells significantly attenuated the AQ-induced liver injury (Metushi et al. Citation2015a). To investigate the involvement of NK cells in AQ-induced hepatotoxicity, RA was administrated as co-treatment in AQ-treated BN rats. Recently, several studies found that RA is able to activate liver NK cell killing of hepatocytes and hepatic stellate cells (Lee et al. Citation2012). Taimr et al. (Citation2003) found that RA induced expression of RAE-1, an activating ligand for NK cells, and further enhanced NK cell cytotoxicity by releasing TNF-related apoptosis-inducing ligand (TRAIL). In the current study, RA co-treatment exacerbated AQ-induced liver injury with an earlier onset (Day 7) and increased severity. This result with RA again supported the plausible pathogenic role of NK cells in AQ-induced hepatotoxicity.
Conclusion
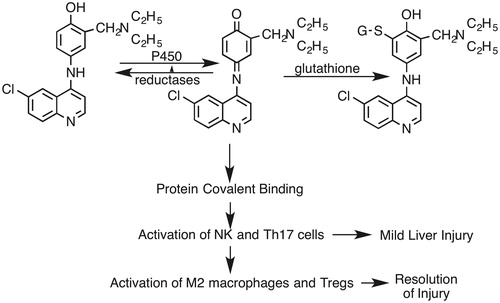
Although we have not yet been able to develop an animal model of severe AQ-induced IDILI, we have shown that AQ causes a delayed onset of mild IDILI in BN rats that appears to be immune-mediated and resolves via what appears to be immune tolerance. Immune responses are very complex, and these experiments suggest many cells are involved in the immune response to AQ. In particular, previous studies in mice in which depletion of NK cells was protective strongly suggest that NK cells play an important role in the liver injury. If the injury is immune mediated, the resolution despite continued treatment must involve immune tolerance. The marked increase in M2 macrophages is consistent with this hypothesis, and Treg cells may also be involved although the data for Treg cells is not as clear. The proposed sequence of events, although oversimplified, is illustrated in . This may be an excellent model to study the phenomena that hepatologists refer to as adaptation, which likely represents immune tolerance. We postulate it is only when immune tolerance fails that severe liver injury results, and in previous studies we found that impaired immune tolerance significantly increased AQ-induced liver injury in mice (Metushi et al. Citation2015b). The outcome of liver injury and tolerance depends on the complicated immune balance between effector cells and regulatory cells. Many of the interventions that we utilized in this study did not have the expected effect on the severity of the liver injury, and further studies of factors that influence the severity of the injury in this model may provide important clues to the risk factors for severe IDLI in humans.
Figure 17. Proposed general mechanism of AQ-induced liver injury. AQ is first oxidized to a reactive quinone imine. Most of this reactive species is inactivated by reduction back to AQ or conjugated with GSH. However, some of the reactive metabolite binds to hepatic proteins and leads to an immune response that involves NK cells and Th17 cells. This leads to inflammation and mild liver injury. However, this immune response and injury resolves, in part mediated by M2 macrophages and Treg cells.
Supplementary Figure S1
Download JPEG Image (42.3 KB)
Supplementary Figure S2
Download JPEG Image (331.5 KB)
Supplementary Figure S3
Download JPEG Image (213.8 KB)
Supplementary Figure S4
Download JPEG Image (110.4 KB)
Supplementary Figure S5
Download JPEG Image (80.1 KB)
Supplementary Figure S6
Download JPEG Image (139.7 KB)
Supplementary Figure S7
Download JPEG Image (190.2 KB)
Acknowledgements
Dr. Jack Uetrecht is the recipient of the Canada Research Chair in Adverse Drug Reactions. This work was supported by a grant received from the Canadian Institutes of Health Research. Part of this work was presented by Ping Cai, Feng Liu and Jack Uetrecht at the Society of Toxicology Annual Meeting in Washington, D.C, USA, in 2011.
Disclosure statement
The authors report no conflicts of interest. The authors alone are responsible for the content and writing of the paper.
Related Research Data
References
- Angelucci A, Festuccia C, Gravina GL, Muzi P, Bonghi L, Vicentini C, Bologna M. 2004. Osteopontin enhances cell proliferation induced by the epidermal growth factor in human prostate cancer cells. Prostate. 59:157–166.
- Banissi C, Ghiringhelli F, Chen L, Carpentier AF. 2009. Treg depletion with a low-dose metronomic temozolomide regimen in a rat glioma model. Cancer Immunol Immunother. 58:1627–1634.
- Betten A, Dahlgren C, Mellqvist UH, Hermodsson S, Hellstrand K. 2004. Oxygen radical-induced natural killer cell dysfunction: Role of myeloperoxidase and regulation by serotonin. J Leukocyte Biol. 75:1111–1115.
- Clarke JB, Maggs JL, Kitteringham NR, Park BK. 1990. Immunogenicity of amodiaquine in the rat. Int Arch Allergy Appl Immunol. 91:335–342.
- Clarke JB, Neftel K, Kitteringham NR, Park BK. 1991. Detection of anti-drug IgG antibodies in patients with adverse drug reactions to amodiaquine. Int Arch Allergy Appl Immunol. 95:369–375.
- Czaja MJ, Geerts A, Xu J, Schmiedeberg P, Ju Y. 1994. Monocyte chemoattractant protein (MCP)-1 expression occurs in toxic rat liver injury and human liver disease. J Leukocyte Biol. 55:120–126.
- Diao H, Liu X, Wu Z, Kang L, Cui G, Morimoto J, Denhardt DT, Rittling S, Iwakura Y, Uede T, Li L. 2012. Osteopontin regulates IL-17 production in hepatitis. Cytokine. 60:129–137.
- Dijkstra CD, Dopp EA, Joling P, Kraal G. 1985. The heterogeneity of mononuclear phagocytes in lymphoid organs: Distinct macrophage subpopulations in the rat recognized by monoclonal antibodies ED1, ED2, and ED3. Immunology. 54:589–599.
- Gignoux E, Azman AS, de Smet M, Azuma P, Massaquoi M, Job D, Tiffany A, Petrucci R, Sterk E, Potet J, et al. 2016. Effect of artesunate-amodiaquine on mortality related to Ebola virus disease. N Engl J Med. 374: 23–32.
- Glick L. 1957. Fatal agranulocytosis during treatment with a amodiaquine. Br Med J. 1:932.
- Guevart E, Aguemon A. 2009. Two cases of fulminant hepatitis during a curative treatment with an artesunate-amodiaquine combination. Med Mal Infect. 39:57–60.
- Harrison AC, Kitteringham NR, Clarke JB, Park BK. 1992. The mechanism of bioactivation and antigen formation of amodiaquine in the rat. Biochem Pharmacol. 43:1421–1430.
- Hirschel B. 2003. Questions about the antimalarial amodiaquine. Lancet. 361:2.
- Kaplowitz N. 2001. Drug-induced liver disorders: Implications for drug development and regulation. Drug Safety. 24:483–490.
- Lee WM. 2003. Drug-induced hepatotoxicity. N Engl J Med. 349:474–485.
- Lee YS, Jeong WI. 2012. Retinoic acids and hepatic stellate cells in liver disease. J Gastroenterol Hepatol. 27:75–79.
- Lind DE, Levi JA, Vincent PC. 1973. Amodiaquine-induced agranulocytosis: Toxic effect of amodiaquine in bone marrow cultures in vitro. Br Med J. 1:458–460.
- Liu YJ, Zhang DQ, Sui XM, Tian W. 2009. Overexpression of human osteopontin increases cell proliferation and migration in human embryo kidney-293 cells. Cell Mol Biol Lett. 14:670–678.
- Lobach AR, Uetrecht J. 2014. Involvement of myeloperoxidase and nadph oxidase in the covalent binding of amodiaquine and clozapine to neutrophils: implications for drug-induced agranulocytosis. Chem Res Toxicol. 27:699–709.
- Mandrekar P, Ambade A, Lim A, Szabo G, Catalano D. 2011. An essential role for monocyte chemoattractant protein-1 in alcoholic liver injury: Regulation of pro-inflammatory cytokines and hepatic steatosis in mice. Hepatology. 54:2185–2197.
- Masson MJ, Carpenter LD, Graf ML, Pohl LR. 2008. Pathogenic role of natural killer T and natural killer cells in acetaminophen-induced liver injury in mice is dependent on the presence of dimethyl sulfoxide. Hepatology. 48:889–897.
- Metushi IG, Zhu X, Chen X., Gardam MA, Uetrecht J. 2014. Mild isoniazid-induced liver injury in humans is associated with an increase in TH17 cells and T-cells producing IL-10. Chem Res Toxicol. 27:683–689.
- Metushi IG, Cai P, Dervovic D, Liu F, Lobach A, Nakagawa T, Uetrecht J. 2015a. Development of a novel mouse model of amodiaquine-induced liver injury with a delayed onset. J Immunotoxicol. 12:247–260.
- Metushi IG, Hayes MA, Uetrecht J. 2015b. Treatment of PD-1 mice with amodiaquine and anti-CTLA4 leads to liver injury similar to idiosyncratic liver injury in patients. Hepatology. 61:1332–1342.
- Millman AC, Salman M, Dayaram YK, Connell ND, Venketaraman V. 2008. Natural killer cells, glutathione, cytokines, and innate immunity against Mycobacterium tuberculosis. J Interferon Cytokine Res. 28:153–165.
- Mizutani T, Irie Y, Nakanishi K. 1994. Styrene-induced hepatotoxicity in mice depleted of glutathione. Res Commun Mol Pathol Pharmacol. 86:361–374.
- Mizutani T, Murakami M, Shirai M, Tanaka M, Nakanishi K. 1999. Metabolism-dependent hepatotoxicity of methimazole in mice depleted of glutathione. J Appl Toxicol. 19:193–198.
- Mizutani T, Satoh K, Nomura H, Nakanishi K. 1991. Hepatotoxicity of eugenol in mice depleted of glutathione by treatment with DL-buthionine sulfoximine. Res Commun Chem Pathol Pharmacol. 71:219–230.
- Nakagawa K, Miller FN, Sims DE, Lentsch AB, Miyazaki M, Edwards MJ. 1996. Mechanisms of IL-2-induced hepatic toxicity. Cancer Res. 56:507–510.
- Papadakis KA, Prehn JL, Landers C, Han Q, Luo X, Cha SC, Wei P, Targan SR. 2004. TL1A synergizes with IL-12 and IL-18 to enhance IFNγ production in human T-cells and NK cells. J Immunol. 172:7002–7007.
- Peraldi MN, Berrou J, Dulphy N, Seidowsky A, Haas P, Boissel N, Metivier F, Randoux C, Kossari N, Guérin A, et al. 2009. Oxidative stress mediates a reduced expression of the activating receptor NKG2D in NK cells from end-stage renal disease patients. J Immunol. 182:1696–1705.
- Ramaiah SK, Rittling S. 2007. Role of osteopontin in regulating hepatic inflammatory responses and toxic liver injury. Expert Opin Drug Metab Toxicol. 3:519–526.
- Shimizu S, Atsumi R, Itokawa K, Iwasaki M, Aoki T, Ono C, Izumi T, Sudo K, Okazaki O. 2009. Metabolism-dependent hepatotoxicity of amodiaquine in glutathione-depleted mice. Arch Toxicol. 83:701–707.
- Taimr P, Higuchi H, Kocova E, Rippe RA, Friedman S, Gores GJ. 2003. Activated stellate cells express the TRAIL receptor-2/death receptor-5 and undergo TRAIL-mediated apoptosis. Hepatology. 37:87–95.
- Taylor WR, White NJ. 2004. Anti-malarial drug toxicity: A review. Drug Safety. 27:25–61.
- Trinchieri G. 2003. IL-12 and the regulation of innate resistance and adaptive immunity. Nat Rev Immunol. 3:133–146.
- Uetrecht J. 2005. Role of animal models in the study of drug-induced hypersensitivity reactions. AAPS J. 7:E914–E921.
- Uetrecht J. 2008. Idiosyncratic drug reactions: Past, present, and future. Chem Res Toxicol. 21:84–92.
- Viora M, Quaranta MG, Straface E, Vari R, Masella R, Malorni W. 2001. Redox imbalance and immune functions: opposite effects of oxidized low-density lipoproteins and N-acetylcysteine. Immunology. 104:431–438.
- White NJ, Looareesuwan S, Edwards G, Phillips RE, Karbwang J, Nicholl DD, Bunch C, Warrell DA. 1987. Pharmacokinetics of intravenous amodiaquine. Br J Clin Pharmacol. 23:127–135.