
Abstract
The aim of the present study was to explore the potential hematotoxic and immunotoxic effects of melamine (MA) in the absence and presence of formaldehyde (FA) in mice. Forty adult Swiss mice were equally allocated into four groups and daily treated with water, MA (50 mg/kg), FA (25 mg/kg), and MA + FA respectively via feeding needle for 60 consecutive days. Hematological status was evaluated using erythrogram and leukogram profiling. Innate immune functions were assessed by measuring white blood cells lysozyme and phagocytic activities. Serum immunoglobulin levels were evaluated as indicators of humoral immunity. In addition, histologic and immunohistochemical evaluations of splenic tissues were performed. The results indicated that either MA or FA treatment resulted in significant decreases in RBCs, Hb, MCHC, total WBC, lymphocyte, and basophile levels as well as in WBCs phagocytosis and lysozyme activity. In contrast, MCV, PCV%, and reticulocyte levels were significantly increased in these hosts. The total IgM level was significantly reduced in the MA-only-exposed mice but markedly increased in the FA-only-treated ones. A significant decrease in serum IgG levels was detected following either MA or FA treatment. The combined exposure to MA and FA, compared to levels of either toxicant alone, was revealed to evoke a significant improvement in Hb, PCV%, MCV, MCHC, neutrophil, eosinophil, total IgM level, and lysozyme activity; however these values did not reach that of the controls. Furthermore, compared to control mice, both MA-only- and FA-only-treated mice showed a strong distribution of CD4+ and CD8+ cells in their spleens, while a moderate presence of the former cells was obvious at their co-exposure. Taken together, these findings revealed that exposure to MA or FA resulted in significant alterations in hemato-immune parameters at variable degrees while a co-exposure resulted in the mitigation of most effects of either toxicant alone.
Introduction
Melamine (MA), which is an industrial nitrogen heterocyclic triazine compound, has been used as a fertilizer, a nonprotein nitrogenous source for feeding cattle and recently as an adulterant in pet, livestock, and fish foods (Hau et al. Citation2009). In addition, MA is found as a metabolite and a degradation product of the pesticide and veterinary drug cyromazine (a cyclo-propyl MA derivative that is used as an acaricide/insecticide) as well as a trace contaminant in nitrogen-containing feed supplements like urea (EFSA Citation2010).
In recent years, international food safety agencies have examined toxicities of MA due to a large number of accidental pet deaths following ingestion of MA-tainted foods (Rumbeiha et al. Citation2010; Dorne et al. Citation2013). Moreover, a serious food safety alert regarding MA poisoning arose due to contaminated infant formula found in various countries (WHO Citation2008). Among the many known adverse effects associated with MA consumption are bladder cancer (Ogasawara et al. Citation1995), kidney damage (Dobson et al. Citation2008), nerve dysfunction (Wang et al. Citation2011), and reproductive toxicity (Yin et al. Citation2013).
Formaldehyde (FA) is widely used in the livestock industry for the disinfection of houses and equipment, and in the treatment of rapeseeds, as well as soybean, oil, and groundnut meals used for feeding large animals (Sharma & Srivastava Citation1990). FA is routinely added as a preservative for foods (e.g. Fruits, vegetables, seafood, and honey) and some drugs (Vargova et al. Citation1993). FA is also used to reduce bacterial load (especially Salmonella) in poultry feed (Brown Citation1996). In non-ingestible settings, FA is broadly used in the production of foam insulation, carpeting, and pressed-wood products (Maddalena et al. Citation2009). Regardless of its widespread use, FA has been described as a toxicant to the respiratory tract, as well as the nervous and urogenital systems (Vargova et al. Citation1993; Zararsiz et al. Citation2006). FA is frequently used in combination with MA in the manufacture of thermosetting plastics including those used in kitchenware, whiteboards, and commercial filters; both are also used as flame retardants in buses and aircraft (Ibhazehiebo & Koibuchi Citation2012).
During the screening of children who ingested MA-contaminated powdered formula, it was noted that some had some symptoms of immunocompromise (Zhou et al. Citation2010). Even after these findings, there is still little available information on the effects of MA on the immune system (Yin et al. Citation2016). In comparison, far more studies have investigated the effect of FA toxicity on the immune system, albeit few due to oral exposure (Sapmaz et al. Citation2015). One study reported that immune and hematologic parameters were unchanged in mice exposed to 15 ppm of FA for 21 days (Dean et al. Citation1984). On the other hand, another one reported that immune and hematopoietic systems were adversely affected in hosts exposed to FA for six months (Baj et al. Citation1994). Another study demonstrated that although FA was bound by albumin, the immune system was capable of producing antibody against the FA-albumin complex, thereby mitigating the direct toxicity of the FA (Coutinho et al. Citation1995). However, in a 90-day study, rats orally administered 10-mg FA/kg showed a significant reduction in both the number and the percentage of the white pulp of the spleen (Al-Saraj et al. Citation2006).
Due to the paucity of information on the effects of oral exposure to MA and/or FA, and the increasing risk of such exposures, the present work was undertaken to investigate potential effects of individual/concurrent MA and FA exposures on immune and hematopoietic systems. Furthermore, in a recent investigation in mice, it was found out that MA caused cytotoxic effects of spleen lymphocytes when administered at a dose of 50 mg/kg/day for 14 consecutive days (Yin et al. Citation2014). Also, oral treatment of mice at a dose of 25 mg FA/kg BW every day for 60 days resulted in high rates of necrotic foci in their livers, but the spleen picture has not been evaluated yet at this dose (Soni et al. Citation2013). Hence, in the current study, MA and FA were evaluated at doses of 50 and 25 mg /kg, respectively.
Material and methods
Test compounds and other reagents/chemicals
MA (99.5% purity) was purchased from Alpha Chemica (Mumbai, India). FA (40% solution) was bought from El Gomhouria Co. (Cairo, Egypt). Each was diluted in distilled water to working stock concentrations to be used in this experiment.
Commercial enzyme-linked immunosorbent assays (ELISA) kits (Kamiya Biomedical, Tukwila, WA) were purchased to estimate serum immunoglobulin G (IgG) and IgM, as well as of lysozyme activity (MyBioSource, San Diego, CA). All other reagents/chemicals used purchased from (Sigma, St. Louis, MO) and were of analytical grade.
Animal grouping and experimental design
Swiss mice (male, 8-week-of-age, 20–25 g) were purchased from the Laboratory Animal Farm at Zagazig University. All mice were housed in stainless steel cages in a pathogen-free environment maintained at a controlled temperature (21–24 °C) with a relative humidity of 50–60%) and a 12-hour light–dark cycle. All mice had ad libitum access to standard rodent chow and filtered water throughout the study. Mice were acclimated 2 weeks prior to use in any study herein.
At the time of the experiment, mice were weighed and randomly distributed into four groups each containing 10 mice. Group I (C) Control mice received distilled water. Group II (MA) mice received 50 mg of MA/kg/day (Chen et al. Citation2010). Group III (FA) mice received 25 mg of FA/kg/day (Soni et al. Citation2013). Group IV (MA + FA) mice were co-treated with MA and FA at the doses given in groups 2 and 3. For 60 consecutive days, mice were given all treatments (at a volume of 0.1 ml/each mouse containing the desired concentration of test compounds) once daily through a 20-G feeding needle. In this procedure, the needle was gently put in the back of the mouth toward the mouse’s left side, and then allowed to slide down the esophagus and then the solution was slowly injected.
Mice were carefully monitored throughout the experiment for signs of toxicity, morbidity, and mortality. All mice were weighed once per week to allow dose volumes to be adjusted accordingly. The Ethics of Animal Use in Research Committee (EAURC) of Zagazig University approved all protocols involving animals here. All experimental procedures were carried out according to the NIH general guidelines for the Care and Use of Laboratory Animals in scientific investigations.
Collection of biologics from the mice
On the termination of the dosing (60 Days), mice were fasted overnight after exposure. All mice of each group were then weighed and euthanized by cervical dislocation under light ether anesthesia. Two separate blood samples were collected from the jugular vein from each mouse; 0.5 ml was collected into an EDTA tube for use in hematological evaluations. Another 0.5 ml [second] was collected into a tube (without EDTA) and left for 20 min at room temperature to coagulate; after centrifugation at 3000 rpm for 10 min, the generated serum was isolated and placed at −20 °C until used (within 2 weeks) in the biochemical assays outlined below. At necropsy, the spleen was removed, washed with physiological saline, and weighed. Small portions of the spleen were collected and fixed in 10% buffered neutral formalin solution for histopathological and immunohistochemical examinations. The remainder was used to prepare cell suspensions for use in the assays outlined below.
Hematological evaluation
Determinations of total red blood cells (RBCs), packed cell volume (PCV), hemoglobin (Hb), mean cell volume (MCV), mean corpuscular hemoglobin concentration (MCHC), total leukocytes, lymphocytes, granulocytes, and monocytes were carried out according to the method of Feldman et al. (Citation2000) using a Hema Screen 18 automated hematology analyzer (Hospitex Diagnostics, Sesto Fiorentino, Italy). Total leukocyte counts were performed using an automated analyzer; differential leukocyte counts were carried out using the manual method of Dacie and Lewis (Citation1991).
Reticulocyte counts were done using a supra-vital technique using methylene blue stain, wherein residual ribosomal RNA within reticulocytes was precipitated (NCCLS Citation2004). For this, equal volumes of blood and methylene blue dye were mixed in a plastic tube and incubated at room temperature for 20–35 min. Thereafter, a wedge film on a slide was prepared and examined by light microscopy using a 100× oil immersion objective and 10× ocular as outlined in Lewis et al. (Citation2006). According to the method of Evans et al. (Citation1993), 1000 erythrocytes/sample were counted, and reticulocyte counts were expressed as percentages, i.e. as 100% × [number of reticulocytes/total number RBC].
Serum IgG, IgM, and lysozyme activity determinations
Serum concentrations of IgG, IgM and lysozyme activity were measured using commercial ELISA kits, according to manufacturer’s instructions. The detection ranges of the IgG and IgM kits were 9.375–600 ng/ml and 12.5–800 ng/ml, respectively. The minimum sensitivity of lysozyme activity kit was 75 pg/ml, with a detection range of 125–8000 pg/ml. All samples were assayed in triplicate.
White blood cells phagocytic activity
White blood cells (WBCs) were separated from peripheral blood to measure phagocytic activity using Ficoll–Histopaque density gradient centrifugation according to Hampton et al. (Citation1994). In brief, whole blood samples were collected aseptically in heparinized tubes from lightly ether-anesthetized mice. After collection, the blood was diluted 50% with phosphate-buffered saline (PBS, pH 7.4), layered onto Ficoll–Hypaque, and centrifuged at l000 × g for 20 min. The interface layer was removed, and the pellet of red cells and WBC was suspended in dextran. The red cells were allowed to sediment for 30 min and the upper layer was removed. The cells in that later were counted in a hemocytometer and resuspended to a final concentration of 106 cells/ml in RPMI 1640 media containing 25 mM of HEPES, 15 μg of phytohemagglutinin/ml, 10% heat-inactivated fetal bovine serum, 100 U of penicillin.ml, and 0.1% of streptomycin (all from Life Technologies, Grand Island, NY).
The phagocytic capacity of the leukocytes was assessed using heat-inactivated labeled Candida albicans (C. albicans) in 24-well gelatin/plasma-coated plates according to the method of Elmowalid (Citation2002). In brief, isolated leukocytes were loaded into the wells at 500 μl/well. After 2 hours at 37 C in a humidified CO2 incubator to permit adherence, the media was removed and replaced with 300 μl/well of complete RPMI 1640 containing fluorescein isothiocyanate (FITC)-labeled yeast particles (Sigma) to yield a final ratio in well of 50 labeled C. albicans/cell. The plates were then incubated for 30 min at 37 °C. After the incubation, the cells in each well were washed three times with cold PBS to stop phagocytosis. The cells were then air-dried and examined using a DMLS fluorescence microscope (Leica Microsystems, Wetzlar, Germany) with a 490-nm excitation and 515-nm emission filter. A minimum of three slides/mouse was evaluated. To determine the phagocytic cell capacity, cells containing (>10, >20, and >30) FITC-labeled yeast in at least 20 microscopic fields (containing at least 200 cells) were calculated. The number of C. albicans/100 phagocytes was estimated to yield the phagocytic index for each mouse.
Histopathological and immunohistochemical investigation
The fixed portions of each spleen specimen collected at necropsy (see above) were dehydrated in graded ethanol (70–100%), cleared in xylene, and embedded in paraffin. Thereafter, 5-μm thick sections were prepared and then stained with hematoxylin and eosin (HE) for histopathological examination (Suvarna et al. Citation2013). Another group of embedded paraffin sections was also prepared for immunodetection of CD4 and CD8 (T- and B-lymphocytes marker, respectively)-positive cells using an avidin-biotin-peroxidase (ABC) method of Soliman et al. (Citation2014) and Mohamed et al. (Citation2015). In brief, the sections were deparaffinized and treated with 3% H2O2 for 10 min to inactivate endogenous peroxidases. Subsequently, the tissue samples were heated in 10-mM citrate buffer at 121 °C for 30 min to permit antigen retrieval, then blocked in 5% normal goat serum (Life Technologies) for 20 min. Thereafter, the sections were incubated with primary monoclonal antibodies (mAb) specific for CD4 or CD8 in PBS (at manufacturer-recommended dilutions) overnight at 4 °C. The following primary mAb were used: mouse [BC/1F6] anti-CD4 (ab846, Abcam, Cambridge, UK) and mouse [YTS169.4] anti-CD8 (MCA1768, Serotec, Kidlingtone, UK). For negative controls, PBS was used as a substitute for the primary antibodies. The following day, after three extensive washes with PBS, the sections were coated with biotin-conjugated secondary antibody (1:2000 dilution in PBS; sc2040; Santa Cruz Biotechnology, Santa Cruz, CA) solution and incubated for 20 min at 37 °C. After gentle washing with PBS, the slides were then incubated for 20 min at 37 °C with horseradish peroxidase (HRP)-labeled streptavidin solution (Life Technologies). Finally, antibody binding was visualized by coating the sections with diaminobenzidine (DAB) solution containing 0.006% H2O2 (Life Technologies) and incubation for 20 min at 37 °C. After a final gentle rinsing with PBS, the sections were counterstained with hematoxylin stain for 10 Sec at room temperature. For assessing expression of CD4 and CD8 on cells, five fields/section and four sections from four different mice/treatment were examined using a BX51 light microscope (Olympus, Tokyo, Japan). Evaluations were done in a blinded manner, and sample scores were calculated according to routine diagnostic guidelines as following: Score =1 (weak; <10 positive lymphocytes [either CD4+ or CD8+] per each of three high-power fields [HPF]), at 40× magnification; Score =2 (moderate; 11–20 positive lymphocytes/HPF); and Score =3 (strong; >20 positive lymphocytes/HPF).
Statistical analysis
Data were expressed as means ± SE. Evaluations of the results were performed using a one-way analysis of variance (ANOVA) followed by Duncan’s Multiple Range test. Statistical analyses were performed using Software GRAPHPAD INSTAT (Version 2). A p value <0.05 was accepted as significant. In addition, a Graphpad (ISI Software, Philadelphia, PA) computer program was used to conduct regression analysis and to plot collected data. All data were tested for normality via a Shapiro–Wilk W test and results reported to ≤5%, level of significance.
Results
Clinical observations and changes of spleen to body weight ratio in mice
Throughout the experimental period, no deaths or adverse clinical signs were observed in the control or treated groups. Compared with the spleen of mice from the control group, a trend toward an increase in the spleen to body weight ratio was noted in both MA- and/or FA-exposed mice, but the effects were not significant ().
Table 1. Splenic weight and spleen to body weight ratio in mice orally treated MA and/or FA for 60 days.
Effect on hematological parameters
The effects of a 60-day oral supplementation with MA and/or FA on hematological variables (erythrograms, leukograms, and reticulocyte counts) are shown in . The erythrograms revealed that mean values for RBCs, Hb, and MCHC were significantly lower in both MA-only- and FA-only-exposed hosts compared to those in the control mice. In MA + FA co-exposed hosts, both Hb and MCHC values were significantly higher than in mice exposed to either agent alone, and RBC counts showed a trend toward an increase, but did not reach values seen in control mice. On the other hand, both MCV and PCV% values were significantly increased (relative to controls) in mice individually exposed to MA and FA. However, these values were significantly lower in MA + FA co-treated mice compared to mice exposed to either toxicant alone. Once again, the changes were not enough to attain control host values.
Table 2. Hematologic variables in mice orally treated with MA and/or FA for 60 days.
With respect to leukograms, both individually and co-exposed mice had significant decreases in total WBCs, lymphocyte, and basophil levels compared to values in control mice. In comparison with the controls, levels of neutrophils were only significantly increased in FA-only-exposed mice. On the other hand, relative to control mice levels, the numbers of eosinophils were only significantly decreased in MA-only-exposed mice, but increased in the other treatment groups. No significant differences in monocyte levels were detected between any of the groups.
Effects on serum IgG and IgM levels
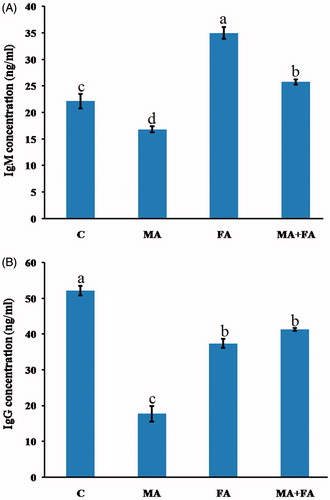
The effect of continuous daily MA and/or FA exposure for 60 days on the humoral immune response parameters in the mice is shown in . Primarily, total IgM level significantly decreased by 24.1% in the MA-exposed group when compared with the control group. On the other hand, both FA-only- and MA + FA-exposed mice significantly increased by 57.9% and 16.3%, respectively, with respect to control group values in total IgM levels (). As shown in , MA, FA, and MA + FA-treated mice had serum total IgG levels that were significantly reduced by 66.1, 28.3, and 20.8%, respectively, compared with the control mice values.
Figure 1. Effect of treatments on serum immunoglobulin levels. (A) IgM. (B) IgG. The values shown are the means ± SE (n = 5). Bars with different letters significantly differ from one another (p < 0.05).
Effect on phagocytosis and lysozyme activity
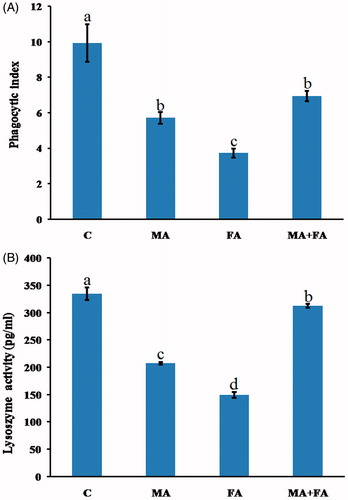
Compared to control mice cells, phagocytic indices of the circulating WBC of individually and co-exposed mice were significantly decreased by 42.5, 62.5, and 30.0%, respectively (). With regard to serum lysozyme activity, values in both the MA-only- and FA-only-exposed mice were significantly reduced by 38.1 and 55.4%, respectively, compared to control (). Co-administration of MA + FA caused an increasing trend toward normal lysozyme activity levels, but these values still did not reach that of the controls (i.e. decreased by only 6.7% from control).
Figure 2. Effect of treatment on WBC parameters. (A) Phagocytic index. (B) Lysozyme activity. The values shown are the means ± SE (n = 5). Bars with different letters significantly differ from one another (p < 0.05).
Histopathological and immunohistochemical findings
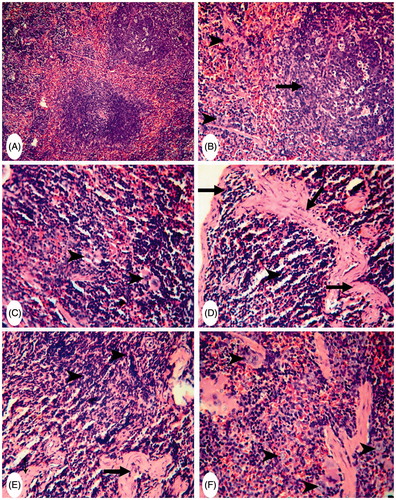
Spleen sections from control mice had normal lymphoid cells in the white pulp and abundant megakaryocytes in the red pulp (). The spleens of MA-only-treated mice had mild hyperplasia among the white pulp lymphoid cells (with an increase in pulp dimensions) as well as an increased presence of numerous megakaryocytes; the latter was slightly degenerated (). The spleens of FA-only-treated mice showed severe thickening and hyalinization of the splenic capsule and trabeculae (). Focal areas of necrosis in the splenic parenchyma and proliferation of fibroblasts were also apparent, with complete disappearance of the megakaryocytes (). The spleens of (MA + FA) co-treated mice revealed slight decreases in the dimensions of the white pulp and megakaryocytes ().
Figure 3. Representative photomicrographs of H&E-stained spleen sections. (A) Group C: normal white pulp and with numerous megakaryocytes in red pulp. Magnification 200×. (B) Group MA: mild hyperplasia in lymphoid cells of white pulp with an increase in dimensions (arrow) and a presence of megakaryocytes (arrowheads). Magnification 200×. (C) Higher magnification of (A) to show numerous megakaryocytes in red pulp (arrowheads) Magnification 400×. (D) and (E) Group (FA): thickening and hyalinization of capsule and trabeculae (arrows) – no evidence of megakaryocytes (arrowhead). Magnification 400×. Area of necrosis in splenic parenchyma and proliferation of fibroblasts (arrowheads) beside thick trabeculae (arrows). Magnification 400×. (F) Group (MA + FA): slight decreases in dimensions of white pulp and megakaryocytes (arrow-heads). Magnification 400×.
As shown in , control mice spleen sections also had a slight presence of CD4+ or CD8+ cells scattered throughout the white pulp; levels of these were greater in the red pulp and subcapsular area ( and ). The spleens of MA-only-treated mice showed a strong presence of CD4+ cells around the splenic sinusoids and in the lymphoid cells in the red pulp (). However, here, the white pulp had CD4+ cells in the germinal centers (). CD8+ cells were strongly present in both the white and red pulp of these hosts’ spleens (). The spleens of FA-only-treated mice revealed a strong presence of CD4+ and CD8+ cells in both the white and red pulp (). Spleens of MA + FA co-treated mice only had a moderate increase in CD4+ cells, particularly in the white pulp (). In these same tissues, while there was a moderate distribution of CD8+ cells in the red pulp and subcapsular areas these cells were rarely seen in the white pulp ().
Figure 4. Representative photomicrographs of immunohistochemical staining for CD4+ cells in mouse spleens. (A) Group C: slight presence of CD4+ cells in the white pulp (arrowhead) and increased presence in red pulp/subcapsular areas (arrows) (Score 1). Magnification 400×. (B) and (C) Group MA: strong presence of CD4+ cells around splenic sinusoids (arrowheads) and lymphoid cells in red pulp (arrow). Magnification 200×. CD4+ cells in white and red pulp germinal centers (arrows) (Score 3). Magnification 400×. (D) and (E) Group FA: strong presence of CD4+ cells in both white and red pulp (arrows) (Score 3). Magnification 400×. (F) Group (MA + FA): moderate increases in the presence of CD4+ cells in white pulp (arrows) (Score 2). Magnification 400×.
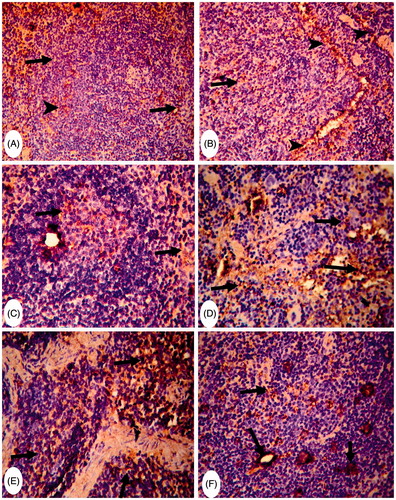
Figure 5. Representative photomicrographs of immunohistochemical staining for CD8+ cells in mouse spleens. (A) Group C: rare CD8+ cells in the white and red pulp (arrows) (Score 1). Magnification 200×. (B) and (C) Group MA: strong presence of CD8+ cells in white and red pulp (arrow) (Score 3). Magnification 200× and 400×. (D) and (E) Group FA: strongly diffuse presence of CD8+ cells in both white and red pulp (arrows) (Score 3). Magnification 200× and 400×. (F) Group (MA + FA): moderate presence of CD8+ cells in red pulp and subcapsular area (arrows) (score 2). Magnification 400×.
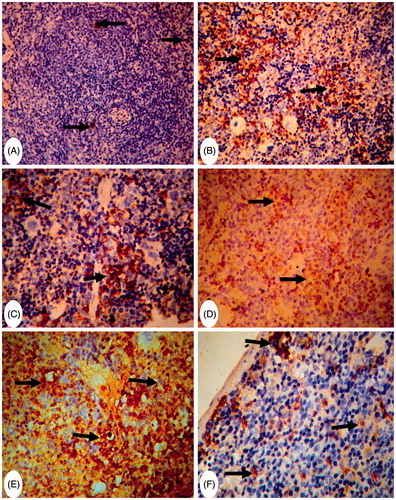
Table 3. Immunochemical scoring of CD4+ and CD8+ cells in spleen sections of mice orally treated with MA and/or FA for 60 days.
Discussion
In the body, there is a strong interplay between hematopoietic and immune cells to safeguard against foreign molecules. In many cases, either or both of these populations are impacted on by host exposure to occupational/environmental pollutants. Hence, there is a growing need for the hematological and immunological assessment of exposure to these agents, in particular the outcome associated with exposures to their mixture. Therefore, the present work sought to assess the impact on hematopoietic and immune cells after separate or combined exposures to MA and FA in Swiss mice.
In the current study, the individual exposure to MA and FA evoked a significant decline in most of both erythrogram and leukogram elements beside a depleted innate and humoral immunity (i.e. IgG) biomarkers compared to the control values. Most interesting in the present work, the concurrent exposure to MA and FA evoked an antagonistic outcome. The former outcome was obvious in terms of a significant mitigation of the disturbances of Hb, PCV%, MCV, MCHC, neutrophil, eosinophil, and total IgM levels, and lysozyme activity, compared to those levels seen in MA-only- and FA-only-treated mice. Moreover, a trend toward the amelioration, but nonsignificant, was observed in levels of RBCs, IgG level, and phagocytic activity in the concurrent MA + FA group compared to MA-only- and FA-only-treated one. In spite of this, the degree of improvement brought about by the co-exposure to both MA and FA did not reach all estimated indices to the control values. Metabolomic studies that investigated the role of gut microbes in the conversion of MA to cyanuric acid could help to explain these findings (Zheng et al. Citation2013). Certain bacteria, such as Klebsiella terrigena (a part of the mammalian gut microbiome) normally can generate cyanuric acid from MA via deamination (Shelton et al. Citation1997; Wackett et al. Citation2002). In this case, one would expect an elevated toxicity in the mammals exposed to MA (re: MA-cyanurate or MA-cyanurate-urate crystals). At the same time, Klebsiella species are susceptible to FA; thus, during the concurrent exposures, it is possible that the FA hindered MA conversion in the gut (Saha et al. Citation2009). If this was the case here, there were less MA-derived toxicants available to impart hematologic/immunologic effects in these hosts.
Here, treatment of mice with MA resulted in significant reduction in RBC, Hb, and MCHC compared to those levels seen in control mice. Similar findings were reported in rats treated for 28 days with MA at a dose of 20,000 ppm in the diet (El Rabey et al. Citation2013). It was suggested that such reduction could be linked to the formation of insoluble complexes of MA-cyanurate or MA-cyanurate-urate during in situ metabolism of MA (Zheng et al. Citation2013). These complexes might shorten the life span of RBCs by weakening the integrity of their membranes though induced decreases in activity of Na+/K+-ATPase and decreases in membrane osmotic resistance (Straková et al. Citation2014). In addition, kidney damage induced by MA may have an impact on overall hematopoiesis due to a subsequent decrease in the formation/release of erythro-poietin hormone resulting in erythrocytopenia (Hau et al. Citation2009; Doubek et al. Citation2010).
In the current study, both MCV and PCV values in addition to reticulocyte counts were significantly increased in the MA-only-treated group. This condition of erythrocytes, pseudo-macrocytosis, has been previously reported in broiler chickens-fed diets supplemented with 50 or 100 mg of MA/kg feed for 40 days (Straková et al. Citation2014). It was believed that this outcome could be attributed to MA-induced impaired renal functions, azotemia, and uremia that subsequently caused an increase in reticulocyte levels and PCV values (Hau et al. Citation2009). In addition, in a previous in vitro report, incubation of erythrocytes with 400 μM of MA-cyanurate resulted in deformation and aggregation of the cells (Wang et al. Citation2010).
FA administration in the current study not only reduced erythrocyte numbers, and both Hb and MCHC values, but also led to increase in host MCV and PCV values. Similar erythrograms were noted with quails fed 20 ml FA/kg feed (Khan et al. Citation2005). These changes might be due to an inhibitory effect of FA on cell multiplication in bone marrow (Zhang et al. Citation2013). Moreover, it was evident here that the FA-only-treated mice exhibited a marked rise in reticulocytes. Due to the effect of FA on RBCs, a lack of ability to carry enough oxygen throughout the body can result in a premature release of reticulocytes into the bloodstream (Khan et al. Citation2005).
In the present experiment, total leukocyte levels in MA-only-treated mice significantly declined (with a concomitant reduction in lymphocytes and granulocytes). This leukopenic effect could be also associated with a negative effect of MA on cell membrane integrity (Straková et al. Citation2014). Additionally, these changes could be related to adverse pathological changes in the liver previously reported in MA-treated rats (El Rabey et al. Citation2013). Specifically, MA-induced liver damage could have subsequently had a negative impact on the bone marrow and, consequently, leukocyte levels (Doubek et al. Citation2010).
The study here also showed there was a marked reduction in total leukocytes in FA-only-treated mice (with results in blood paralleled to the histological alterations in these hosts). In line with these findings, Kuo et al. (Citation1997) reported that occupational FA exposure led to decreased WBC counts overall. Nevertheless, these same hosts evidenced significant neutrophilia and eosinophilia. Why these cell types were not equally impacted like other immune cells remains unclear. However, a significant increase in neutrophil and eosinophil counts could be due to an ability of FA to induce inflammatory states that would then be accompanied by neutrophil and eosinophil infiltration to the exposure site (Jung et al. Citation2007).
This study also evaluated the impact of the exposures on the function of some of the cells involved in innate and adaptive immune responses. Both phagocytic and lysosomal enzyme activities were assessed as indicators of induced changes in innate immune function. The impact on the adaptive immune system changes was evaluated via measures of changes in host serum immunoglobulin levels, CD4+, and CD8+ cell distribution. Here, lower phagocytic and lysozyme levels were suppressed following the MA and/or FA treatments. These suppressed activities might be associated with at least two factors acting simultaneously in the case of MA, i.e. alterations in cell membrane integrity and the impact of a presence of MA crystals (Straková et al. Citation2014). Among the various phagocyte classes, Tolleson (Citation2008) reported that macrophages were more sensitive to the cytotoxic effects of MA. In contrast, FA might be believed to be able to influence phagocytic activity primarily through inactivation of the cell oxidative burst (Ibrahim et al. Citation2015).
In this study, IgG and IgM levels in mice receiving MA were significantly reduced as compared to the controls. These results are contrary to the observations of Zhou et al. (Citation2010) who noted an elevation in IgM in children who had consumed MA-contaminated formula. Such differences in observations could be due to variations in the respective paradigms of exposure as elevated IgM antibodies are usually associated with recent exposure. On the other hand, the humoral response seemed to be modulated in a different way by FA; these hosts displayed elevated IgM and reduced IgG levels. These results are partly in agreement with those of a study wherein FA inhalation (5–10 ppm, 4 weeks) led to significantly increased serum IgM and decreased serum IgG levels in rats (Sapmaz et al. Citation2015). However, Vargova et al. (Citation1993) reported that oral administration of FA for 28 days reduced the levels of both IgG and IgM in rats. Such contradictory outcomes are not unique to rodent models. Analyses of workers exposed to low levels of FA showed these individuals suffered significant decreases in serum IgG and IgM levels (Aydin et al. Citation2013). In contrast, long-term FA inhalation exposure of individuals led to elevated levels of IgG (Thrasher et al. Citation1990). It is thus possible to infer that the responses of host IgG and IgM levels to FA exposure that were seen here could be changed by simply varying the length and/or routes of exposure.
The results of the present study pointed out a trend toward the elevated spleen to body weight ratio in both MA- and FA-exposed mice. Such increase was correlated with the detected histopathological alterations in the splenic tissue, including the hyper plastic lymphoid cells of the white pulp of MA-exposed group and the thickening of the splenic capsule and trabeculae with the proliferation of fibroblasts in the FA-exposed group. Notably, megakaryocyte (responsible for the production of platelets) degeneration was noted in the spleens of the MA-only-exposed mice, whereas these cells were absolutely absent in the tissues of the FA-only-exposed mice. These findings could help to explain the previously reported decreases in platelet counts after occupational FA exposure (Tang et al. Citation2009) and coagulation disorders associated with MA exposure (Wiwanitkit Citation2010).
To evaluate the potential impact of MA and/or FA on lymphocyte-mediated responses, splenic CD4+ and CD8+ cell profiles were analyzed. Here, both MA and FA had a stimulatory effect on the presence of splenic CD4+ and CD8+ cells. This would be in line with previous findings showing that CD4+ and CD8+ cell numbers were significantly increased in the bronchus-associated lymphoid tissues (BALT) of young and adult rats exposed to 6-ppm FA for 6 weeks (Sandikci et al. Citation2007). However, another study concluded that FA caused a decrease in T-suppressor (CD8) cell levels in the blood of exposed workers, while T-helper (CD4) cell levels remained unchanged (Madison et al. Citation1991). Also, our findings were in contrast with the observations of Zhou et al. (Citation2010) who noted that the levels of CD4+ cell in children those who had consumed MA-contaminated formula were significantly lowered. Nevertheless, the distribution of different lymphocyte subsets (and so here specifically, the impact of MA and/or FA) was markedly different between the spleen and the peripheral blood is akin to observations that have been previously observed by other investigators (i.e. Langeveld et al. Citation2006).
Conclusions
The results of these studies hematologic and immunologic endpoints indicated, for the first time, that prolonged (60 days) oral exposure of mice to MA or FA could alter both host hematology and immunology significantly but the combined exposure resulted in less impact on most of these parameters overall. Further studies should be focused on molecular mechanisms of these effects and how the combined exposures could cause no synergistic/additive impact. Also, the results presented here raise concern about the need for more complete toxicological evaluations of the outcomes of co-exposures to MA and FA.
Acknowledgements
The authors would like to thank Dr. Mohamed Hamed, Professor of Pathology, Faculty of Veterinary Medicine, Zagazig University, for his support in histopathological and immunohistochemical studies.
Disclosure statement
The authors report no conflicts of interest. The authors alone are responsible for the content and writing of the paper.
References
- Al-Saraj A, Shaya E, Al Sammak M. 2006. The effect of formaldehyde on the lymphoid tissues of rats: quantitative and histological study. Tikrit Med J. 12:76–85.
- Aydin S, Canpınar H, Undeğer U, Güç D, Çolakoğlu M, Kars A, Başaran N. 2013. Assessment of immuno- and genotoxicity in workers exposed to low concentrations of formaldehyde. Arch Toxicol. 87:145–153.
- Baj Z, Majewska E, Zeman, K, Pokoca L, Dworniak D, Paradowski M, Tchórzewski H. 1994. Effect of chronic exposure to formaldehyde, phenol and organic chloro-hydrocarbons on peripheral blood cells and immune system in humans. J Invest Allergol Clin Immunol. 4:186–191.
- Brown R. 1996. FDA approved use of formaldehyde in poultry feed. Feed Stuffs 15:40–44.
- Chen X, Yuan H, Xie Z, Guo C, Zhu L, Deng S, Lu Y, Wei Q. 2010. Effects of melamine and cyanuric acid on renal injury and its mechanism in mice. Acta Vet Zootech Sinica 41:1614–1621.
- Coutinho A, Kazatchkine MD, Avrameas S. 1995. Natural autoantibodies. Curr Opin Immunol. 7:812–818.
- Dacie JV, Lewis SM, editors. 1991. Practical hematology. 7th ed. London: Churchill Livingstone. p. 659–661.
- Dean JH, Lauer LD, House RV, Murray MJ, Stillman WS, Irons RD, Steinhagen WH, Phelps MC, Adams DO. 1984. Studies of immune function and host resistance in B6C3F1 mice exposed to formaldehyde. Toxicol Appl Pharmacol. 72:519–529.
- Dobson RL, Motlagh S, Quijano M, Cambron RT, Baker TR, Pullan AM, Regg B, Bigalow-Kern A, Vennard T, Fix A, et al. 2008. Identification and characterization of toxicity of contaminants in pet food leading to an outbreak of renal toxicity in cats and dogs. Toxicol Sci. 106:251–262.
- Dorne JL, Doerge DR, Vandenbroeck M, Fink-Gremmels J, Mennes W, Knutsen HK, Vernazza F, Castle L, Edler L, Benford D. 2013. Recent advances in the risk assessment of melamine and cyanuric acid in animal feed. Toxicol Appl Pharmacol. 270:218–229.
- Doubek J, Slosarkova S, Rehakova K, editors. 2010. Interpretation of basic biochemical and haematological findings in animals. Brno: Noviko.
- EFSA. 2010. Panel on Contaminants in the Food Chain (CONTAM) and EFSA Panel on Food Contact Materials, Enzymes, Flavorings and Processing Aids (CEF); scientific opinion on melamine in food and feed. EFSA J. 8:1573.
- Elmowalid AG 2002. Unmasking the effect of bovine viral diarrhea virus on macrophage inflammatory functions. Chapter 2. A dissertation in partial fulfillment of the requirements for the Doctor of Philosophy. Major in Biological Sciences, Microbiology (Immunology). SD, USA: South Dakota State University, Brookings.
- El Rabey HA, Al-Seeni MN, Al-Solamy SM. 2013. Bee honey protects the liver of male rats against melamine toxicity. BioMed Res Int. 2013:786051.
- Evans GO, Fagg R, Smith DE. C.1993. Manual absolute reticulocyte counts in healthy Wistar rats. Comp Hematol Intl. 3:116–118.
- Feldman BF, Zinkl JG, Jain NC, editors. 2000. Schalm’s veterinary hematology. 5th ed. London: Lippincott. p. 1219–1924.
- Hampton MB, Vissers MC, Winterbourn CC. 1994. A single assay for measuring rates of phagocytosis and bacterial killing by neutrophils. J Leukocyte Biol. 55:147–152.
- Hau AK, Kwan TH, Li PK. 2009. Melamine toxicity and the kidney. JASN 20:245–250.
- Ibhazehiebo K, Koibuchi N. 2012. Melamine: emerging neurotoxicant? J Med Biomed Res. 11:20–28.
- Ibrahim BS, da Silva CM, Barioni É. 2015. Formaldehyde inhalation during pregnancy abolishes development of acute innate inflammation in offspring. Toxicol Lett. 235:147–154.
- Jung W, Kim E, Lee E, Yun H, Jeong M, Hwang K, Sul D, Kang H. 2007. Formaldehyde exposure induces airway inflammation by increasing eosinophil infiltrations through the regulation of reactive oxygen species production. Environ Toxicol Pharmacol. 24:174–182.
- Khan A, Bachaya HA, Khan MZ, Mahmood F. 2005. Pathological effects of formalin (37% formaldehyde) feeding in female Japanese quails (Coturnix coturnix japonica). Human Exp Toxicol. 24:415–422.
- Kuo H, Jian G, Chen C, Liu C, Lai J. 1997. White blood cell count as indicator of formaldehyde exposure. Bull Environ Contam Toxicol. 59:261–267.
- Langeveld M, Gamadia LE, Ten Berge IJ. 2006. T-lymphocyte subset distribution in human spleen. Eur J Clin Invest. 36:250–256.
- Lewis SM, Bain BJ, Bates I, editors. 2006. Hematologia Prática. 9th ed. São Paulo: Atmed.
- Maddalena R, Russell M, Sullivan DP, Apte MG. 2009. Formaldehyde and other volatile organic chemical emissions in four FEMA temporary housing units. Environ Sci Technol. 43:5626–5632.
- Madison RE, Broughton A, Thrasher JD. 1991. Immunologic biomarkers associated with an acute exposure to exothermic by-products of a urea-formaldehyde spill. Environ Health Perspect. 94:219–225.
- Mohamed AAR, Galal AA, Elewa YH. 2015. Comparative protective effects of royal jelly and cod liver oil against neurotoxic impact of tartrazine on male rat pups brain. Acta histochemica. 117:649–658.
- National Committee for Clinical Laboratory Standards (NCCLS). 2004. Methods for reticulocyte counting (automated blood cell counters, flow cytometry, and supravital dyes); approved guideline – 2nd ed. NCCLS document H44-A2 24, Vol. 8, p. 35.
- Ogasawara H, Imaida K, Ishiwata H, Toyoda K, Kawanishi T, Uneyama C, Hayashi S, Takahashi M, Hayashi Y. 1995. Urinary bladder carcinogenesis induced by melamine in F344 male rats: correlation between carcinogenicity and urolith formation. Carcinogenesis 16:2773–2777.
- Rumbeiha WK, Agnew D, Maxie G, Hoff B, Page C, Curran P, Powers B. 2010. Analysis of a survey database of pet food-induced poisoning in North America. J Med Toxicol. 6:172–184.
- Saha AK, Haque MF, Karmaker S, Mohanta MK. 2009. Anti-bacterial effects of some antiseptics and disinfectants. J Life Earth Sci. 3:19–21.
- Sandikci M, Eren U, Kum S. 2007. Effects of formaldehyde and xylene on CD4+ and CD8+ T-cells in bronchus-associated lymphoid tissue in rats. Toxicol Ind Health 23:471–477.
- Sapmaz H, Sarsılmaz M, Gödekmerdan A, Ogeturk M, Tas U, Kose E. 2015. Effects of formaldehyde inhalation on humoral immunity and protective effect of Nigella sativa oil. An experimental study. Toxicol Ind Health. [Epub ahead of print]. Available from: http://www.ncbi.nlm.nih.gov/pubmed/25653037.
- Sharma V, Srivastava A. 1990. Effect of feeding various level of formaldehyde-treated cake on rumen fermentation in buffalo. Intl J Anim Sci. 5:126–130.
- Shelton DR, Karns JS, McCarty GW, Durham DR. 1997. Metabolism of melamine by Klebsiella terragena. Appl Environ Microbiol. 63:2832–2835.
- Soliman MM, Nassan MA, Ismail TA. 2014. Immunohistochemical and molecular study of protective effect of curcumin against hepatic toxicity induced by paracetamol in Wistar rats. BMC Comp Alt Med. 14:457–464.
- Soni A, Widyarti S, Soewondo A. 2013. Study of necrosis in liver of formaldehyde- and benzo(α)pyrene-exposed mice. J Trop Life Sci. 3:58–62.
- Straková E, Karásková K, Zapletal D, Suchý P. 2014. Effect of melamine and cyanurid acid contaminated diets on blood indicators in broiler chickens. Czech J Anim Sci. 59:564–570.
- Suvarna SK, Layton C, Bancroft JD, editors. 2013. Bancroft’s theory and practice of histological techniques. 7th ed. London: Churchill Livingstone.
- Tang X, Bai Y, Duong A, Smith MT, Li L, Zhang L. 2009. Formaldehyde in China: production, consumption, exposure levels, and health effects. Environ Intl. 35:1210–1224.
- Thrasher JD, Broughton A, Madison R. 1990. Immune activation and autoantibodies in humans with long-term inhalation exposure to formaldehyde. Arch Environ Health Intl J. 45:217–223.
- Tolleson W. 2008. Renal toxicity of pet foods contaminated with melamine and related compounds. In: Al-Taher F, Jackson L, DeVries J, editors. Intentional and unintentional contaminants in food and feed. Washington (DC): ACS Publications. p. 57–77.
- Vargova, M, Wagnerova, J, Liskova, A, Jakubovsky, J, Gajdová M, Stolcová E, Kubová J, Tulinská J, Stenclová R. 1993. Subacute immunotoxicity study of formaldehyde in male rats. Drug Chem Toxicol. 16:255–275.
- Wackett LP, Sadowsky MJ, Martinez B, Shapiro N. 2002. Biodegradation of atrazine and related s-triazine compounds: from enzymes to field studies. Appl Microbiol Biotechnol. 58:39–45.
- Wang C, Qin X, Huang B, He F, Zeng C. 2010. Hemolysis of human erythrocytes induced by melamine-cyanurate complex. Biochem Biophys Res Commun. 402:773–777.
- Wang Y, Liu F, Wei Y, Liu D. 2011. Effect of exogenous melamine on rat hippocampal neurons. Toxicol Ind Health. 27:571–576.
- Wiwanitkit V. 2010. Melamine and its effect on coagulation system. Indian J Hematol Blood Transfusion 26:73–83.
- World Health Organization (WHO). 2008. WHO expert meeting to review toxicological aspects of melamine and cyanuric acid; Ottawa, Canada, Executive Summary. WHO [cited 2008 Dec 1–4]. Available from: http://www.who.int/foodsafety/fs_management/Exec_Summary_ melamine.pdf
- Yin R., Li X, Wang X, Li H, Rong L, Yin R, Liu J, Dong Q, Wang W, Yuan J, et al. 2016. The effects of melamine on humoral immunity with or without cyanuric acid in mice. Res Vet Sci. 105:65–73.
- Yin R, Liu J, Li H, Bai W, Yin R, Wang X, Wang W, Liu B, Han X, Han J, et al. 2014. Toxic effects of melamine on spleen lymphocytes with or without cyanuric acid in mice. Res Vet Sci. 97:505–513.
- Yin R, Wang X, Bai W, Wu C, Yin R, Li C, Liu J, Liu B, He J. 2013. Reproductive toxicity of melamine in the absence and presence of cyanuric acid in male mice. Res Vet Sci. 94:618–627.
- Zararsiz I, Sonmez MF, Yilmaz HR. 2006. Effects of omega-3 essential fatty acids against formaldehyde induced nephropathy in rats. Toxicol Ind Health. 22:223–229.
- Zhang Y, Liu X, McHale C, Li R, Zhang L, Wu Y, Ye X, Yang X, Ding S. 2013. Bone marrow injury induced via oxidative stress in mice by inhalation exposure to formaldehyde. PLoS One 8:e74974.
- Zheng X, Zhao A, Xie G, Chi Y, Zhao L, Li H, Wang C, Bao Y, Jia W, Luther M, et al. 2013. Melamine-induced renal toxicity is mediated by the gut microbiota. Sci Transl Med. 5:172ra22.
- Zhou W, Jiang Y, Shi H, Dai Q, Liu J, Shen C, Yang H. 2010. Characteristics of immune system changes in children who ingested melamine-contaminated powdered formula in China. Intl J Environ Health Res. 20:289–297.