Abstract
For nanotoxicology investigations of air-borne particles to provide relevant results it is ever so important that the particle exposure of, for example cells, closely resembles the “real” exposure situation, that the dosimetry is well defined, and that the characteristics of the deposited nanoparticles are known in detail. By synthesizing the particles in the gas-phase and directly depositing them on lung cells the particle deposition conditions in the lung is closely mimicked. In this work we present a setup for generation of gas-borne nanoparticles of a variety of different materials with highly controlled and tunable particle characteristics, and demonstrate the method by generation of gold particles. Particle size, number concentration and mass of individual particles of the population are measured on-line by means of differential mobility analyzers (DMA) and an aerosol particle mass analyzer (APM), whereas primary particle size and internal structure are investigated by transmission electron microscopy. A method for estimating the surface area dose from the DMA-APM measurements is applied and we further demonstrate that for the setup used, a deposition time of around 1 h is needed for deposition onto cells in an air–liquid interface chamber, using electrostatic deposition, to reach a toxicological relevant surface area dose.
Introduction
With the increasing amount of products and applications found in our everyday life based on engineered nanoparticles (Salata Citation2004; Strobel et al. Citation2006; Geranio et al. Citation2009; Geiser & Kreyling Citation2010), the concerns about possible adverse health effects of nanoparticles are being discussed intensively (Oberdorster et al. Citation2005). Not only should the final product be safe to use for consumers, but the exposure of the product to the environment (e.g. when consumers wash off sunscreens or cosmetics containing nanoparticles) should preferably be harmless. Moreover, the handling of particles during fabrication of the products should be carried out in a safe way. A potential risk during product fabrication and handling is inhalation of the nanoparticles and hence a number of in vivo studies to investigate nanoparticle toxicity for this exposure route have been performed. These studies have been implemented using different types of particle administration such as inhalation (Tran et al. Citation2000; Bermudez et al. Citation2004; Grassian et al. Citation2007; Donaldson et al. Citation2008; Yang et al. Citation2008; Koivisto et al. Citation2011) and instillation/aspiration (Miyabara et al. Citation1998; Tsurudome et al. Citation1999; Jacobsen et al. Citation2009). As a complement, in vitro studies of the nanoparticle interactions with lung cells have been carried out (Tippe et al. Citation2002; Blank et al. Citation2006; Pal et al. Citation2006; Gaschen et al. Citation2010; Ji et al. Citation2010).
For nanoparticle toxicology investigations to provide relevant results several issues need to be addressed. In vitro experiments of nanoparticle–lung cell interactions should mimic the real exposure situation. However, in most previous in vitro studies, typically performed under submerged culture conditions (Paur et al. Citation2011), the particle exposure differs significantly from the in vivo situation (Steimer et al. Citation2005; Blank et al. Citation2006; Pal et al. Citation2006; Ji et al. Citation2010; Paur et al. Citation2011). Thus, in vitro cellular systems will need further development and validation to provide useful screening data on the relative toxicity of inhaled particles (Paur et al. Citation2011; Sayes et al. Citation2007). Performing cell studies under submerged culture conditions is sufficient for many exposure scenarios and cell types, but does often not represent the true exposure situation for lung cells to non-soluble air-borne particles. For example, during dispersion of dry particles in liquid solutions it is difficult to recreate the size distribution or, for some particle types, the particle shape as it was in gas-phase (Paur et al. Citation2011; Kreyling et al. Citation2006). Also, in solution the particles may form agglomerates, further altering the physical properties, over time (Lin et al. Citation2006; Lu et al. Citation2009). These issues should also be considered in instillation/aspiration studies. Furthermore, in in vitro studies, using for example lung epithelial cells (adhered to the cell culture dish), the probability for the particles to reach the cells and thus be able to interact is determined by physical particle transport properties such as sedimentation and diffusion which are strongly particle size-dependent (Teeguarden et al. Citation2006). As a consequence, the concentration of the nanoparticles in the cell culture media might not be the most relevant dose metric for exposure and dose determination (Paur et al. Citation2011).
To better resemble the genuine exposure conditions, new methods have been developed where particles are deposited directly onto cells from the gas-borne state (Bitterle et al. Citation2006; Tippe et al. 2002; Gaschen et al. Citation2010; Paur et al. Citation2011). A recent development to these nanoparticle in vitro studies is the air–liquid interface (ALI) deposition chamber, for example described by Savi et al. (Citation2008). In this chamber nanoparticles are efficiently and evenly deposited onto lung cells at physiological (i.e. maintained temperature, pressure, and relative humidity) conditions, without altering the chemical or physical properties of the particles before contact with the thin fluid layer (<0.2 mm; Gaschen et al. Citation2010) on the cells' surface. Thus it can be argued that the changes in the particle properties upon deposition in the liquid may be representative for the in vivo situation. In addition to using relevant exposure methods, it is also of utmost importance to fully characterize the deposited particles. Several studies demonstrate that the toxicological response to a large extent depends on particle characteristics such as surface area, shape, number concentration, mass, solubility, and surface chemistry (Maynard & Kuempel Citation2005; Pal et al. Citation2006; Yang et al. Citation2008). Consequently, these features of the deposited nanoparticles must be known to enable relevant interpretation of the toxicological dose–response relationships and categorical studies of nanoparticle toxicity (Grass et al. Citation2010).
In this paper we present a thorough study of generation and thorough characterization of gas-borne nanoparticles (by spark discharge and evaporation/condensation), to be used for toxicity studies. The particle number concentration, diameter, and mass are measured on-line by differential mobility analyzers (DMA) and an aerosol particle mass analyzer (APM). From the on-line measurements, the particle number and mass concentrations are known. Combined with the particle size-dependent deposition efficiencies, doses are calculated for the in vitro ALI deposition chamber described by Savi et al. (Citation2008), here after referred to as the Bern-ALI-chamber, as well as in the alveolar region of the human lungs for exposure and inhalation studies. An approach to calculate the surface area for agglomerate particles from the DMA-APM measurements, combined with transmission electron microscopy (TEM), is applied. Agglomerates and aggregates are in this publication referred to as agglomerates, including inter-particle bond energies ranging from weak van der Waal's forces to stronger solid-state necks. In addition, we discuss the possibilities of using the setup to produce and deposit nanoparticles of a wide variety of materials without using precursors or additives that can alter their surface chemistry and apparent toxicity. This feature may also be useful for deposition into biological fluids for particle–protein interaction studies and agglomeration/deagglomeration studies upon deposition in biological liquids. Furthermore, nanoparticles of the same number concentration, mass and material but with different surface area can be generated and deposited, hence allowing for direct comparisons of single particle characteristics on the toxicological response.
Experimental methods
Nanoparticle generation and characterization
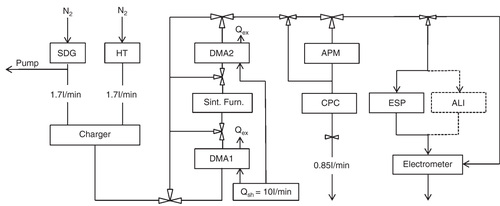
An aerosol nanoparticle (i.e. a gas-borne nanoparticle) generation setup () was used for nanoparticle production, thorough characterization and deposition. The nanoparticles were generated either by evaporation/condensation in a high temperature (HT) furnace (Magnusson et al. Citation1999) or by spark discharge in a spark discharge generator (SDG) (Schwyn et al. Citation1988; Messing et al. Citation2009). In the HT furnace, a bulk piece of the desired particle material is placed inside a graphite tube and heated to elevated temperatures causing the material to vaporize. When the vapor is transported away from the furnace and cooled, primary particles are formed by homogenous nucleation of the evaporated material. The primary particles, small compact particles with diameters of a few nm and a homogenous atomic structure coagulate into chain-like agglomerate particles. By adjusting the temperature of the HT furnace, the primary particle size (Scheibel & Porstendörfer Citation1983) as well as the number concentration and diameter of the agglomerate particles can be tuned (Magnusson et al. Citation1999).
Figure 1. Schematic of the measurement/deposition setup.
The mechanism behind particle generation using the SDG is similar to the one described for the HT furnace based on evaporation and condensation of bulk material. In the SDG (Palas, model GfG 1000) material is evaporated from two opposing conducting electrodes, of the desired particle material (Helsper et al. Citation1993). One of the electrodes is connected to a capacitor charged by a high voltage supply with adjustable output current. When the breakdown voltage of the electrode gap is reached the capacitor will discharge in a spark between the two electrodes, resulting in evaporation of electrode material. Also in this case primary particles will form upon cooling of the vapor and coagulate into chain-like agglomerate particles (Schwyn et al. Citation1988). To affect particle characteristics, the spark discharge frequency can be varied between 0 and 300 Hz and the carrier flow rate of the transport gas can be varied between approximately 2 and 8 l/min.
Ultra-pure nitrogen gas was used to transport the as-produced agglomerate particles through the entire system at a carrier flow rate of 1.7 l/min. The nitrogen gas can easily be replaced by other gases, such as argon, air, hydrogen or mixtures thereof. Use of nitrogen is motivated by its relatively low price and beneficial properties if high purity and cleanliness are important parameters for the particle production. Following particle generation, the agglomerate particles were fed through a β-emitting 63Ni source to achieve a reproducible bipolar charge-distribution on the particles (Wiedensohler 1988), enabling size-selection by a differential mobility analyzer (DMA). The DMA, a standard instrument in aerosol science, size-classifies charged particles according to their mobility inside an electric field (Knutson & Whitby Citation1975). Knowing the charge distribution of the particles, the particle mobility can be related to the particle mobility diameter, dm , which for spherical particles is equal to the geometrical particle diameter. The mobility diameter has been shown to well describe the lung deposition of particles of the present size range, regardless of shape (Rissler et al., 2012). An agglomerate particle can be transformed (sintered) by heating into a compact spherical-like particle (Magnusson et al. Citation1999). Then the mobility diameter might decrease substantially due to the reduced drag force (increased mobility) of spherical particles compared to agglomerates, although the mass of the particles remains. This is important to consider as diffusional and electrostatic deposition mechanisms of nanoparticles (<100 nm) are essentially determined by mobility diameter.
As displayed in , the aerosol nanoparticle system setup consists of two DMAs with a sintering furnace in-between. DMA 1 was a long column TSI DMA; (DMA 1: inner radius: 9.37 mm, outer radius: 19.61 mm, length: 443.69 mm, operating at an aerosol/sheath gas flow rate of 1.7/10 l/min) and DMA2 was a Vienna type DMA (DMA 2: inner radius: 25.0 mm, outer radius: 33.0 mm, length: 110.0 mm, operating at an aerosol/sheath gas flow rate of 1.7/10.0 l/min). The sintering furnace is used to reshape the agglomerate particles into more compact particles. The design of the system allows bypassing of both DMAs and the furnace or of any one of these devices, permitting generation/deposition of either agglomerate or sintered particles as well as of either a poly-disperse (a distribution of diameters) or a mono-disperse (one diameter) particle fraction.
At the end of the aerosol nanoparticle system setup the particle flow was divided into two routes. Half of the particle flow (route 1), 0.85 l/min, was fed through the aerosol particle mass analyzer (APM, model 3600, KANOMAX) and the condensation particle counter (CPC, model 3010, TSI Inc.), and the other half (route 2) was fed either through the electrometer or the electrostatic precipitator (ESP). Particle size distribution measurements were carried out by passing the freshly formed particles through the bipolar charger, the DMA and the electrometer in a Differential Mobility Particle Sizer set-up (DMPS). The electrometer was used to measure particle concentrations. By stepwise changing the voltage of the first or second DMA and measuring the resulting particle concentration, size distribution measurements of the agglomerate and reshaped particles respectively were obtained. The measured data were inverted taking into account the particle charge distribution (Wiedensohler Citation1988) and diffusion losses in the DMA.
In the APM, particle mass is measured on-line by introducing the particles in a gas-flow between two concentric rotating cylinders with an applied electric field between the two cylinders (Ehara Citation1996). Only particles of a certain specific mass, for which the electrical force equals the centrifugal force, will pass the APM. The CPC placed after the APM is used to count the number of particles passing the APM by evaluating the scattered light from each particle (Agarwal & Gilmore Citation1980). By coupling the APM in series downstream the DMA, the mass of individual particles in a population of a selected dm
, (mAPM
(dm
)) is determined (McMurry et al. Citation2002), allowing the determination of the particle effective density,, as
The DMA-APM does not measure particles one by one, but still the individual mass of agglomerates in a population. In several previous studies, it was shown that the relation between dm and the mass of agglomerate particles often is well described by a power law function (McMurry et al. Citation2002; Sorensen 2011; Rissler et al. Citation2012), which was the case also in this study. Thus, the agglomerate effective density and dm is also described by a power law function as:
where εm is the mass mobility exponent (Rissler et al. Citation2012; Sorensen 2011). For APM measurements particles with mobility diameters of 15, 20, 40, 60 and 80 nm were used, essentially covering the number size distributions generated. This is the first study where this type of APM is used for these small particles. However, Tajima et al. (Citation2011) recently demonstrated that the APM technique in principle can be used at particle sizes down to 20 nm. The DMA-APM characterization and results will be described in more detail in a future publication. The DMA-APM was calibrated using a density standard, as described by McMurry et al. (Citation2002).
Particles were deposited onto lacey carbon film Cu TEM grids placed inside the ESP. The ESP focuses charged particles onto a collector electrode (Deppert et al. Citation1996) and enables a high-efficiency (almost 100 % for particles with diameters below 100 nm) deposition of particles. The setup used allows for deposition of particles with diameters of up to 150 nm onto a spot of about 1–4 cm in diameter. A TEM (JEOL, model 3000F) equipped with a field emission gun and operated at 300 kV was used to investigate particle morphology and primary particle size. A minimum of 200 primary particles from each sample were analyzed, using the software “ImageJ” (Image Processing and Analysis in Java), to determine the average primary particle size. Gold was the material of choice to demonstrate the capabilities of the above-described system since gold nanoparticles are relatively non-reactive and hence a good model system. Furthermore, the toxicity of gold nanoparticles is under debate. Some reports claim that gold nanoparticles are not cytotoxic (Connor et al. Citation2005; Sadauskas et al. Citation2007) and others exhibit noticeable toxicity (Pernodet et al. Citation2006; Balasubramanian et al. Citation2010). Gold nanoparticles were generated using two different settings for the HT furnace, namely 1575°C and 1625°C, and two different settings for the SDG, namely carrier flow rates of 2.9 and 3.7 l/min and a spark discharge frequency of 300 Hz for both carrier flow rates.
Nanoparticle dose calculations
Number, surface area, and mass dose concentrations were calculated as described below. The doses were calculated for deposition using the Bern-ALI deposition chamber (Savi et al. Citation2008) and the alveolar region of the lungs. The ALI chamber consists of a number of inserts where cell cultures are directly grown on a thin membrane. The gas-borne particles are directed onto the cells, and the cells are then exposed to the particles by means of electrostatic deposition (Savi et al. Citation2008). For dose calculations in the Bern-ALI deposition chamber, a filter insert area of 4.52 cm2, a flow rate of 50 cm3/min per filter insert and a size-dependent deposition probability modeled by Savi et al. (Citation2008) were used. For dose calculations in the alveolar region, an area of 75 m2, an average breathing flow rate of 6 l/min, and the deposition probability in the alveolar region according to the ICRP model (International Commission of Radiological Protection [ICRP]) (Bailey Citation1994) was used (for sitting man and woman, functional reserve capacity: 2.99 L, frequency: 13 breaths/min, tidal volume: 0.605 L).
The mass doses were calculated directly from the measured data, using the empirically determined effective density (described in section “Nanoparticle generation and deposition” above) and measured number concentrations, combined with the size-dependent deposition pattern in either the Bern-ALI-chamber or the pulmonary region of the human respiratory tract. Mass and surface area concentrations per volume unit of air (units mg/m3 and cm2/m3) and per area of cell monolayer (cm2/cm2 and mg/cm2) were calculated. Size-resolved agglomerate specific surface area (total surface area per unit of mass, given in m2/g) were calculated using three different approaches, namely the mobility diameter (dme) approach, the idealized aggregate theory (IA) approach, and the DMA-APM approach. To allow comparison between the approaches, specific surface areas were in all three cases calculated using the mass determined with APM at the given size (mAPM ). The total mass over the distributed from DMPS and the DMA-APM (mtot ) are described later in this section.
In the dme approach, the particles are assumed to be spherical with a geometrical diameter equal to the measured mobility diameter, dm . This is a suitable approach for reshaped compact particles but is less suitable for large agglomerate particles with low effective densities. The surface area of an agglomerate of a given dm , Sdme , (m2) is then given by
The IA approach, described in detail by Lall et al. (Citation2008), calculates the volume of the agglomerate particles, vagg , from the radius of the primary particles (measured by TEM) combined with the mobility diameter of the individual agglomerate particles, by:
where λ is the mean free path of the carrier gas, dpp is the diameter of the primary particles, C(dm ) is the slip correction factor, and c* is the dimensionless drag force. For randomly oriented particles c* is equal to 9.17 (Lall et al. Citation2006), whereas for particles oriented parallel to their relative motion with respect to the gas flow c* is equal to 6.62 (Lall & Friedlander Citation2008). For field strengths below 200 kV/m-1 particles are oriented randomly in the DMA, according to Kousaka et al. (Citation1996). This applies to the majority of the experiments in this paper. Therefore, randomly oriented particles have been assumed. The number of primary particles per agglomerate, NIA , is then given by:
where vpp is the volume of the primary particles. The surface area of an agglomerate particle of a given dm , SIA , is then given by:
In the IA approach it is assumed that the mobility diameter can be calculated by adding up the drag forces of each primary particle in the whole agglomerate, thereby estimating the number of primary particles. From the number of primary particles, assuming point contact between the primaries, the surface area of the agglomerate particle is estimated by summing the contribution from each primary particle. In this model, the shielding and necking effect by neighboring primary particles within the agglomerate particle is neglected. Neglecting the shielding effect will lead to an underestimation of the number of primary particles. This underestimation will be larger for larger agglomerates since the effect of shielding will increase with the number of primary particles.
In the DMA-APM approach, the number of primary particles in each agglomerate is estimated from the direct measurements of agglomerate mass (mAPM ), dpp (determined from TEM) and the crystal density of the particle material (gold). The number of primary particles in each individual agglomerate (NAPM ) is then given by
where magg is the mass of the individual agglomerate, mpp the mass of the primary particle, and ρpp the crystal density of the primary particles.
The surface area, SAPM , is then given by
Also in this approach point contact is assumed between the primary particles in the agglomerate, thus necking between primary particles is neglected.
By combining the size resolved surface area or mass distributions of the agglomerates and the size-dependent deposition probability, the total mass or surface area dose to the lung or the cells are estimated. The total mass concentration (and surface area using a similar relation) can be determined from DMPS and DMA-APM according to (where N agg is the number of agglomerates measured by DMPS):
The total mass could also be used from gravimetric analysis, Tapered Element Oscillating Microbalance (TEOM) or other techniques, which ideally would not affect the result. If instead estimating the total mass from measured number size distributions assuming spherical particles, or from using the IA approach, errors will be introduced for agglomerated particles.
Particle number concentrations, mass concentrations, and primary particle size
Particle production by the SDG and the HT furnace were both found to be stable and robust methods and a summary of number, mass and surface area concentrations on generation method/settings is displayed in . For the explored generation parameters, the particle number concentration, the mass concentration and the size of the primary particles differs significantly between the two methods (). In general, the HT method generates a broader size distribution of particles compared to the SDG method. The different carrier gas flow settings of 2.9 and 3.7 l/min for the SDG results in almost identical particle number concentrations with a geometric mean mobility diameter (GMD) around 20 nm, with a geometric standard deviation (GSD) of 1.6. However, the GMD is shifted to 32 and 48 nm (GSD of 1.8 and 1.6) for the HT-generated particles at 1575 and 1625°C respectively. In addition, the total number concentration of particles decreases from 2 × 10⁸ particles/cm3 for the SDG to around 1 × 10⁸ particles/cm3 for the HT-generated particles.
Figure 2. (a) Number-weighted size distributions and (b) mass-weighted size distributions of the particles generated by the HT furnace and the SDG at the different settings.
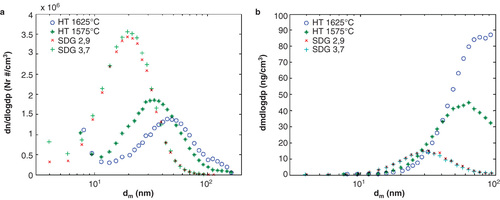
Table I. Summary of particle characteristics for the different generation methods and settings.
For the mass concentrations, the two different SDG settings give similar distributions with a total mass concentration of approximately 7 mg/m3. The total mass concentrations for the HT particles are 27 and 49 mg/m3 for particles generated at 1575 and 1625°C respectively. It should be noted that a much higher mass concentration than for the SDG particles was obtained with the HT method although the total particle number concentration was significantly lower.
It is expected that the two different settings for the SDG results in similar particle number concentration distributions and hence particle mass concentration distributions. In previous investigations it has been demonstrated that the carrier gas flow rate might affect particle distributions to some extent, but that varying the spark discharge frequency has a greater impact on particle size and number concentration (Schwyn et al. Citation1988; Helsper et al. Citation1993; Evans et al. 2003a; Messing et al. Citation2009; Tabrizi et al. 2009a). Since a decrease in spark discharge frequency would lead to a decrease in both particle number and mass concentration the use of higher frequencies, resulting in shorter cell-exposure times, is preferable for toxicological studies.
In contrast to the effect of carrier gas flow rate for the SDG, the temperature of the HT furnace had a noticeable effect on particle production. Increasing the furnace temperature by 50°C resulted in a clear shift of the particle distribution toward particles with larger mobility diameters. The shift in mass size distributions toward a higher total mass concentration was also pronounced. The mass shift can be explained mainly by the shift in the number size distributions toward a higher concentration of larger particles and partly by a larger primary particle size. It should be noted that by further increasing the temperature of the HT furnace, higher particle number concentrations can be obtained (Magnusson et al. Citation1999), also leading to a significant increase in mass concentrations.
The mean diameter of the SDG primary particles was measured from TEM images to 5.1 and 5.5 ± 1.3 nm (1 standard deviation) for the 2.9 and 3.7 l/min setting respectively. The mean primary particle diameter was slightly larger for the HT-generated primary particles, namely 6.7 and 6.9 ± 1.3 nm for 1575 and 1625°C respectively. A reason for the difference in primary particle size between the two different generation methods might be a different size, geometry, and temperature profile for the SDG chamber compared to the HT furnace leading to different time scales when the primary particles are allowed to grow in size and to different amount of evaporated material (Nakaso et al. Citation2002).
Particle surface area
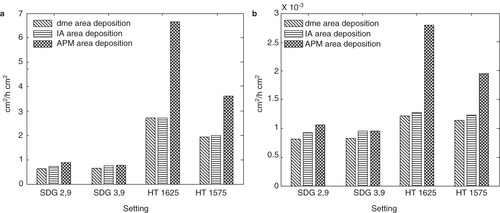
From the measured mobility diameter and primary particle size, the surface area concentration was modeled using the dme approach (not using dpp ), the IA approach and the DMA-APM approach (). In line with the measured particle number and mass concentration for SDG particles, also the surface area concentration is similar for the two different settings regardless of approach. The total surface area concentration in the gas-phase is found to be around 0.3 × 10⁻⁶, 0.4 × 10⁻⁶, and 0.4 × 10⁻⁶ m2/cm3 according to the dme, the IA and the DMA-APM approach respectively. Turning to the HT-generated particles, a larger difference is observed between the two different settings, as well as when compared to SDG. For both temperatures the total surface concentration is higher than for the SDG particles, and is around 0.7 × 10⁻⁶, 0.7 × 10⁻⁶ and 1 × 10⁻⁶ m2/cm3 for 1575°C and 0.9 × 10⁻⁶, 0.9 × 10⁻⁶ and 2 × 10⁻⁶ m2/cm3 for 1625°C, according to the dme, the IA and the DMA-APM approach respectively. In , the specific surface area is shown. It can be clearly seen that the SDG particles have a higher specific surface area than the HT-generated particles, suggesting that the SDG agglomerates are less compact than the HT-generated agglomerates, which will be discussed below.
Figure 3. Size-resolved specific surface area according to the dme, the IA and the DMA-APM approach for (a) SDG particles generated at a carrier flow rate of 2.9 l/min, (b) SDG particles generated at a carrier flow rate of 3.7 l/min (c) HT particles generated at 1575°C and (d) HT particles generated at 1625°C.
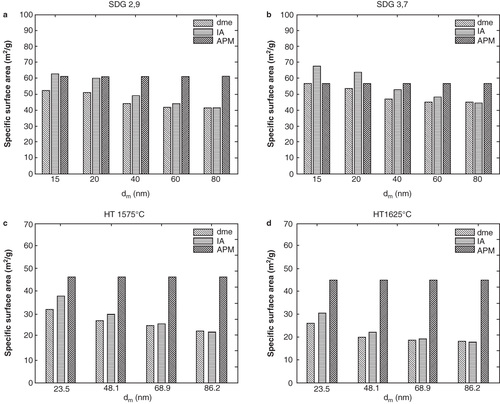
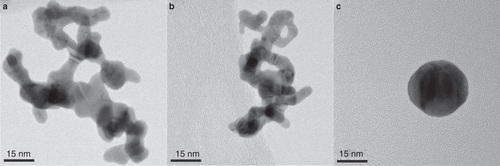
For both methods and all settings the lowest total surface area was given by the dme approach, which is not surprising. The dme approach is fairly simple and commonly used but to some extent underestimates the surface area of agglomerate (chain-like) particles since it assumes that the mobility diameter is equal to the geometrical diameter of a spherical particle, of the same dm . The larger the agglomerate particles, the larger the underestimation. As can be clearly seen in , displaying an agglomerate particle before and after sintering, this assumption is far from true for agglomerate particles. A more realistic surface area is therefore obtained by using the IA or DMA-APM approach. There is a fairly good agreement comparing the surface area obtained by these two different methods for the smaller agglomerates. However for the larger agglomerates, and especially for the HT-generated particles, the IA approach provides results more similar to the ones obtained by the dme approach. The reason for the difference between smaller and larger particles is that in the IA approach the number of primary particles in each agglomerate is estimated from the agglomerate particle mobility diameter (i.e. from the drag force), assuming no shielding effect of the neighboring primary particles in the agglomerate. This results in an underestimation of the number of primary particles especially for larger agglomerates (as in the case of the HT-generated particles) which in turn leads to an underestimation of surface area and mass. In addition, a more detailed analysis of the DMA-APM data (in preparation), shows that the degree of shielding is substantially larger for HT-generated particles compared to that for SDG particles. This explains why the surface area based on the IA approach may be significantly underestimated for the HT-generated particles. On the other hand, the surface area might be overestimated by the DMA-APM approach if there is substantial necking between the primary particles in the agglomerates. It should also be noted that when using the c* value corresponding to agglomerates aligned in the electric field in the DMA, the IA surface area becomes closer to the APM surface area. It might be that the larger particles (that are exposed to a larger field strength in the DMA) are not completely randomly oriented so a c* value in between the two extremes may be more suitable. It is likely that the DMA-APM approach provides a more accurate measurement of surface area compared to the IA approach, since the particle mass is directly measured which leads to fewer assumptions in the surface area estimations.
Figure 4: TEM images of (a) an HT-generated agglomerate particle with a mobility diameter of 60 nm, (b) an SDG agglomerate particle with a mobility diameter of 60 nm and (c) an SDG particle with an original mobility diameter of 60 nm (compare to B) that has been sintered at 700°C which reduced the mobility diameter to 31 nm. The individual mass of particles in the population of SDG particles (b, c) was the same before and after sintering (0.24 fg) while the individual mass of particles in the population of the HT agglomerates at dm = 60 nm was 0.59 fg.
The conventional method for investigating the nanoparticle surface area is by BET measurements (Brunauer et al. Citation1938). This is done by collecting a large number of particles; typically, a total surface area of 10 m2 is needed (Sheffield & Pankow Citation1994; LeBouf et al. Citation2011). The major drawbacks of the BET method compared to the one described above is that it is extremely time consuming (around 2 weeks of deposition for the generators used in this study) which leads to low time resolution of the data. Furthermore, no resolution in size is provided and the measurement is not performed on-line, leading to a discussion of effects from agglomeration after collecting the particles.
Another relatively new method to measure the surface area is by analyzing TEM images (Bau et al. Citation2010). This is also an off-line technique but much less material is required which allows for much shorter deposition times. On the other hand, TEM analysis itself is reasonably time consuming. Compared to both these techniques, the DMA-APM approach is highly advantages since it provides on-line measurements and a fast analysis.
A few on-line measurement techniques to determine particle surface area have been reported. The “active” surface area can be determined using a diffusion charger (DC). The advantage is that the DC is a relatively cheap instrument with high time resolution and the measurement does not require any off-line information from, for example, TEM (Ntziachristos et al. Citation2004; Giechaskiel et al. Citation2009). The disadvantage with the DC method is that the active surface area does not have a physically correct size dependence for a surface area measurement even for spheres. The exponent is typically proportional to dm 1.4 at 100–200 nm and relies on calibration in the same size range as used. Another commonly used online monitor is the Nanoparticle Surface Area Monitor (NSAM) (Asbach et al. Citation2009) which measures the lung-deposited surface area particle concentration. This has been shown up to about 300 nm for spheres but remains to be shown for agglomerates. The surface area of agglomerate particles can be measured by the Universal NanoParticle Analyzer (UNPA), but it requires agglomerate particles with equally sized loosely bonded primary particles (Wang et al. Citation2010). Nevertheless, we believe that the methods presented in our study are more direct than many other techniques used for determining the surface area of agglomerate particles.
Particle sintering, effective density, and material
A further key aspect of this setup, in addition to the detailed on-line measurements, is the possibility to use a sintering furnace to reshape the as-produced agglomerate particles. The typical morphology of agglomerate particles is shown in (HT furnace) and (SDG). The agglomerates are composed of small primary particles connected in a chain-like structure and hence have large surface areas.
An obvious difference with respect to sintering between the HT-generated and the SDG particles was observed. The SDG agglomerate particles undergo a larger diameter decrease upon sintering compared to the HT-generated particles, which have been reported earlier (Messing Citation2009). This is also reflected in the effective density (), and the parameterization parameters is given in , using the equation for effective density described in the section about nanoparticle generation and characterization. The SDG agglomerate particles show a lower effective density than the HT generated agglomerates. That is, agglomerate HT particles of a given mobility diameter have a larger mass than SDG agglomerates with the same mobility diameter. Part of this is explained by the smaller primary particles for the SDG particles leading to more porous particles. One additional possible explanation for this might be that the HT-generated agglomerate particles have been partly sintered already in the generation furnace or that they have a higher purity which makes them sinter more easily already at room temperature (Tabrizi et al. 2009a).
Table II. Parameters describing the effective density (units in nm and g/cm3) measured by the DMA-APM system.
Figure 5. The effective density as a function of mobility diameter of the SDG and HT-generated gold particles.
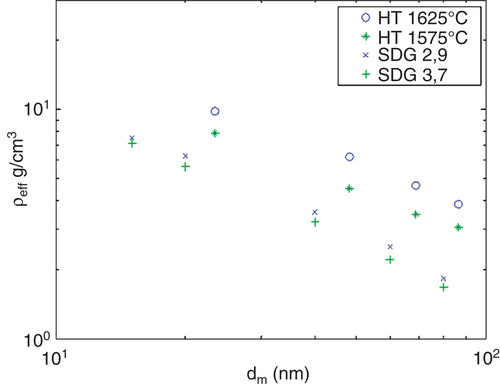
In , a SDG particle with a mobility diameter of 60 nm that have been sintered at 700°C and therefore reduced its mobility diameter to 31 nm is displayed. In this case, the mobility diameter corresponds well to the geometrical diameter of the particle since it is essentially spherical. APM measurements confirm that the mass of the particle has not changed upon sintering and still remains the same as for the agglomerate particle. However, the surface area has decreased by about a factor of 6. By using the sintering furnace, the same number concentration of particles with the same mass but clearly different surface area can be used in toxicological studies (for deposition onto cells in an ALI-chamber or for inhalation studies). This provides for a direct comparison of toxicological response upon variations in surface area, a particle property that is believed to play a major role in nanoparticle toxicity (Tran et al. Citation2000; Stoeger et al. Citation2006; Oberdorster et al. Citation2007).
Another important aspect of the setup, especially if the SDG is used, is the possibility to reasonably easily produce particles of different materials, although some adjustment with respect to production parameters needs to be adjusted to ensure optimum production of each material. A number of different particle types have been produced by solely replacing the electrodes in the SDG generator with electrodes of the desired particle material, including metal, mixed metal and metal oxide particles (Evans et al. Citation2003a; Roth et al. Citation2004; Tabrizi et al. 2009b; Messing et al. Citation2010), TiO2 particles (Kreyling et al. Citation2011) and soot particles (Evans et al. Citation2003b; Roth et al. Citation2004) among others. This provides for deposition of different nanomaterials while maintaining size and nanostructural characteristics of the nanoparticles. This in turn provides for a direct toxicological comparison of different materials on the nanometer scale, when all of the typical size effects found on this scale can be set to the same values.
Particle dosimetry for toxicology studies
For a particle generation method to be useful in nanotoxicology studies not only must the important particle characteristics be well controlled, the concentration of particles must also be high enough to get reasonably short exposure times (hourly time scale). It has been shown both in vivo and in vitro (living rats and A549 epithelial cells in conventional in vitro setups) using low toxicity and low soluble particles that approximately 1–2 cm2 particle surface area per cm2 cell surface area is required to trigger inflammatory onset (Donaldson et al. Citation2008). Possibly the ALI exposure systems may be sensitive to lower doses, however that is not well known at the time of writing. As can be clearly seen in and , mass and surface area dosages of these values can be reached in the Univ. Bern ALI chamber (Savi et al. Citation2008) here used as an example, within 1–2 h of deposition, depending on settings used. Since the described system has proven to generate and characterize particles on-line in a stable manner for up to several days, it seem highly suitable to use for particle deposition onto cells directly from the gas-phase.
Figure 6. The modeled particle mass dosages (per cell surface area) compared to the theoretical maximum mass dosages (assuming a 100 % deposition probability) for (a) the ALI chamber (b) the alveolar region in the lungs.
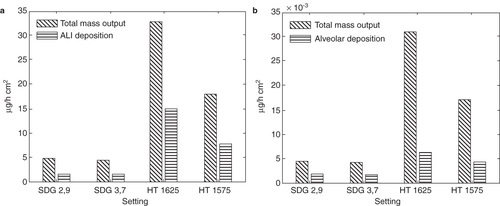
Figure 7. The modeled surface area dosages (per cell surface area) compared to the theoretical maximum surface area dosages (assuming a 100% deposition probability) for (a) the ALI chamber (b) the alveolar region in the lungs.
Turning to and displaying the mass and surface area dosages for deposition in the alveolar region of humans, the dosages are well below the reported values needed to cause an inflammatory response. The main idea of in vitro systems is to accelerate a process that might take days to month to years in the body, to look at acute effects, and to reach a measurable level of inflammatory markers. Furthermore, it is possible that lower particle levels, not measurable by the commonly used biomarkers and analysis methods used today, have an impact on health. If desired, using the HT furnace, the particle number concentration and particle mass, and hence also the surface area, can be increased by increasing the temperature (Magnusson et al. Citation1999). Therefore, the described setup might also be interesting for animal inhalation studies, although prolonged deposition times needs to be used. Rodent inhalation studies of TiO2 nanoparticles produced by a spark discharge generator have been reported (Geiser et al. Citation2005) even though quite low particle dosages were used. One promising way of increasing the amount of produced material by the SDG is to create a generator where several electrode pairs are connected in parallel (Meuller et al. Citation2012). When this is realized, generation of higher mass and surface area dosages suitable for animal inhalation studies might easily be produced within a reasonable time-frame.
Finally, investigations (which will be presented in a separate report) of depositions of the as-produced gold particles into protein solutions, for protein corona studies, further demonstrate the capability of the reported setup.
Conclusions
Achieving a better understanding of the toxicology of inhaled nanoparticles and learning how to handle them in a safe way is crucial, since the number of nanoparticle-based products and applications are rapidly increasing on the market. In order for nanotoxicological studies to be of relevance, the properties of the investigated particles during exposure need to be fully known. In this article, we have reported on a stable method to generate and in detail characterize airborne nanometer-sized particles. Particle number concentration, particle number size distributions, and the mass of individual particles are measured on-line. From TEM imaging combined with the on-line measurements we apply three models for calculating the surface area, which is of relevance for nanoparticle toxicity. Furthermore, calculating the deposited mass and surface area dosages demonstrate that using this setup, deposition times as short as 1 h are needed to reach dosages reported to cause an inflammatory onset, when depositing the particles directly onto cells placed in the Bern-ALI exposure chamber (or other types of exposure chambers with similar or higher particle deposition efficiency). The three main advantages of the setup are the possibility to deposit either a poly- or mono-disperse fraction of particles, to sinter the particles, and to easily produce particles of different materials. Sintering of the particles allows for a comparison of the dependence of the toxicological response on the surface area, when using particles of the same mass and number concentration. The simplicity by which particles of different materials are produced provides the possibility to directly compare the effect of nanoparticle material, when all other size-related parameters are chosen to be the same.
Declaration of interest
The authors report no conflicts of interest. The authors alone are responsible for the content and writing of the paper.
Acknowledgements
This work was performed within the Nanometer Structure Consortium at Lund University (nm@LU) and supported by the Swedish Council for Working Life and Social Research (FAS) through project 2009-1291, FORMAS through projects 216-2009-1294 and 2008-1467, the Swedish Governmental Agency for Innovation Systems VINNOVA through project 2009-01117, and the FAS-centre METALUND.
References
- Agarwal JK, Gilmore JS. 1980. Continuous flow single particle counting condensation nucleus counter. J Aerosol Sci 11:343–357.
- Asbach C, Fissan H, Stahlmecke B, Kuhlbusch TAJ, Pui DYH. 2009. Conceptual limitations and extensions of lung-deposited Nanoparticle Surface Area Monitor (NSAM). J Nanopart Res 11:101–109.
- Bailey MR. 1994. The new ICRP model for the respiratory tract. Radiat Prot Dosim 53:107–114.
- Balasubramanian SK, Jittiwat J, Manikandan J, Ong CN, Yu LE, Ong WY. 2010. Biodistribution of gold nanoparticles and gene expression changes in the liver and spleen after intravenous administration in rats. Biomaterials 31:2034–2042.
- Bau S, Witschger O, Gensdarmes F, Rastoix O, Thomas D. 2010. A TEM-based method as an alternative to the BET method for measuring off-line the specific surface area of nanoaerosols. Powder Technol 200:190–201.
- Bermudez E, Mangum JB, Wong BA, Asgharian B, Hext PM, Warheit DB, 2004. Pulmonary responses of mice, rats, and hamsters to subchronic inhalation of ultrafine titanium dioxide particles. Toxicol Sci 77:347–357.
- Bitterle E, Karg E, Schroeppel A, Kreyling WG, Tippe A, Ferron GA, 2006. Dose-controlled exposure of A549 epithelial cells at the airliquid interface to non-soluble air-borne ultrafine carbonaceous particles. Chemosphere 65:1784–1790.
- Blank F, Rothen-Rutishauser BM, Schurch S, Gehr P. 2006. An optimized in vitro model of the respiratory tract wall to study particle cell interactions. J Aerosol Med 19:392–405.
- Brunauer S, Emmet PH, Teller E. 1938. Adsorption of gases in multimolecular layers. J Am Chem Soc 60:309–319.
- Connor EE, Mwamuka J, Gole A, Murphy CJ, Wyatt MD. 2005. Gold nanoparticles are taken up by human cells but do not cause acute cytotoxicity. Small 1:325–327.
- Deppert K, Schmidt F, Krinke T, Dixkens J, Fissan H. 1996. Electrostatic precipitator for homogeneous deposition of ultrafine particles to create quantum-dot structures. J Aerosol Sci 27:S151–S152.
- Donaldson K, Borm PJA, Oberdörster G, Pinkerton KE, Stone V, Tran CL. 2008. Concordance between in vitro and in vivo dosimetry in the proinflammatory effects of low toxicity low soluble particles: the key role of the proximal alveolar region. Inhal Toxicol 20:53–62.
- Ehara K, Hagwood C, Coakley KJ. 1996. Novel method to classify aerosol particles according to their mass-to-charge ratio – aerosol particle mass analyzer. J Aerosol Sci 27:217–234.
- Evans DE, Harrison RM, Ayres JG. 2003a. The generation and characterization of metallic and mixed element aerosols for human challenge studies. Aerosol Sci Technol 37:975–987.
- Evans DE, Harrison RM, Ayres JG. 2003b. The generation and characterisation of elemental carbon aerosols for human challenge studies. J Aerosol Sci 34:1023–1041.
- Gaschen A, Lang D, Kalberer M, Savi M, Geiser T, Gazdhar A, 2010. Cellular responses after exposure of lung cell cultures to secondary organic aerosol particles. Environ Sci Technol 44:1424–1430.
- Geiser M, Kreyling WG. 2010. Deposition and biokinetics of inhaled nanoparticles. Part Fibre Toxicol 7:2.
- Geiser M, Rothen-Rutishauser B, Kapp N, Schurch S, Kreyling W, Schulz H, 2005. Ultrafine particles cross cellular membranes by nonphagocytic mechanisms in lungs and in cultured cells. Environ Health Persp 113:1555–1560.
- Geranio L, Heuberger M, Nowack B. 2009. The behavior of silver nanotextiles during washing. Environ Sci Technol 43:8113–8118.
- Giechaskiel B, Alföldy B, Drossinos Y. 2009. A metric for health effects studies of diesel exhaust particles. J Aerosol Sci 40:639–651.
- Grass RN, Limbach LK, Athanassiou EK, Stark WJ. 2010. Exposure of aerosols and nanoparticle dispersions to in vitro cell cultures: a review on the dose relevance of size, mass, surface and concentration. J Aerosol Sci 41:1123–1142.
- Grassian VH, O'Shaughnessy PT, Adamcakova-Dodd A, Pettibone JM, Thorne PS. 2007. Inhalation exposure study of titanium dioxide nanoparticles with a primary particle size of 2 to 5 nm. Environ Health Perspect 115:397–402.
- Helsper C, Mölter W, Löffler F, Wadenpohl C, Kaufmann S, Wenninger G. 1993. Investigations of a new aerosol generator for the production of carbon aggregate particles. Atmos Environ 27A:1271–1275.
- Jacobsen NR, Møller P, Jensen KA, Vogel U, Ladefoged O, Loft S, 2009. Lung inflammation and genotoxicity following pulmonary exposure to nanoparticles in ApoE (-/-) mice. Part Fibre Toxicol 6:2.
- Ji ZX, Jin X, George S, Xia TA, Meng HA, Wang XA, 2010. Dispersion and stability optimization of TiO2 nanoparticles in cell culture media. Environ Sci Technol 44:7309–7314.
- Knutson EO, Whitby KT. 1975. Aerosol classification by electric mobility: apparatus, theory, and applications. J Aerosol Sci 6:443–451.
- Koivisto AJ, Makinen M, Rossi EM, Lindberg HK, Miettinen M, Falck GCM, Norppa H, Alenius H, 2011. Aerosol characterization and lung deposition of synthesized TiO2 nanoparticles for murine inhalation studies. J Nanopart Res 13:2949–2961.
- Kousaka Y, Endo Y, Ichitsubo H, Alonso M. 1996. Orientation-specific dynamic shape factors for doublets and triplets of spheres in the transition regime. Aerosol Sci Technol 24:36–44.
- Kreyling WG, Biswas P, Messing ME, Gibson N, Geiser M, Wenk A, 2011. Generation and characterization of stable, highly concentrated titanium dioxide nanoparticle aerosols for rodent inhalation studies. J Nanopart Res 13:511–524.
- Kreyling WG, Semmler-Behnke M, Moller W. 2006. Ultrafine particle-lung interactions: does size matter? J Aerosol Med 19:74–83.
- Lall AA, Friedlander SK. 2006. On-line measurement of ultrafine aggregate surface area and volume distributions by electrical mobility analysis: I. Theoretical analysis. Aerosol Sci 37:260–271.
- Lall AA, Rong W, Mädler L, Friedlander SK. 2008. Nanoparticle aggregate volume determination by electrical mobility analysis: Test of idealized aggregate theory using particle mass analyzer measurements. J Aerosol Sci 39:403–417.
- LeBouf RF, Ku BK, Chen BT, Frazer DG, Cumpston JL, Stefaniak AB. 2011. Measuring surface area of airborne titanium dioxide powder agglomerates: relationships between gas adsorption, diffusion and mobility-based methods. J Nanopart Res 13:7029–7039.
- Lin W, Huang Y-w, Zhou X-D, Ma Y. 2006. In vitro toxicity of silica nanoparticles in human lung cancer cells. Toxicol Appl Pharm 217:252–259.
- Lu S, Duffin R, Poland C, Daly P, Murphy F, Drost E, 2009. Efficacy of simple short-term in vitro assays for predicting the potential of metal oxide nanoparticles to cause pulmonary inflammation. Environ Health Perspect 117:241–247.
- Magnusson MH, Deppert K, Malm J–O, Bovin J–O, Samuelson L. 1999. Gold nanoparticles: Production, reshaping, and thermal charging. J Nanopart Res 1:243–251.
- Maynard AD, Kuempel ED. 2005. Airborne nanostructured particles and occupational health. J Nanopart Res 7:587–614.
- McMurry PH, Wang X, Park K, Ehara K. 2002. The relationship between mass and mobility for atmospheric particles: a new technique for measuring particle density. Aerosol Sci Technol 36:227–238.
- Messing ME, Dick KA, Wallenberg LR, Deppert K. 2009. Generation of size-selected gold nanoparticles by spark discharge – for growth of epitaxial nanowires. Gold Bull 42:20–26.
- Messing ME, Westerström R, Meuller BO, Blomberg S, Gustafson J, Andersen JN, 2010. Generation of Pd model catalyst nanoparticles by spark discharge. J Phys Chem C 114:9257–9263.
- Meuller BO, Messing ME, Engberg DLJ, Jansson A, Johansson LIM, Norlén SM, Review of spark discharge generators for production of nanoparticle aerosols. Aerosol Sci Technol 2012. (in press)
- Miyabara Y, Yanagisawa R, Shimojo N, Takano H, Lim HB, Ichinose T, 1998. Murine strain differences in airway inflammation caused by diesel exhaust particles. Eur Respir J 11:291–298.
- Nakaso K, Shimada M, Okuyama K, Deppert K. 2002. Evaluation of the change in the morphology of gold nanoparticles during sintering. J Aerosol Sci 33:1061–1074.
- Ntziachristos L, Giechaskiel B, Ristimäki J, Keskinen J. 2004. Use of a corona charger for the characterisation of automotive exhaust aerosol. J Aerosol Sci 35:943–963.
- Oberdorster G, Oberdorster E, Oberdorster J. 2005. Nanotoxicology: an emerging discipline evolving from studies of ultrafine particles. Environ Health Perspect 113:823–839.
- Oberdorster G, Stone V, Donaldson K. 2007. Toxicology of nanoparticles: a historical perspective. Nanotoxicology 1:2–25.
- Pal S, Tak YK, Song JM. 2006. Does the antibacterial activity of silver nanoparticles depend on the shape of the nanoparticle? A study of the gram-negative bacterium escherichia coli. Appl Environ Microb 73:1712–1720.
- Paur HR, Cassee FR, Teeguarden J, Fissan H, Diabate S, Aufderheide M, 2011. In-vitro cell exposure studies for the assessment of nanoparticle toxicity in the lung — a dialog between aerosol science and biology. J Aerosol Sci 42:668–692.
- Pernodet N, Fang XH, Sun Y, Bakhtina A, Ramakrishnan A, Sokolov J, 2006. Adverse effects of citrate/gold nanoparticles on human dermal fibroblasts. Small 2:766–773.
- Rissler J, Swietlicki E, Bengtsson A, Boman C, Pagels J, Sandström T, Blomberg A, Löndahl J, Experimental determination of deposition of diesel exhaust particles in the human respiratory tract. J Aerosol Sci 2012; 48:18–33.
- Roth C, Ferron A, Karg E, Lentner B, Schumann G, Takenaka S, 2004. Generation of ultrafine particles by spark discharge. Aerosol Sci Technol 38:228–235.
- Sadauskas E, Wallin H, Stoltenberg M, Vogel U, Doering P, Larsen A, 2007. Kupffer cells are central in the removal of nanoparticles from the organism. Part Fibre Tox 4:10.
- Salata OV. 2004. Applications of nanoparticles in biology and medicine. J Nanobiotechnol 2:3.
- Savi M, Kalberer M, Lang D, Ryser M, Fierz M, Gaschen A, 2008. A novel exposure system for the efficient and controlled deposition of aerosol particles onto cell cultures. Environ Sci Technol 42:5667–5674.
- Sayes CM, Reed KL, Warheit DB. 2007. Assessing toxicity of fine and nanoparticles: comparing in yitro measurements to in vivo pulmonary toxicity profiles. Toxicol Sci 97:163–180.
- Scheibel HG, Porstendörfer J. 1983. Generation of monodisperse Ag- and NaCl-aerosols with particle diameters between 2 and 300 nm. J Aerosol Sci 14:113–126.
- Schwyn S, Garwin E, Schmidt-Ott A. 1988. Aerosol generation by spark discharge. J Aerosol Sci 19:639–642.
- Sheffield AE, Pankow JF. 1994. Specific surface area of urban atmospheric particulate matter in Portland, Oregon. Environ Sci Technol 28:1759–1766.
- Sorensen CM. Light scattering by fractal aggregates: a review. Aerosol Science and Technology 2011;35:648-687.
- Steimer A, Haltner E, Lehr CM. 2005. Cell culture models of the respiratory tract relevant to pulmonary drug delivery. J Aerosol Med 18:137–182.
- Stoeger T, Reinhard C, Takenaka S, Schroeppel A, Karg E, Ritter B, 2006. Instillation of six different ultrafine carbon particles indicates a surface area threshold dose for acute lung inflammation in mice. Environ Health Perspect 114:328–333.
- Strobel R, Baiker A, Pratsinis SE. 2006. Aerosol flame synthesis of catalysts. Adv Powder Technol 17:457–480.
- Tabrizi NS, Ullmann M, Vons VA, Lafont U, Schmidt-Ott A. 2009a. Generation of nanoparticles by spark discharge. J Nanopart Res 11:315–332.
- Tabrizi NS, Xu Q, van der Pers NM, Lafont U, Schmidt-Ott A. 2009b. Synthesis of mixed metal nanopartciles by spark discharge. J Nanopart Res 11:1209–1218.
- Tajima N, Fukushima N, Ehara K, Sakurai H. 2011. Mass range and optimized operation of the aerosol particle mass analyzer. Aerosol Sci Technol 45:196–214.
- Teeguarden JG, Hinderliter PM, Orr G, Thrall BD, Pounds JG. 2006. Particokinetics in vitro: dosimetry considerations for in vitro nanoparticle toxicity assessments. Toxicol Sci 95:300–312.
- Tippe A, Heinzmann U, Roth C. 2002. Deposition of fine and ultrafine aerosol particles during exposure at the air/cell interface. J Aerosol Sci 33:207–218.
- Tran CL, Buchanan D, Cullen RT, Searl A, Jones AD, Donaldson K. 2000. Inhalation of poorly soluble particles. II. Influence of particle surface area on inflammation and clearance. Inhal Toxicol 12:1113–1126.
- Tsurudome Y, Hirano T, Yamato H, Tanaka I, Sagai M, Hirano H, 1999. Changes in levels of 8-hydroxyguanine in DNA, its repair and OGG1 mRNA in rat lungs after intratracheal administration of diesel exhaust particles. Carcinogenesis 20:1573–1576.
- Wang J, Shin WG, Mertler M, Sachweh B, Fissan H, Pui DYH. 2010. Measurement of nanoparticle agglomerates by combined measurement of electrical mobility and unipolar charging properties. Aerosol Sci Technol 44:97–108.
- Wiedensohler A. 1988. An approximation of the bipolar charge-distribution for particles in the sub-micron size range. J Aerosol Sci 1988;19:387–389.
- Yang W, Peters JI, Williams RO 3rd. 2008. Inhaled nanoparticles—a current review. Int J Pharm 356:239–247.