
Abstract
Omics technologies, such as proteomics or metabolomics, have to date been applied in the field of nanomaterial safety assessment to a limited extent. To address this dearth, we developed an integrated approach combining the two techniques to study the effects of two sizes, 5 and 30 nm, of gold nanoparticles (AuNPs) in Caco-2 cells. We observed differences in cells exposed for 72 h to each size of AuNPs: 61 responsive (up/down-regulated) proteins were identified and 35 metabolites in the cell extract were tentatively annotated. Several altered biological pathways were highlighted by integrating the obtained multi-omics data with bioinformatic tools. This provided a unique set of molecular information on the effects of nanomaterials at cellular level. This information was supported by complementary data obtained by immunochemistry, microscopic analysis, and multiplexed assays. A part from increasing our knowledge on how the cellular processes and pathways are affected by nanomaterials (NMs), these findings could be used to identify specific biomarkers of toxicity or to support the safe-by-design concept in the development of new nanomedicines.
Introduction
Currently, omics techniques are routinely applied as high-throughput methods in medical diagnostics for the analysis of disease states as well as in basic research to study biological processes or in predictive toxicology. Among the different omics techniques, genomics, which gives an overview of the complete set of genetic information provided by the DNA, and transcriptomics, which looks into gene expression patterns, convey only limited information about phenotyping, therefore, are of restricted value and are considered as an entry point with respect to other more recent omics sciences. By comparison, the information acquired by proteomic studies based on the identification of de-regulated dynamic protein products and their interactions, have a higher scientific value. Metabolomics, the newest omics science which refers to the analysis of the complete set of low molecular weight compounds in a sample, has the great advantage to provide a closer link to the phenotype of a cell/tissue at a specified time under particular environmental conditions.
To date, post-genomics techniques have been applied in the field of nanomaterial risk assessment to a limited extent (Jia et al., Citation2013; Kobeissy et al., Citation2014). Furthermore, the integration of multi-omics data has only recently been performed (Bartel et al., Citation2015; Cooney et al., Citation2015; Decourcelle et al., Citation2015; Diez et al., Citation2015; Eichner et al., Citation2014; Fagerberg et al., Citation2014; Kutmon et al., Citation2014; Meierhofer et al., Citation2014). The proteome and metabolome are directly interconnected as protein levels influence the metabolic profile of a cell system and metabolites' concentration may affect protein expression. Therefore, an integrated approach that combines proteomics and metabolomics data, is a very powerful tool to provide a more comprehensive understanding of biological effects of potential toxicants, including NMs.
Although there is an emerging interest in applying metabolomics to nanotoxicology (Huang et al., Citation2012; Lu et al., Citation2011) and in its integration with molecular profiling at protein level (Eichner et al., Citation2014), further research in these fields is needed. The proteomic approach which is quite standardized is not yet routinely implemented in the field of nanotoxicology whereas the metabolomic approach is complex and still at its early stage of development. This is not only due to the chemical diversity of cellular metabolites but also to the redundancy of cellular metabolic pathways that make data elaboration and interpretation challenging.
In this contribution, we present a multi-omics approach to better understand the cellular effects after AuNPs exposure in vitro. As progress in metabolomics data processing and analysis lags behind that of proteomics, with this work, we attempt to provide useful tools to improve metabolomics data processing and to integrate multi-omics data at systems biology level.
In more detail, we investigated the modification that occurs in the proteome and the metabolome profile of human colon adenocarcinoma cells (Caco-2) (Sambuy et al., Citation2005) when exposed to AuNPs. Qualitative and quantitative data of de-regulated proteins and metabolites obtained using two-dimensional gel electrophoresis (2DE) and liquid chromatography high-resolution tandem mass spectrometry (LC-HRMS/MS) were combined and interpreted using systems biology analysis. The aim of this study was, apart from demonstrating the great potential of this approach, to contribute to the understanding of the biological processes that are affected when AuNPs interact with living systems.
We focused on AuNPs, as they have attracted in the last decade enormous scientific and technological interest due to their unique chemical properties, which are tunable, by changing the size, shape, or surface chemistry. The initial claim of absence of cytotoxicity (Connor et al., Citation2005) has raised enthusiasm, and led to an increased use of AuNPs in consumer products such as cosmetics, food packaging, toothpastes, food supplements, and lubricants (Sung et al., Citation2011), as well as in medicine for cell imaging (Chen et al., Citation2005), targeted drug delivery (Ghosh et al., Citation2008), cancer diagnostics, and therapy (Huang et al., Citation2007; Paciotti et al., Citation2004). However, recent studies demonstrated size-dependent cytotoxicity induced by AuNPs in vitro (Alkilany & Murphy, Citation2010; Coradeghini et al., Citation2013; Vetten et al., Citation2013).
Therefore, this work aims at contributing to a better understanding of the cellular and molecular mechanisms triggered by exposure to AuNPs in Caco-2 cells by applying a multi-omics approach cross-linked with a broad set of techniques to support the omics findings. Integration of proteomics and metabolomics data is crucial to obtain biological insight for a correct hazard assessment. Furthermore, information achieved based on the knowledge of networks, processes, and pathways modified can be used to improve drug design or to identify specific biomarkers of toxicity.
Methods
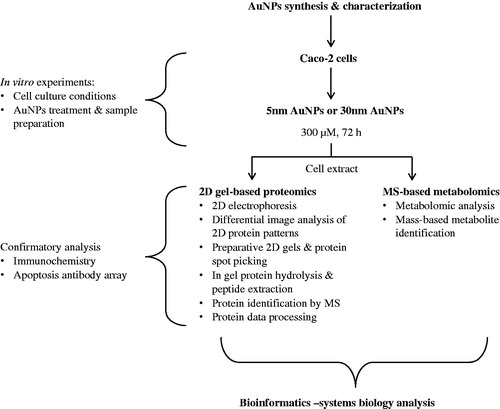
A schematic of the experimental design and the analytical and bioinformatics tools employed is provided in . Due to the complexity of the comprehensive combined approach used in this study, the detailed methodology on AuNPs synthesis and characterization, the 2D gel-based proteomics analysis, the MS-based metabolomics, and the bioinformatics description for the systems biology analysis can be found in Supplementary material.
Figure 1. Experimental design. A combination of 2D-gel based proteomic and MS-based metabolomic approaches was used to analyze the differentially expressed proteome and metabolites of the cytoplasmic compartment of Caco-2 cells exposed to 5 or 30 nm AuNPs (300 μM) for 72 h. Data obtained were interpreted using a combination of bioinformatics tools for a combined omics approach.
In vitro experiments
Cell culture conditions
Human colon adenocarcinoma Caco-2 cells (Sigma-Aldrich®, Milano, Italy) were maintained in complete culture medium composed of Dulbecco's Modified Eagle Medium (DMEM) high glucose (4500 mg/L) (Life Technologies, Turin, Italy) supplemented with 10% (v/v) fetal bovine serum (FBS, North America Origin, Life Technologies, Turin, Italy), 0.5% (v/v) penicilin/streptomycine, 4 mM l-glutamine, and 1% (v/v) not essential amino acids (Life Technologies, Turin, Italy). For routine culture, cells were maintained in a sub-confluent state under standard cell culture conditions in a humidified incubator (37 °C, 5% CO2, 95% humidity) (Heraeus Thermo Fisher®, Hoeilaart, Belgium).
AuNPs treatment and sample preparation
For proteomic experiments, 1 × 10⁶ Caco-2 cells were seeded in 5 mL complete culture medium in 100 × 20 mm Petri dish (Corning, Valdarno, Italy). After 24 h, the medium was replaced and 5 or 30 nm AuNPs were added to obtain the final concentrations of 300 μM (59 μg/mL). In each experiment, untreated cells were used as control. Six biological replicates were performed for each experimental condition. Proteins extraction from the cytoplasmatic compartment was performed after 72 h of exposure time as described in Gioria et al. (Citation2014).
For metabolomics experiments, cells were prepared as described above. At the end of the 72 h exposure time, the cell culture medium was removed. Cells were washed with 5 mL of cold phosphate-buffered saline solution (PBS) (Life Technologies, Turin, Italy) and the wash solution discarded. Cell lysates were obtained by adding 500 μL of ice-cold methanol to each well and mechanically harvested with a sterile plastic disposable cell scraper. The lysate was transferred in a 1.5 mL Eppendorf® tube. Each dish was then washed with an additional 250 μL ice-cold methanol that was collected into the respective Eppendorf® tube. Recovered cell lysate was sonicated at 50 W for 5 min and further centrifuged at 15 000 g for 15 min at 4 °C. The supernatant was collected and stored in a new 1.5 mL Eppendorf® tube at −80 °C. The methanol solution was evaporated to dryness using the centrifugal vacuum evaporator (Univapo 150 ECH, Uniequip, Planegg, Germany) for 30 min with a cooling system at 10 °C. The samples were re-suspend in 100 μL of the LC-MS mobile phase (0.1% formic acid (FA) in a solution of milli-Q water:methanol, 95:5) and centrifuged at 15 000g for 10 min at 4 °C. Samples were transferred into 96-well plates and then covered with a suitable cover mat for LC-HRMS analyses.
2D gel-based proteomic experiments
The 2D gel-based proteomics analyses together with the proteomic data processing have been performed according to our previous work (Gioria et al., Citation2014). Minor changes have been done and can be found in Supplementary methods.
MS-based metabolomic experiments
In this work, we refer to the reporting standards in metabolomics (http://msi-workgroups.sourceforge.net) of the Metabolomics Society (Sumner et al., Citation2007). These standards recommend that authors should report the level of identification for all metabolites based on a four-level system ranging from level 1 (identified compounds), via levels 2 and 3 (putatively annotated compounds), and 3 (putatively compound classes) to level 4 (unidentified or unclassified metabolites which nevertheless can be differentiated based on the spectral data).
Going through the identification of all metabolites of interest was limited to a small number of cases as the identification challenge is immense and confident unambiguous assignments of observed metabolic features to a single compound are not always possible (Warwick et al., Citation2013). Definitive (level 1) identification would require the comparison of two or more orthogonal properties (e.g. rt, accurately measured m/z, fragmentation mass spectrum) of a chemical standard to the same properties observed for the metabolite of interest analyzed under identical analytical conditions.
In this work, a level of confidence of 2 for metabolite identification (putatively annotated compounds) was reached. The application of accurate measurement of m/z was able to provide putative HMDB annotations (top five possibilities were considered).
Details concerning metabolomics analysis and data processing are available in Supplementary methods.
Systems biology analysis
Relation between the identified proteins and annotated metabolites was evaluated using the software Ingenuity Pathways Analysis (IPA) (Ingenuity Systems®, Redwood City, CA). For more details, refer to Supplementary methods.
Other techniques used
For Trypan Blue assay, immunocytochemistry analysis and apoptosis array membrane refer to Supplementary methods.
Results
Identification of the differentially expressed proteins
We assessed the differences in the cytoplasmic proteome of Caco-2 cells by 2DE, exposed to 5 or 30 nm AuNPs at a concentration of 300 μM with respect to the control (untreated) cells. The analysis of imaged gels identified a total of 836 (range 722–907), 819 (range 777–867), and 760 (range 574–944) protein spots for the control, 5 or 30 nm AuNPs-treated samples, respectively (), with an average percentage of matched spots across gels of 94%.
Figure 2. Proteomic analysis of the cytoplasmic extract of Caco-2 cells exposed to AuNPs. Representative two-dimensional gel protein maps of cytoplasmic fractions of (A) untreated (Ctrl), (B) treated with 5 nm AuNPs, and (C) treated with 30 nm AuNPs cells for 72 h. (D) The Venn diagram is showing the distribution of differentially expressed proteins: 5 nm AuNPs versus Ctrl (red circle, 36 proteins), 30 nm AuNPs versus (blue circle, 33 proteins) or 5 versus 30 nm AuNPs (green circle, 23 proteins). Number inside overlapping region of two circles refers to the spots common to different groups (For color figure refer to the online version.)
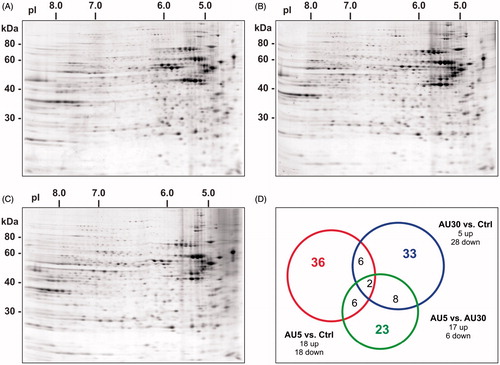
The Mann–Whitney test was used to compare the overall protein expression profile. Among the protein spots detected, 18 were found to be down-regulated by at least 2-fold, and 18 were up-regulated by at least 2-fold in cells treated with 5 nm AuNPs. In the case of 30 nm AuNPs treatment, 28 spots were down-regulated and five spots were up-regulated with at least a two-fold change. Only 33% of the de-regulated proteins were found to be common to both treatments. Differences were also found between AuNPs treated cells, as 23 spots were differentially expressed in cells treated with 5 nm AuNPs with respect to 30 nm AuNPs (17 up-regulated and six down-regulated). A total number of 66 proteins were differentially expressed and significant (p < 0.05) between the two groups (5 and 30 nm AuNPs) among which six were common to the two comparisons (). The differences in protein de-regulation observed between the two sizes can be explained considering the uptake. Indeed, as shown by our group in an earlier work, the number of internalized NPs by the cell is much higher in the case of the smaller 5 nm size compared with the bigger size 30 nm AuNPs (Bajak et al., Citation2014).
Proteins of interest (up- or down-regulated) were defined from the images of the control and treated samples, and their corresponding spots in the image of the preparative gel were matched. The 66 spots were selected from the preparative gel for spot picking. The aforementioned de-regulated protein targets were identified using LC-HRMS/MS. Proteome Discoverer (Thermo Scientific®, Waltham, MA) with the Sequest workflow and UniProtKB/Swiss-Prot database (UniProt, Washington, DC) were used for protein identification of the selected de-regulated protein spots. Results were returned for 61 out of the 66 selected spots (Supplementary material – Figure S1). reports the spot and code number, the UniProt accession number, the protein code, the p value, and fold change as compared with the control, the protein coverage, the theoretical MW, and pI and the protein score. In the table, proteins that have been differentially regulated by AuNPs are classified according to their main function based on UniProtKB/Swiss-Prot and Gene Ontology (GO) (UniProt, Washington, DC). In , proteins deregulated by 5 or 30 nm AuNPs are visualized grouped for main function.
Figure 3. Biological functions altered by AuNPs exposure. Bar charts grouped by biological function representing the differentially expressed proteins and metabolites, after 72 h of treatment with AuNPs. (A) Represents the de-regulated proteins by 5 nm or 30 nm AuNPs and (B) the de-regulated metabolites following exposure to 5 and 30 nm AuNPs.
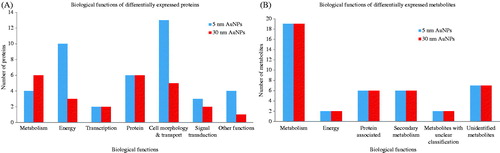
Table 1. List of de-regulated proteins identified in individual 2D gel spots of Caco-2 cytoplasmic extracts.
Investigation of de-regulated metabolites
Using LC-MS and metabolomic data analysis, we assessed the differences in the metabolic profile within the cells when exposed to AuNPs of 5 or 30 nm sizes with respect to the untreated control.
The m/z features obtained after statistical analysis were submitted to public database search for metabolite annotations. For metabolite identification, we used the standard reporting system, described previously (Sumner et al., Citation2007). Results show that both sizes of AuNPs had a significant impact on the metabolic profiling of the cell extract as 35 metabolites were found significantly differentially expressed (p <0.05) () and sorted according to their main biological function. In , metabolites deregulated by 5 or 30 nm AuNPs are visualized grouped for main function.
Table 2. List of de-regulated tentatively annotated metabolites in the cell extract.
Interestingly, the same metabolites were found to be de-regulated by both sizes of AuNPs; however, the changes were more pronounced after treatment with the smaller 5 nm AuNPs.
Systems biology analysis
The IPA software was used for the combination and interpretation of complex data for both metabolomics and proteomics platforms. reports the most significant molecular networks affected in response to 5 or 30 nm AuNPs treatment for 72 h, data were obtained by analyzing the differentially expressed proteins and metabolites ( and , respectively). The focus molecules and de-regulation are highlighted in . Results show that the major networks altered in response to 5 nm AuNPs were related to small molecule biochemistry, cell assembly and organization, cellular growth, and proliferation. In the case of 30 nm AuNPs, the most affected networks were involved in cellular compromise (degeneration) and cell morphology. shows the molecular pathways affected by AuNPs exposure, and highlights the identified de-regulated proteins and metabolites and their interconnection in the network.
Figure 4. Molecular networks. De-regulated molecular networks in response to 5 or 30 nm AuNPs exposure in Caco-2 cells (300 μM, 72 h). The networks are obtained by analyzing the differentially expressed proteins and metabolites (listed in and ) using Ingenuity IPA. Identified de-regulated proteins and metabolites involved in the network are highlighted in bold. The color indicate the de-regulation (red ![]()
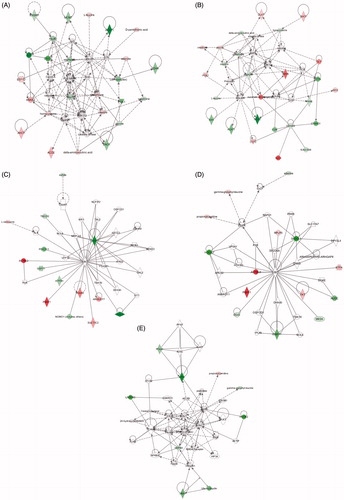
Table 3. Identified molecular networks using Ingenuity IPA.
Other techniques
At the omics level, we have reported alterations of molecular networks involved in cellular compromise (degeneration), cell morphology, cellular assembly and organization, cellular growth, and proliferation. In addition, several proteins among which ARHGEF7, HSPD1, HSPA9, and annotated metabolites such as glutathione or C-3 carnitine known to be associated to the apoptotic process were found differentially expressed.
To confirm our findings, we cross-linked omics data with a broad set of complementary techniques. By microscopy analysis, it was apparent that cell growth was clearly hindered by AuNPs (Supplementary Figure S2). The effect was particularly evident for cells exposed to 5 nm and less pronounced in the case of 30 nm AuNPs exposure. The observation was in line with what reported in Bajak et al. (Citation2014) where, in the Trypan blue assay, lower total cell numbers were detected in samples treated with AuNPs, despite an overall high cell viability (> 90%) in all conditions. We investigated the effects of AuNPs exposure on the cytoskeleton organization and nuclei by immunocytochemistry, staining the F-actin filaments of the cells with phalloidin and nuclei with DAPI. In the absence of NPs, the actin filaments were well organized, whereas cells exposed to AuNPs presented an alteration in F-actin distribution, with thinner and poorly oriented stress fibers and a more punctuate fluorescent pattern (Supplementary Figure 3S-B). This modification of the cytoskeleton might alter the shape, growth rate, and survival mechanisms of the cells. Fragmentation of the cell nuclei was also observed after exposure to AuNPs (Supplementary Figure 3S-A). In order to quantify these microscopic observations, INCell analyzer 2200 (GHealthcare, Santa Clara, CA) was used to study the nuclei and cytoskeleton morphology of Caco-2 cells. Results obtained (Supplementary Figure 4S) confirmed that the cytoskeleton of the cells incubated with AuNPs was significantly disrupted (p < 0.05), although no differences were observed in the F-actin analysis between 5 nm and 30 nm treatments (p > 0.05). The nuclei area of the cells was significantly reduced after exposure to AuNPs (p < 0.05), and several fragmented nuclei were detected which are linked to apoptotic cell death. Furthermore, the nuclear measurements applied as an apoptosis indicator showed significant increased values in both NPs treatments with respect to the control (p < 0.05). Both parameters related to the nuclei, area and apoptosis indicator, reveal apoptotic events in NP-treated cells with a more pronounced effect in 5 nm AuNPs (5 nm versus 30 nm, p < 0.05).
To support these findings, cells were stained with Annexin V antibody (Supplementary Figure 3S-C) and a simultaneous screening of 43 human markers was performed using an apoptosis-specific antibody array. The results shown in Supplementary Figure 5S highlight significant changes in the expression of several proteins involved in the apoptosis process. CAS-3 and CAS-8 were found to be strongly upregulated by exposure to 5 nm AuNPs. In addition, BAD, BAX, BCL-2, BCL-W, CIAP-2, BID, BIM, CD40, CYTOC, DR6, FAS, several proteins of the IGFBP family, sTNF-R2, and TNF-α were found to be down-regulated by 30 nm AuNPs.
Discussion
Current challenges in omics approach
Proteomics and metabolomics, combined with systems biology, are excellent tools to screen the effects and toxicological mechanisms induced by NPs. However, the metabolomics approach remains very challenging and still relatively novel in the field of nanotoxicology. In the present work, results from metabolomics were integrated to data obtained from the study of the de-regulation of the proteome to closely investigate the bio-responses of Caco-2 cells when exposed to AuNPs. To partially overcome the metabolomics data analysis challenge, IPA was used to integrate both proteomics and metabolomics data and to gain insights into molecular pathways from identified proteins and metabolite annotations.
This combined approach allowed the detection of significant changes in the proteome and metabolome profiles of Caco-2 cells treated with 5 or 30 nm AuNPs. Due to the complexity of the experimental set-up, the number of conditions tested was limited to two sizes of AuNPs and one dose (300 μM). The dose was selected based on the previous cytotoxicity tests (Bajak et al., Citation2014) and corresponds to the lowest one where significant cytotoxicity started to be observed in at least one of the two NP sizes tested (5 nm). Unfortunately, at this molar concentration of gold, it was not possible to conduct exposure experiments using 30 nm particles while maintaining the same total surface area or the number of particles as the experiments with 5 nm particles. To achieve these conditions, based on the same starting mass concentration of gold in the stock solution, it would have been necessary to pre-concentrate the 30 nm nanoparticles solution to unreachable levels (36 times more for equivalent surface area and 216 for equivalent particle number). Such concentration would cause the agglomeration of the NPs. For this reason, the exposure has been normalized to gold molarity.
The limitations of 2D gel-based proteomics platform are the association of isoelectric-focusing (IEF) and two-dimensional electrophoresis as quantitative preparative techniques for mass spectrometry, hence only a reduced number of samples can be processed. However, the attractiveness of this platform is that it allows the identification of post-translational modifications that occurred to proteins, otherwise not detected with our mass spectrometry-based approach. By 2DE, we were able to observe isoforms (spot G5 and F5, A1 and B3, E9–E10–E11) as well as proteolytic fragments (D1 and D2).
In addition, we combined the advanced omics tools with a broad set of complementary techniques, including immunochemistry, microscopic analysis, and multiplexed assays for the detection of apoptosis proteins. Cross-linking different techniques can improve the knowledge and understanding in nanotoxicology as shown in this work.
Mechanisms of AuNPS toxicity
A number of intrinsic cellular pathways are triggered in response to AuNPs exposure. Using IPA, the differentially expressed proteins and metabolites were used to show a range of molecular networks modulated by AuNPs. These include cellular compromise (degeneration), small molecule biochemistry, cell morphology, cellular assembly and organization, cellular growth, and proliferation ( and ).
Changes in the Caco-2 cells' proteome and metabolome due to AuNPs exposure are size specific, with 5 nm AuNPs inducing a more severe protein de-regulation compared with the 30 nm particles. That can be explained considering the much higher internalization of 5 nm AuNPs when compared with the 30 nm AuNPs one (Bajak et al., Citation2014). For both AuNPs sizes, down-regulated proteins were mainly associated with cellular growth and proliferation, whereas the proteins found mostly up-regulated were involved in antioxidant activity and apoptosis. This was particularly evident in the case of exposure to 5 nm AuNPs.
Interestingly, the proteins which were most strongly de-regulated by 5 and 30 nm AuNPs were ACTBL2 that is involved in cytoskeleton organization, HOOK2 responsible for vesicle trafficking from early endosome to late endosome, PSAT1 and ACAT1 involved in amino acid biosynthesis and ketone metabolism, respectively. G3BP1 involved in cellular response to stress (Tourriere et al., Citation2003) was under-expressed in both AuNPs treatments. On the contrary, AHCY was over-expressed by both AuNPs treatment. AHCY belongs to the adenosylhomocysteinase family and catalyzes the reversible hydrolysis of S-adenosylhomocysteine (AdoHcy) to adenosine (Ado) and l-homocysteine (Hcy), thus regulating the intracellular S-adenosylhomocysteine (SAH) concentration. In this regard, it has been shown that SAH can promote apoptosis, inhibit migration, and adhesion (Li et al., Citation2014).
Cell viability, oxidative stress, and survival mechanisms
Various, well-established in vitro assays to study cellular DNA damage, inflammation, oxidative stress, and mitochondrial injury have been largely used as measurement end points for assessing NP-induced toxicity. However, the information obtained from these assays is not sufficient to provide a detailed description of the overall bio-responses or to highlight the critical biochemical pathways which are affected by NPs exposure. On the other hand, omics technologies, such as proteomics and metabolomics, provide more mechanistic information.
Among the differentially expressed proteins found to be de-regulated in our study, several are associated with cell viability and survival mechanisms, including oxidative stress and apoptosis.
We have reported overexpression of VIL-1 in 5 nm AuNPs exposed cells, a protein that plays a key role in actin regulation, in the organization, integration, and regulation of multiple epithelial cell functions such as cell morphology, cell motility, and appears to regulate cell death by maintaining mitochondrial integrity. PCK2, ACAA2, and ARHGEF7 were found to be up-regulated by the smaller AuNPs, whereas P4HB and HSPD1 were found to be down-regulated by 5 nm AuNPs. At this regard, it has been shown that PCK2 is over-expressed under stress condition, ARHGEF7 functions as a positive regulator of apoptosis, whereas ACAA2 abolishes BNIP3-mediated apoptosis and mitochondrial damage (Mendez-Lucas et al., Citation2014). P4HB has been reported to be involved in the regulation of intrinsic apoptotic signaling pathway in response to oxidative stress. Recent studies (Lee et al., Citation2014) have shown that P4HB is among the down-regulated proteins involved in the endoplasmic reticulum stress response and Nrf2-ARE signaling. HSPD1 is implicated in mitochondrial protein import and macromolecular assembly. It also facilitates the correct folding of imported proteins, preventing misfolding and promoting the refolding and proper assembly of unfolded polypeptides generated under stress conditions in the mitochondrial matrix.
UBA1, which has a critical importance in regulation of diverse cellular processes such as cell cycle and cell death, was found to be down-regulated in cells exposed to 30 nm AuNPs. In addition, the expression of several proteins with oxido-reductase function was modified in cells exposed to 5 nm AuNPs (IDH1, MDH2, SDH4, and ETFA) and 30 nm AuNPs (LDHA).
Among the differentially expressed annotated metabolites, propionylcarnitine (C-3 carnitine) and glycine levels were found to be increased after exposure to both AuNP sizes. These metabolites have already been reported as associated to the apoptotic processes (Ankarcrona et al., Citation1995; Ferrara et al., Citation2005; Halama et al., Citation2011). The integration of proteomics and metabolomics data clearly confirmed that proteins and related metabolites involved in carbohydrate metabolism and in stress response were affected by AuNPs treatments. The decrease of glycolytic rate can be correlated to the growth rate reduction. Moreover, metabolomics analysis showed accumulation of glutathione (GSH) in both 5 and 30 nm treated cells, which is considered a natural self-defense mechanism of cells to cope with oxidative stress since GSH plays an essential role in maintaining the intracellular redox environment. In addition, for 5 nm AuNPs exposure, we noticed a decrease in the stress response proteins HSPD1 and HSPA9, which function as chaperons. It is known that in mammalian cells, chaperones present anti-apoptotic activity by preventing caspase activation (Longo et al., Citation2015). Of interest, the down-regulation is also observed of YWHAG known for its capacity to protect cells against stress-induced apoptosis. Thus, the lower abundance of these proteins reflects the apoptotic state of cells that underwent AuNPs treatment, more enhanced in the 5 nm AuNPs-treated cells.
To further confirm that apoptosis occurred in Caco-2 cells exposed to AuNPs, the omics data were supported by florescence microscopy analysis where over-expression of Annexin V and nuclear fragmentation induced by AuNPs were evident and more pronounced in the case of 5 nm AuNPs. The findings were supported by data obtained using an apoptosis-specific antibody array. Results show that exposure to 30 nm AuNPs reduces the expression of anti-apoptotic BCL-2 family members, of CIAP-2 that is required to protect cells against TNF-α-induced apoptosis, of several proteins of the IGFBP family and of sTNF-R2. Several anti- and pro-apoptotic proteins are triggered by 30 nm AuNPs, although we suggest that there is a balance among these elements which prevent a massive activation of Caspase-3 (cas-3) in Caco-2 cells exposed to AuNPs. Conversely, the effects of 5 nm AuNPs are more severe, thus cas-3 and cas-8 expression was found to be significantly up-regulated. The established link between metabolism and apoptosis that we report here represents a novelty in the area of NP-induced toxicity. We suggest that the metabolomics signatures may be used as early biomarkers of apoptosis in in vitro systems exposed to NPs.
Cell cycle, cellular growth, and proliferation
Our results reveal that the differences in cell growth already evident by morphological analysis are reflected at protein and metabolite level. YWHAG involved in G2/M transition of mitotic cell cycle, MCM7, and NUDC were all down-regulated in cells exposed to 5 nm AuNPs. In addition, we report changes in cellular amino acid levels. Exposure to both AuNP sizes results in a decrease in amino acids such as l-leucine and l-isoleucine, whereas glycine level is increased. As glycine is biosynthesized starting from the amino acid serine, its change in the metabolite profiles in treated cells is perfectly in accordance with the increased expression of PSAT1, a phosphoserine aminotransferase (Vié et al., Citation2008) involved in serine biosynthesis.
Cytoskeleton organization and cell adhesion
We show here that several proteins involved in cytoskeleton organization and cell adhesion are de-regulated by AuNPs exposure. We reported that both sizes of AuNPs trigger the up-regulation of ACTBL2, a key protein in orchestrating cytoskeletal reorganization and cell migration.
In addition, CTTN, which contributes to the organization of the actin cytoskeleton and cell structure, together with CCT2, known to play a role in vitro in the folding of actin and tubulin, were de-regulated after 5 nm AuNPs exposure. Furthermore, the de-regulation of VIL-1 of relevance is caused by the smaller AuNPs size. This protein which functions in the capping, severing, and bundling of actin filaments is a dominant component of the brush border cytoskeleton.
The exposure to the larger AuNPs decreases the expression of TMOD3 which blocks the elongation and depolymerization of the actin filaments at the pointed end. We also report a reduction in the expression of several proteins involved in cell adhesion. CTNND1 that was found to be strongly down-regulated after 5 nm NPs exposure, is associated with, and regulates the cell adhesion properties of C-, E-, and N-cadherins being, therefore, critical for the surface stability. In this regard, we also noted a decrease of the level of DSG1, a member of the cadherin cell adhesion molecule superfamily, and of JUP, a member of the catenin protein family involved in regulating the coordination of cell–cell adhesion, following exposure to 5 and 30 nm AuNPs, respectively.
Our work points out that exposure to AuNPs induces a severe alteration at cytoskeleton and cell adhesion level. In addition, the major proteins involved in these modifications were highlighted.
DNA synthesis and repair, protein synthesis, and amino acid transport
Moreover, the proteomic data show that several proteins involved in DNA synthesis and repair, protein synthesis, and amino acid transport were also found de-regulated. At protein level, MCM7 and GSPT1 are down-regulated following exposure to 5 nm and 30 nm AuNPs, respectively. On the other hand, EEF1D was up-regulated in cells exposed to 30 nm AuNPs.
Among the de-regulated metabolites, glutathione, a major endogenous antioxidant produced by the cells, participating directly in the neutralization of free radicals and reactive oxygen compounds and having also a role in metabolic and biochemical reactions such as DNA synthesis and repair, protein synthesis, and amino acid transport, decreased in Caco-2 cells exposed to both AuNP treatments. In this respect, changes in glutathione metabolism level were already observed at gene expression level (Bajak et al., Citation2014).
The expression of two proteins, ATIC and PFAS, involved in purine biosynthesis, are found strongly decreased in cells exposed to 30 nm AuNPs.
Cell interaction and intracellular distribution of AuNPs
The modifications observed at protein and metabolite level are clearly due to intracellular accumulation of AuNPs (Bajak et al., Citation2014; Gioria et al., Citation2014). In relation to this, it has been shown that the uptake of AuNPs into mammalian cells occurs more likely via endocytosis (Huefner et al., Citation2014). We report that SH3GL1 and EAA1 proteins, both known to be involved in endocytic transport, were found to be down-regulated in 5 nm exposed cells. In this respect, Renard et al. (Citation2014) have shown the important role of SH3GL1 in clathrin-independent endocytic process. In addition, ANX2 was up-regulated in 30 nm AuNPs-exposed cells and it was shown that ANX2 binds to endosomes and functions in endosomal transport (Emans et al., Citation1993), a process that is regulated by tyrosine 23 phosphorylation (Morel & Gruenberg, Citation2009).
Taken together, the proteomic data not only suggest that the intracellular uptake of AuNPs in Caco-2 cells is mediated by endocytosis, but also allow the identification of key-player proteins involved in this mechanism.
Conclusions
Recent advances in proteomics and untargeted metabolomics technologies enable qualitative and quantitative analysis of a wide range of biomolecules and thus allow the determination of their relative abundance between different biological conditions. Here, we provide a well-designed, robust, and reliable methodology to evaluate changes in the protein and metabolite profiles in vitro, thus contributing to the progress in assessing NP-induced toxicity. In addition, our work also aims at bringing metabolomics to a similar level as that of the proteomics approach by working on the workflow for data processing as well as on the harmonization of the process.
We have shown that the integration of omics technologies together with complementary methods offers not only a promising tool to understand the toxicological behavior of nanomaterials but could also enhance nano-drug development and allow the identification of biomarkers for NPs-induced toxicity. Future work aims at highlighting similarity among the de-regulated biomolecules in different cell models exposed to diverse NPs.
Supplementary material available online
Supplementary materials
Download Zip (8.3 MB)Acknowledgements
The authors are very thankful to Dr. Martin Hajduch, Dr. Claude Guillou, Dr. Douglas Gilliland, and Jessica Ponti for helpful discussions. The authors would like to acknowledge Dr. Claudia Placidi and Dr. Giovanna Finzi, of the University of Insubria, Varese, Italy, for their assistance. They thank Dr. Val Millar (GE Healthcare Life Sciences) for technical and scientific support in the development of analysis protocols for INCell Analyzer.
Declaration of interest
The authors report that they have no conflicts of interest. The research described in this work was supported by the European Commission Joint Research Center (JRC) within the Nanobiosciences (NBS) and Chemical Assessment and Testing (CAT) Units of the Institute for Health and Consumer Protection (IHCP) through the JRC Multiannual Work Program.
References
- Alkilany AM, Murphy CJ. 2010. Toxicity and cellular uptake of gold nanoparticles: what we have learned so far? J Nanopart Res 12:2313–33
- Ankarcrona M, Dypbukt JM, Bonfoco E, Zhivotovsky B, Orrenius S, Lipton SA, Nicotera P. 1995. Glutamate-induced neuronal death: a succession of necrosis or apoptosis depending on mitochondrial function. Neuron 15:961–73
- Bajak E, Fabbri M, Ponti J, Gioria S, Ojea-Jimenez I, Collotta A, et al. 2014. Changes in Caco-2 cells transcriptome profiles upon exposure to gold nanoparticles. Toxicol Lett 233:187–99
- Bartel J, Krumsiek J, Schramm K, Adamski J, Gieger C, Herder C, et al. 2015. The human blood metabolome-transcriptome interface. PLoS Genet 11:e1005274
- Chen J, Saeki F, Wiley BJ, Cang H, Cobb MJ, Li ZY, et al. 2005. Gold nanocages: bioconjugation and their potential use as optical imaging contrast agents. Nano Lett 5:473–7
- Connor EE, Mwamuka J, Gole A, Murphy CJ, Wyatt MD. 2005. Gold nanoparticles are taken up by human cells but do not cause acute cytotoxicity. Small 1:325–7
- Cooney JM, Barnett MP, Dommels YE, Brewster D, Butts CA, Mcnabb WC, et al. 2015. A combined omics approach to evaluate the effects of dietary curcumin on colon inflammation in the Mdr1a mouse model of inflammatory bowel disease. J Nutr Biochem
- Coradeghini R, Gioria S, Garcia CP, Nativo P, Franchini F, Gilliland D, et al. 2013. Size-dependent toxicity and cell interaction mechanisms of gold nanoparticles on mouse fibroblasts. Toxicol Lett 217:205–16
- Decourcelle M, Perez-Fons L, Baulande S, Steiger S, Couvelard L, Hem S, et al. 2015. Combined transcript, proteome, and metabolite analysis of transgenic maize seeds engineered for enhanced carotenoid synthesis reveals pleotropic effects in core metabolism. J Exp Bot 66:3141–50
- Diez P, Droste C, Degano RM, Gonzalez-Munoz M, Ibarrola N, Perez-Andres M, et al. 2015. Integration of proteomics and transcriptomics data sets for the analysis of a lymphoma B-cell line in the context of the chromosome-centric human proteome project. J Proteome Res 14:3530–40
- Eichner J, Rosenbaum L, Wrzodek C, Haring HU, Zell A, Lehmann R. 2014. Integrated enrichment analysis and pathway-centered visualization of metabolomics, proteomics, transcriptomics, and genomics data by using the InCroMAP software. J Chromatogr B Analyt Technol Biomed Life Sci 966:77–82
- Emans N, Gorvel JP, Walter C, Gerke V, Kellner R, Griffiths G, Gruenberg J. 1993. Annexin II is a major component of fusogenic endosomal vesicles. J Cell Biol 120:1357–69
- Fagerberg L, Hallstrom BM, Oksvold P, Kampf C, Djureinovic D, Odeberg J, et al. 2014. Analysis of the human tissue-specific expression by genome-wide integration of transcriptomics and antibody-based proteomics. Mol Cell Proteomics 13:397–406
- Ferrara F, Bbertelli A, Falchi M. 2005. Evaluation of carnitine, acetylcarnitine and isovalerylcarnitine on immune function and apoptosis. Drugs Exp Clin Res 31:109–14
- Ghosh P, Han G, De M, Kim CK, Rotello VM. 2008. Gold nanoparticles in delivery applications. Adv Drug Deliv Rev 60:1307–15
- Gioria S, Chassaigne H, Carpi D, Parracino A, Meschini S, Barboro P, Rossi F. 2014. A proteomic approach to investigate AuNPs effects in Balb/3T3 cells. Toxicol Lett 228:111–26
- Halama A, Moller G, Adamski J. 2011. Metabolic signatures in apoptotic human cancer cell lines. Omics 15:325–35
- Huang SM, Zuo X, Li JJ, Li SF, Bay BH, Ong CN. 2012. Metabolomics studies show dose-dependent toxicity induced by SiO(2) nanoparticles in MRC-5 human fetal lung fibroblasts. Adv Healthcare Mater 1:779–84
- Huang X, Jain PK, El-Sayed IH, El-Sayed MA. 2007. Gold nanoparticles: interesting optical properties and recent applications in cancer diagnostics and therapy. Nanomedicine (Lond) 2:681–93
- Huefner A, Septiadi D, Wilts BD, Patel II, Kuan WL, Fragniere A, et al. 2014. Gold nanoparticles explore cells: cellular uptake and their use as intracellular probes. Methods 68:354–63
- Jia L, Lu Y, Shao J, Liang XJ, Xu Y. 2013. Nanoproteomics: a new sprout from emerging links between nanotechnology and proteomics. Trends Biotechnol 31:99–107
- Kobeissy FH, Gulbakan B, Alawieh A, Karam P, Zhang Z, Guingab-Cagmat JD, et al. 2014. Post-genomics nanotechnology is gaining momentum: nanoproteomics and applications in life sciences. Omics 18:111–31
- Kutmon M, Evelo CT, Coort SL. 2014. A network biology workflow to study transcriptomics data of the diabetic liver. BMC Genomics 15:971
- Lee LC, Weng YT, Wu YR, Soong BW, Tseng YC, Chen CM, Lee-Chen GJ. 2014. Downregulation of proteins involved in the endoplasmic reticulum stress response and Nrf2-ARE signaling in lymphoblastoid cells of spinocerebellar ataxia type 17. J Neural Transm 121:601–10
- Li Q, Mao L, Wang R, Zhu L, Xue L. 2014. Overexpression of S-adenosylhomocysteine hydrolase (SAHH) in esophageal squamous cell carcinoma (ESCC) cell lines: effects on apoptosis, migration and adhesion of cells. Mol Biol Rep 41:2409–17
- Longo V, Zdralevic M, Guaragnella N, Giannattasio S, Zolla L, Timperio AM. 2015. Proteome and metabolome profiling of wild-type and YCA1-knock-out yeast cells during acetic acid-induced programmed cell death. J Proteomics 128:173–88
- Lu X, Tian Y, Zhao Q, Jin T, Xiao S, Fan X. 2011. Integrated metabonomics analysis of the size-response relationship of silica nanoparticles-induced toxicity in mice. Nanotechnology 22:055101
- Meierhofer D, Weidner C, Sauer S. 2014. Integrative analysis of transcriptomics, proteomics, and metabolomics data of white adipose and liver tissue of high-fat diet and rosiglitazone-treated insulin-resistant mice identified pathway alterations and molecular hubs. J Proteome Res 13:5592–602
- Mendez-Lucas A, Hyrossova P, Novellasdemunt L, Vinals F, Perales JC. 2014. Mitochondrial phosphoenolpyruvate carboxykinase (PEPCK-M) is a pro-survival, endoplasmic reticulum (ER) stress response gene involved in tumor cell adaptation to nutrient availability. J Biol Chem 289:22090–102
- Morel E, Gruenberg J. 2009. Annexin A2 binding to endosomes and functions in endosomal transport are regulated by tyrosine 23 phosphorylation. J Biol Chem 284:1604–11
- Paciotti GF, Myer L, Weinreich D, Goia D, Pavel N, Mclaughlin RE, Tamarkin L. 2004. Colloidal gold: a novel nanoparticle vector for tumor directed drug delivery. Drug Deliv 11:169–83
- Renard HF, Simunovic M, Lemiere J, Boucrot E, Garcia-Castillo MD, Arumugam S, et al. 2014. Endophilin-A2 functions in membrane scission in clathrin-independent endocytosis. Nature 517:493–6
- Sambuy Y, Deangelis I, Ranaldi G, Scarino ML, Stammati A, Zucco F. 2005. The Caco-2 cell line as a model of the intestinal barrier: influence of cell and culture-related factors on Caco-2 cell functional characteristics. Cell Biol Toxicol 21:1–26
- Sumner LW, Amberg A, Barrett D, Beale MH, Beger R, Daykin CA, et al. 2007. Proposed minimum reporting standards for chemical analysis Chemical Analysis Working Group (CAWG) Metabolomics Standards Initiative (MSI). Metabolomics 3:211–21
- Sung JH, Ji JH, Park JD, Song MY, Song KS, Ryu HR, et al. 2011. Subchronic inhalation toxicity of gold nanoparticles. Part Fibre Toxicol 8:16
- Tourriere H, Chebli K, Zekri L, Courselaud B, Blanchard JM, Bertrand E, Tazi J. 2003. The RasGAP-associated endoribonuclease G3BP assembles stress granules. J Cell Biol 160:823–31
- Vetten MA, Tlotleng N, Tannerrascher D, Skepu A, Keter FK, Boodhia K, et al. 2013. Label-free in vitro toxicity and uptake assessment of citrate stabilised gold nanoparticles in three cell lines. Part Fibre Toxicol 10:50
- Vié N, Copois V, Bascoul-Mollevi C, Denis V, Bec N, Robert B, et al. 2008. Overexpression of phosphoserine aminotransferase PSAT1 stimulates cell growth and increases chemoresistance of colon cancer cells. Mol Cancer 7:14
- Warwick B, Dunnerban A, Webber RJM, Creek DJ, Brown M, et al. 2013. Mass appeal: metabolite identification in mass spectrometry-focused untargeted metabolomics. Metabolomics 9:22