
Abstract
Introduction: Increased use of nanomaterials has raised concerns about the potential for undesirable human health and environmental effects. Releases into the air may occur and, therefore, the inhalation route is of specific interest. Here we tested copper oxide nanoparticles (CuO NPs) after repeated inhalation as hazard data for this material and exposure route is currently lacking for risk assessment.
Methods: Rats were exposed nose-only to a single exposure concentration and by varying the exposure time, different dose levels were obtained (C × T protocol). The dose is expressed as 6 h-concentration equivalents of 0, 0.6, 2.4, 3.3, 6.3, and 13.2 mg/m3 CuO NPs, with a primary particle size of 10 9.2–14 nm and an MMAD of 1.5 μm.
Results: Twenty-four hours after a 5-d exposure, dose-dependent lung inflammation and cytotoxicity were observed. Histopathological examinations indicated alveolitis, bronchiolitis, vacuolation of the respiratory epithelium, and emphysema in the lung starting at 2.4 mg/m3. After a recovery period of 22 d, limited inflammation was still observed, but only at the highest dose of 13.2 mg/m3. The olfactory epithelium in the nose degenerated 24 h after exposure to 6.3 and 13.2 mg/m3, but this was restored after 22 d. No histopathological changes were detected in the brain, olfactory bulb, spleen, kidney and liver.
Conclusion: A 5-d, 6-h/day exposure equivalent to an aerosol of agglomerated CuO NPs resulted in a dose-dependent toxicity in rats, which almost completely resolved during a 3-week post-exposure period.
Introduction
The increased use of nanomaterials has raised concerns about the potential for undesirable human health and environmental effects. Copper oxide nanoparticles (CuO NPs) are used in a number of technical applications such as catalysts, solar cells, wood protection, electronics, and antimicrobial products (Ahamed et al., Citation2014; Ben-Moshe et al., Citation2009; Bhaumik et al., Citation2014; Evans et al., Citation2008; Ren et al., Citation2009). They are also used as additives in inks (Zenou et al., Citation2014) and coatings in food packaging (Longano et al., Citation2012). During the production or manipulation of nanomaterial in the workplace, inhalation is considered a major route of concern (Koivisto et al., Citation2015; Kuhlbusch et al., Citation2011). Acute adverse health effects have been observed in workers during welding who are exposed to copper dusts consisting of different chemical species, unknown particle size and often mixed with other chemicals, e.g. zinc or iron elements (Armstrong et al., Citation1983, Peoples et al., Citation1988).
In the workplace, acute adverse health effects have been observed in workers exposed to welding fumes that contain copper in different chemical species of unknown particle size, often in combination with other chemicals including zinc or iron (Armstrong et al., Citation1983; Peoples et al., Citation1988)
Dedicated in vivo inhalation studies for CuO NPs are scarce and studies applying multiple exposure levels leading to different lung pulmonary doses have not been reported. In the literature, two studies in mice describe lung inflammatory responses including elevated cytokines in broncho-alveolar lavage fluid (BALF) with perivasculitis and alveolitis following whole-body exposure to 25 nm Cu particles with an oxidized surface containing Cu2O and CuO (Kim et al., Citation2011; Pettibone et al., Citation2008). These mice were exposed to a single concentration of 3.6 mg/m3 for 4 h or for a period of 4 h/d, 5 d a week during 2 weeks (200 nm mass median diameter). A few intratracheal (i.t.) studies have also been performed in rats as recently reviewed (Ahamed et al., Citation2015). CuO NPs smaller than 50 nm were found to be inflammogenic when doses of 0.17 or 0.5 mg/rat were delivered after a single i.t. instillation (Cho et al., Citation2010). A single high dose of 2 mg/rat of 33 nm CuO particles rapidly led to death within 1 day after i.t. exposure instillation (Yokohira et al., Citation2008), while a lower dose of 0.5 mg/rat induced neoplastic lesions after 30 weeks in a bioassay with a carcinogen (Yokohira et al., Citation2009).
Toxic effects have been reported in mice exposed orally to 23 nm Cu NPs with the kidney, liver, and spleen as main target organs (Chen et al., Citation2006). The organ distribution following inhalation of CuO NPs is not known. However, other NPs are known to translocate beyond the lung after inhalation (Geiser & Kreyling, Citation2010).
The aim of this study was to determine the intrinsic hazard of industrial relevant CuO nanoparticles CuO NPs following inhalation and derive dose-response data that is useful to assess the risk of (sub)acute effects as well as to inform the design of further studies leading to a final risk assessment. We have applied a short-term inhalation study protocol (5 d exposure, sacrificed at day 6 and day 28) to determine the (sub)acute toxicity of CuO NPs. Based on the studies described above, local lung inflammatory effects were expected. A comprehensive set of biological markers were determined in the lung, and also in other organs and this is combined with information on histopathological changes. In addition to lung burdens, organ burdens were included to determine the translocation of Cu beyond the point of entry (Geiser & Kreyling, Citation2010).
In the protocol applied here, male rats were exposed for 5 consecutive days via nose-only inhalation to a target exposure concentration of 10 mg/m3. By varying the exposure times (from 18 min up to 6 h) six dose levels were achieved according to the C × T protocol in which C is the concentration and T is the duration of exposure (OECD, Citation2009), Using an identical aerosol for exposure for all doses avoids the changes size distributions caused by altering the aerosol concentrations. Control animals were exposed to clean air. By studying the effects shortly after termination of the exposure as well as after a recovery period of 3 weeks, information was gathered on reversibility of acute adverse effects. An advantage of the shortened exposure period in comparison to standard subacute and subchronic inhalation testing (according to OECD test guidelines 412 and 413) is that the burden is less for the animals and less exposure material is needed (Klein et al., Citation2012). Applying six dose groups allows dose–response modeling. Here, the benchmark dose (BMD) approach was used (EFSA, Citation2009) to derive a point of departure for further risk assessment, i.e. to obtain a health-based guidance value (Brandon et al., Citation2013; EFSA, Citation2009, Filipsson et al., Citation2003). The advantage of this approach is that it provides a confidence interval around the BMD thus indicating the reliability of the data. In addition, by estimating benchmark doses for various lung and systemic responses, sensitive endpoints for acute effects can be identified based on the lowest derived BMD as indicated by the lower bound (BMDL) of the confidence interval and this information can be used for risk assessment (Slob, Citation2002).
An advantage of the shortened exposure period in comparison to standard subacute and subchronic inhalation testing (according to OECD test guidelines 412 and 413) is that the burden is less for the animals and less exposure material is needed (Klein et al., Citation2012). Here, we have applied six dose groups including controls to allow dose–response modeling. The benchmark dose (BMD) approach was used (EFSA, Citation2009) to derive a point of departure for further risk assessment, i.e. to obtain a health-based guidance value (Brandon et al., Citation2013; EFSA, Citation2009; Filipsson et al., Citation2003). The advantage of this approach is that it provides a confidence interval around the BMD thus indicating the reliability of the data. In addition, by estimating benchmark doses for various lung and systemic responses, sensitive endpoints for acute effects can be identified based on the lowest derived benchmark dose as indicated by the lower bound (BMDL) of the confidence interval and this information can be used for risk assessment (Slob, Citation2002).
Materials and methods
Test material
Nano-sized CuO was obtained as a black powder from Plasma Chem, GmbH, Berlin, Germany. The crystalline material size of is 15–20 nm, a Brunauer–Emmett–Teller and has a specific surface area of 47 m2/g and a density of 6.3 g/cm3 by Brunauer–Emmett–Teller (BET) method, according to the datasheet of the manufacturer. The particles are crystalline with a density little below bulk (6.3 g/cm3). To check consistency with the supplier’s data, the primary particle size was determined using a Transmission Electron Microscope (TEM) Tecnai 12 G2 (FEI, Hillsboro, OR). Procedures for the choice of magnification, data binning, data analysis, and uncertainty estimates were applied as described previously (De Temmerman et al., Citation2014). A more detailed description on the characterization of the test material by TEM, X-ray diffraction, and surface chemistry is provided in the supplementary data file (Supplementary Figures 1–3).
Animals
Adult 8-week old male outbred rats (HsdCpb:WU) were obtained from a colony maintained under specific pathogen-free (SPF) conditions by Harlan, Netherlands. At arrival, the animals were weighed, randomly allocated, and housed with a minimum of two and a maximum of five animals in Macrolon IV type cages. The animals were acclimated for 1–2 weeks before starting the experimental protocol and were monitored daily for general health and almost continuously during the exposure period. During the acclimatization period, experiment animals were barrier maintained. Animals were weighted before the start of the exposure (an average weight of 332 ± 23 g with the weight randomly distributed over the exposure groups), before dissection and four times during the recovery period. Food and drinking water was provided ad libitum, except during the exposure. The animal experiments were conducted according to all applicable provisions of the Dutch national law: Experiments on Animals Act from 1997. This study was approved by an independent Animal Experimentation Ethical Committee. The experiments were conducted at the National Institute for Public Health and the Environment in Bilthoven, Netherlands under permit number 201300190.
Exposure protocol
Animals were exposed nose-only to a single generated exposure concentration of CuO NPs or to clean air as a control for 5 consecutive days. By placing the animals in the exposure set-up for various durations (18 min, 36 min, 90 min, 3 h, and 6 h), different dose levels were obtained. Animals exposed for duration shorter than 6 h to the nanomaterial aerosol were exposed to clean air for the remainder of the 6-h period. In this way, all animals were kept for 6 h in a nose-only tube and experienced equal time periods without for the absence of food and water. The C × T protocol has been described in OECD Guideline 403. A 6 h-concentration equivalent is derived by multiplying the duration of exposure by the exposure concentration (designated as dose C × T) and scaling it to the highest exposure duration of 6 h to 13.2 mg/m3 (for animals dedicated for toxicological examination) or 11.6 mg/m3 (for animals dedicated for organ burden analysis) (). To select a dose-range for this study, the pulmonary load following instillation studies was compared with the modeled pulmonary load based on primary characteristics of a test run with the CuO aerosol. Using the computational Multiple-Path Particle Dosimetry (MPPD) model (software version 2.1, www.arra.com/mppd) (Anjilvel & Asgharian, Citation1995), the pulmonary deposition fraction was estimated to be 0.06 and the tracheobronchiolar fraction 0.02 for a 10 mg/m3 aerosol with a density of 6.3 g/cm3, an mass median aerodynamic diameter (MMAD) of 1.5 μm and a geometric standard deviation (GSD) of 2.5 (Software settings: ‘deposition only’) (Supplementary Figure 4). After exposure for 6 h/day for 5 d using a rat inhalation rate of 0.01 m3/h, the pulmonary plus tracheobronchiolar load was estimated to be 0.23 mg. Although the dose rate and clearance can be very different following inhalation compared with instillation (Baisch et al., Citation2014), an approximate idea on the expected effects from a given instilled dose allowed us to calculate the optimum residence time of the rats in the nose-only tubes. The previously described mice inhalation studies provided information on a single dose level, and correspond to our mid-range dose level.
Table 1. Overview of exposure to CuO aerosol. The measured concentration as well as the derived 6 h-concentration equivalents are given per dose group.
Study design
A short-term inhalation study protocol has been applied with modifications compared with the so-called STIS protocol (Klein et al., Citation2012; Landsiedel et al., Citation2014; Ma-Hock et al., Citation2009). The main modifications were following a 5-d exposure period, lung burdens and toxicological examinations were assessed in two parallel groups (groups were studied with a shift of 1 d in exposure for logistical reasons). In addition, histopathology and BALF assessments were performed in the same animal 1 d after the final exposure, while NP lung burden assessment was measured and assessed in the parallel group. The remaining animals were assessed after a recovery period of 22 d (study day 28). Each group consisted of five animals. For the toxicological examinations, two additional concentration equivalent levels (six in total) were analyzed compared with the organ burden analysis. The study design is presented in Supplementary Table 1.
Aerosol generation
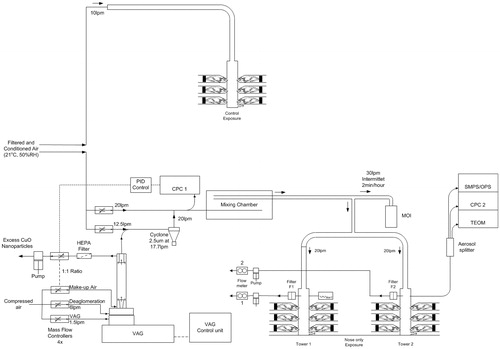
An aerosol was generated from the CuO powder using a Vilnius Aerosol Generator (EMMS, Worcestershire, UK). A cyclone (14.5 L/min, 2.5 μm, URG) was used to remove large particle agglomerates. The air was humidified before providing to the animals and during the exposure, the relative humidity and air temperature was measured. Control animals were exposed to filtered air. Particle number counts and size distributions were measured daily during the experimental period with a condensation particle counter CPC 3022 (TSI Inc., St. Paul, MN) and a scanning mobility particle sizer SMPS 3080 with 3081 Long DMA (TSI Inc., St. Paul, MN) in combination with OPS 3330 (TSI Inc., St. Paul, MN). The mass concentration was measured with a TEOM series 1400a (Rupprecht & Patashnick, Albany, NY). A time-weighted average exposure concentration was calculated from a continuous aerosol collection on 47 mm Teflon filters. A time weighted MMAD was determined using an eight-stage (+ after filter) cascade impactor MOI Model No. 110 (MSP Corp, Minneapolis, MN). A 1 mine sample was taken every half hour. A schematic representation of the aerosol generation is given in .
Figure 1. Schematic representation of the aerosol generation using the Versatile Aerosol Generator and animal exposure system. Test aerosol sampling for characterization was done 5 cm above the first set of animals.
Lung biochemistry and cell differentials
Animals were weighed before euthanization under ketamine (75–100 mg/kg)/xylazine (10 mg/kg) anesthesia. The abdomen and the thorax were opened and blood was withdrawn from the abdominal aorta with a syringe. A cannula was placed in the trachea and the diaphragm was opened. The left lung was clipped, while the right lung was flushed once using 26.7 mL/kg body weight of saline. The flush consisted of three up and down movements. Only BALF data with a recovery >60% of the total flush volume was included. The reason for lower recovery rates included accidental damage to the lung before or during flushing, which occurred in three out of 60 animals. The BALF was centrifuged at 400 × g at 4 °C for 10 min. Lactate dehydrogenase (LDH), alkaline phosphatase (ALP), N-acetylglucosaminidase (NAG), γ-glutamyltransferase (GGT), and total protein were measured using an auto-analyzer (LX20-Pro, Beckman-Coulter, Woerden, The Netherlands) according to the instructions of the manufacturer. The cell pellet was suspended in 1 mL of phosphate-buffered saline (PBS) for total cell counts (Coulter counter, Beckman-Coulter, Woerden, The Netherlands) and cell differential counts of 400 cells prepared as cytospins.
Hematology
EDTA blood was obtained from the abdominal aorta. Hematology was conducted according to the instructions of the manufacturer (Advia 120 Hematology Analyzer, Siemens Health Care, Erlangen, Germany). In each sample, the following parameters were recorded: hemoglobin, packed cell volume, red blood cell count, reticulocyte count, total white blood cell count, differential white blood cell count, thrombocyte count, mean corpuscular volume, mean corpuscular hemoglobin, and mean corpuscular hemoglobin concentration. No exposure-related changes were found in blood parameters (data not shown).
Pathology
The weight of organs (left lung, brain, kidneys, liver, spleen, and testes) of five animals of the non-recovery and recovery groups was determined prior to preservation in a neutral aqueous phosphate-buffered 4% solution of formaldehyde. The lungs were infused via the trachea with this fixative under a constant pressure of 20 cm water for 1 h. For histopathological examination, the above tissues as well as the mediastinal lymph nodes and nasal cavity including the olfactory bulb (seven levels) were embedded in paraffin wax, sectioned at 5 μm and stained with hematoxylin and eosin for the examination of histopathological alterations. Sections from the 28 d recovery group at each dose were additionally stained with picrosirius red to assess the presence of fibrosis.
The left lung (three levels), mediastinal lymph node, and nasal cavity (six levels, Woutersen et al., Citation1994) were analyzed for all doses of the main group and when changes were observed in the recovery group at the highest dose, animals receiving a lower exposure were also examined. For the other organs, only the control animals and the ones receiving the highest dose of the main group were examined and no changes were found. Therefore, for these organs, only the control and highest dose of the recovery group was examined.
Fibrosis
Hydroxyproline, a major component of collagen, was estimated in homogenates of lung tissue from animals at each exposure dose at study day 28. Lung tissue was homogenized in sterile water (100 mg tissue/mL), an equal volume of 12N HCl added, and hydrolyzed for 5 h at 120 °C. Samples were stored overnight at 4 °C before centrifugation at 10 000 g for 3 min. The supernatant was removed and stored at −80 °C until required. Fifty microliters of each supernatant (in duplicate) were added to wells of a 96-well plate and allowed to dry at 60 °C. The hydroxyproline content was then estimated using a kit (Sigma Hydroxyproline Assay Kit MAK008-1KT, Sigma, St. Louis, MO) according to the instructions of the manufacturer. Separate sets of wells were included which were ‘spiked’ with a known concentration of hydroxyproline to correct for interference in the assay. A standard curve consisting of serial dilutions of hydroxyproline was used to determine the concentration of the unknowns using the calculation outlined below:
Calculate the concentration of hydroxyproline: Sa/Sv = C
Sa = amount of hydroxyproline in unknown sample (μg) from standard curve; Sv = sample volume (μL) added into the wells; C = concentration of hydroxyproline in sample
Calculate the amount of hydroxyproline/mg tissue: hydroxyproline (μg/ml)/sample weight (mg)
Calculate the collagen concentration (μg/mg tissue): hydroxyproline (μg/ml) × 100/13.5
Organ burden analysis
Organs were weighed and kept on dry ice during dissection and freeze dried (Christ Alpha 1, Newtown, UK). Blood and bone marrow were kept on dry ice and frozen at −80 °C. Procedural blanks were prepared in similar vessels were used for the organs to control the minimize contamination. Ceramic instruments were used where possible and disposable materials were not re-used to avoid contamination. Freeze-dried lung, liver, spleen, and heart were manually crushed into a powder allowing for a better digestion with acid. The copper content in the lung was determined for four doses in the on-recovery day 6 and 28 groups. For the other organs, blood and bone marrow, the control and highest exposed animals of the day 6 and 28 groups were analyzed. Microwave assisted acid digestion of samples was performed by adding a diluted acid mixture (HNO3:H2O2:H2O – 2:1:3) and applying heating as recommended by the producer (MARS V, CEM): ramp to 140 °C in 5 min, hold time 1 min; ramp to 180 °C in 8 min, hold time 2 min; ramp to 200 °C in 4 min, hold time 10 min. After heating, the sample solutions were diluted and analyzed by inductively coupled plasma mass spectrometry equipped with a dynamic reaction cell (DRC-ICP-MS NexION 300D, Perkin Elmer, Waltham, MA) and ammonia was used as the reagent gas. For the quantification of copper, isotope 65Cu was selected because it is less affected by polyatomic interferences (e.g. 40Ar23Na) than isotope 63Cu (Hsiung et al., Citation1997). Samples were analyzed by external calibration method using a multi-point curve (blank and six points from 0.5 to 25 μg/L), with the exception of bone marrow which was analyzed by standard addition method to overcome the matrix interference found (Cuadros-Rodríguez et al., Citation2007). Rhodium at 10 μg/L was chosen and added as an internal standard element.
Short-term nanoparticle stability characterization
Gamble’s solution and artificial lysosomal fluid (ALF) were prepared as described previously (Marques et al., Citation2011) and pre-warmed at 37 °C. CuO NP dispersions were prepared in these solutions at a concentration of 100 mg/L by sonicating in a water bath for 15 min. After 1 and 24 h at 37 °C, each 15 mL dispersion in Gamble’s or ALF was centrifuged (4000 g for 30 min) within centrifuge using tubes with centrifugal filter units (Amicon Ultra-15, 10 kDa, Millipore, Billerica, MA) to separate the solid particles from the solution. A volume of 1 mL of HNO3 was added to 9 mL of CuO NP dispersion in Gamble’s or ALF at 100 mg/L and to 9 mL of ultrafiltered solution, in order to homogenize the samples before chemical analysis. Similarly, a blank was prepared without NPs. The Cu content was determined by inductively coupled plasma optical emission spectrometry (ICP-OES) 1 and 24 h after preparation. The short-term stability of CuO NPs in both Gamble’s and ALF solutions was assessed by dynamic light scattering (DLS) and at 0, 1, 4, and 24 h after preparation. Moreover, electrophoretic light scattering (ELS) was measured by means of a multi-angle Nicomp ZLS Z3000 (Particle Sizing System, Port Richey, FL). Prior to DLS and ELS analysis, each dispersion was sonicated with an ultrasonic bath (Falc Instruments s.r.l., Bergamo, Italy) at 50 kHz for 15 min. The hydrodynamic diameter of CuO NPs was measured at 0, 1, 4, and 24 h after preparation. An optical fiber set at 90° scattering angle, using a 25-mW laser and a wavelength of 639 nm was employed. The surface charge of the electric double layer of CuO NPs was acquired by ELS, obtaining Zeta potential (ζ-pot) values of CuO NPs at time point 0, using the Smoluchowski equation (Jiang et al., Citation2009). A 5 V electric field was applied and ζ-potential was obtained from the mean phase shift with respect to time. A ζ-pot of at least ±30 mV is normally required to achieve a stable colloidal dispersion (Jiang et al., Citation2009). A ζ-pot of at least ±30 mV is normally required to achieve a stable colloidal dispersion. A multi-angle Nicomp ZLS Z3000 (Particle Sizing System, Port Richey, FL) was employed to calculate both hydrodynamic diameter and ζ-potential.
Statistics
Copper levels in the different organs were analyzed by two-way ANOVA using Sidak’s multiple comparison test Clinical pathology parameters (BALF cytology and enzyme data) were log transformed and analyzed by two-way ANOVA using Tukey’s multiple comparison test.
Benchmark dose–response analysis was performed using PROAST (version 50.7 www.rivm.nl/proast). Dose–response models were fitted to the data, a BMR was defined, and the lower and upper 95%-confidence limits (one sided, BMDL and BMDU, respectively) of the associated benchmark doses were derived from the fitted model as previously described (Gosens et al., Citation2015). A detailed description is provided in the Supplemental information. When applying this statistical analysis, a predetermined effect size in a certain endpoint compared with control animals was chosen. Preferably this was based on a known physiologically relevant response, and otherwise defaults were used (EFSA, Citation2009). A BMR of 5% change in response was chosen for organ and body weight changes (as small changes in weight can already be indicative for toxicity). For the analysis of the total number of cells and BALF clinical chemistry, a BMR of 100% change was chosen (Gosens et al., Citation2014). For effects on the fraction of differential cell types, the BMR was set to 20% extra risk (Gosens et al., Citation2015). For the (ordinal) histopathology data, the BMR was set to 50% risk (i.e. the EC50 value), indicating the concentration at which the typical (or average) animal develops the considered lesion of a predefined severity (Slob, Citation1999; Slob et al., Citation2014). Both the cell type and histopathology data were analyzed using latent variable models to allow the (quantal) dose–response to level off below a fraction of 1.0 (Appel et al., Citation2001).
Results
Characteristics of the CuO powder and the generated aerosol
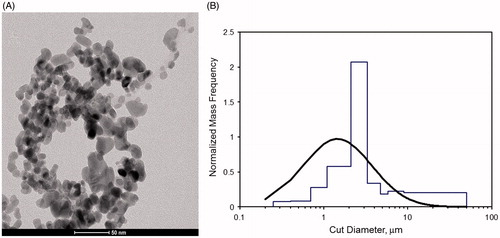
The CuO NP had a particle size (mode) of 10 nm (9.2–14 nm – first and third quartile respectively) based on TEM analysis () which was slightly smaller than the manufacturer’s data. XRD analysis showed the characteristic diffraction of monoclinic CuO phase with an average diameter of crystallites of 9.3 nm. XPS investigation highlighted the presence of copper (Cu), oxygen (O), and also carbon (C), the latter indicating a contamination on the surface of the powder. Most of the copper was actually in the CuO form (core as well as surface), but there was also a non-negligible presence of hydroxides of copper, as a result of exposure of the powder to air. Using a target concentration of 10 mg/m3 resulting in an MMAD of 1.45 μm and a GSD of 2.57 is within the recommended range by OECD Guidelines (OECD, Citation2009) (). The measured aerosol concentrations were averaged over the 5-d exposure period and were slightly above the target concentration () with an average particle number concentration of 3.2 (sd of 2.4) 104 particles/cm3. The different concentration equivalent levels for animals dedicated to toxicological examinations and organ burden analysis are given in .
Figure 2. (A) TEM image of nano-sized CuO particles. (B) Particle size distribution of the aerosol (based on multi-orifice cascade impactor data).
CuO NP toxicokinetics
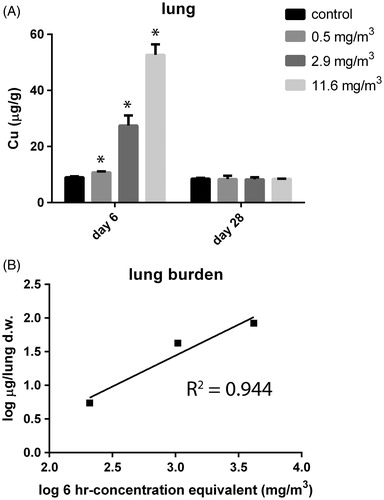
Organ burdens were assessed 1 d after the last exposure (day 6) as well as after the recovery period (day 28) expressed in μg Cu/g dry tissue (Supplementary Figure 5). The varied concentration equivalents resulted in a different Cu dose in the lung at day 6 (). The measured lung burden was compared with the modeled burden at day 6 using MPPD software by the combined tracheobronchiolar and pulmonary deposition based on the actual aerosol concentration of 11.6 mg/m3 (highest exposure for the animals dedicated for burden analysis) and the aerosol characteristics as mentioned above (Supplementary Figure 4). Using a similar calculation as described in the Materials and methods section but including clearance assuming a retention half-time of 60 d, applicable for poorly soluble particles (Oberdorster, Citation2002), a lung burden of 0.2 mg at day 6 was estimated. The measured lung burden was linear with the increasing equivalent concentration (). The measured total load for the highest exposed group, 1 d after the final exposure, was 0.085 mg per lung. This was only 43% of the modeled lung burden. Within the 22 d recovery period, Cu was cleared completely from the lung and levels returned to baseline (). Therefore, the CuO NPs do not follow the kinetics of poorly soluble particles.
Figure 3. (A) Lung burden (in μg/g organ dry weight) was assessed at day 6, 24 h after the last exposure and after a recovery period of 22 d (day 28) in control animals and animals exposed to 11.6 mg/m3 CuO for 5 consecutive days. The dose levels were calculated and are expressed as 6-h concentration equivalents in mg/m3. p < 0.05 compared with control. (B) Linear relationship for measured lung burden. The burden for the tracheobronchiolar and alveolar region for the highest exposed group is 0.085 mg per total dry whole lung.
To examine the solubility of CuO NPs, dissolution was determined in Gamble’s solution (pH 7.4) and ALF (pH 4.5) (). At pH 7.4, around 2% of CuO was present as Cu2+ ions. However, at a lower pH, representative of the internal milieu of phagocytizing cells, 60% of CuO NPs mass rapidly dissolved within 1 h (). During the dissolution measurements, the hydrodynamic diameter and ζ-potential of the CuO NPs was determined by DLS and ELS, in both Gamble’s solution (Supplementary Table 2) and ALF (Supplementary Table 3). In Gamble’s solution, particle agglomeration was observed, reaching approx. 1 μm, followed by sedimentation, due to the presence of salts, primarily NaCl and NaHCO3. After 24 h, no particle size distribution could be determined due to a low-intensity signal from the DLS. ζ-potential values suggested the high instability of the dispersions (−5 ± 0.4 mV), confirming agglomeration and sedimentation of CuO NPs. In ALF, CuO NPs dissolved very quickly and, therefore, the hydrodynamic particle size distribution could only be determined at time point 0, directly after preparing the suspensions. A bi-modal size distribution was observed at time point 0: 8% of CuO NPs had an average size of 48 ± 8 nm and 92% reached an average size of 231 ± 51 nm. In this case, ζ-potential values could not be obtained due to the relatively rapid dissolution rate (from seconds to minutes), confirmed also by the intensity values of DLS (Supplementary Table 3).
Table 2. Dissolution of CuO nanoparticles in Gamble’s solution and artificial lysosomal fluid (ALF) determined by ICP-OES.
No exposure-related increases above background Cu levels were observed in organs other than lungs, such as liver, blood, bone marrow, brain, heart, kidney, and spleen (Supplementary Figure 5A–G). A slight decrease in Cu levels was found in the liver after the recovery period. This is most probably related to a non-statistically significant increase in liver weight in the recovery group (data not shown).
Toxicological assessment
General toxicity, organ weights, and histopathological changes
CuO NP exposure did not lead to general signs of toxicity, behavioral effects, or mortality observed during the 5-d exposure period and recovery period. Dose–response analysis using the benchmark dose approach indicating that there were no exposure-dependent changes in body weight or in absolute brain, liver, spleen, kidney, and testis weights (Supplementary Table 4).
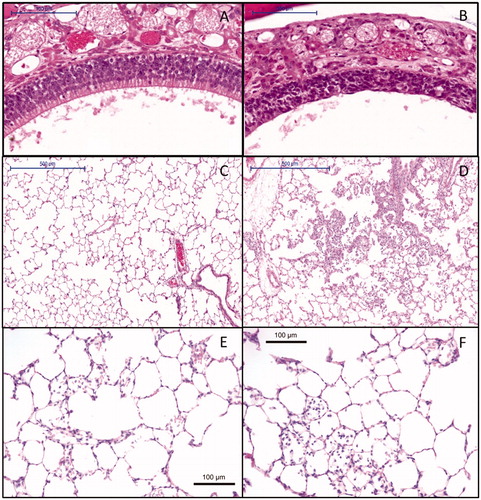
Macroscopic observation at necropsy at day 6 revealed patchy lungs in three animals (out of five) exposed to 6.3 mg/m3 and 13.2 mg/m3 (data not shown). A 5% increase in absolute lung weights was estimated using the benchmark approach for a 6 h-concentration equivalent level between 0.2 and 0.3 mg/m3. The effect occurred below the lowest dose investigated and was still present after the recovery period (Supplementary Table 4). Microscopic evaluation of the respiratory tract revealed degeneration of the olfactory epithelium (). In the lungs, exposure-related alveolitis (), bronchiolitis (Supplementary Table 5), and vacuolation of respiratory epithelium of the airways (Supplementary Table 5) were also observed starting at a concentration equivalent of 2.4 mg/m3. A marked increased cellularity in the medulla and paracortex of the mediastinal lymph node was noted (Supplementary Table 5). After the recovery period, limited inflammation in the lung was still observed in the highest exposure group (Supplementary Table 6 and Figure 4E and F). In only one out of five animals, there was still an increased cellularity in the lymph node (Supplementary Table 6). The other effects in the lung and nose had resolved at day 28.
Figure 4. Histopathology of (A) control animal at day 6 with normal olfactory epithelium (10× magnification), (B) degeneration of the nose olfactory epithelium at day 6 at a 6-h concentration equivalent of 13.2 mg/m3 (10× magnification), (C) control animal at day 6 with normal lung alveoli (5× magnification), (D) lung alveolitis at day 6 after exposure to 13.2 mg/m3 (5× magnification), (E) minimal residual inflammatory reaction after recovery period of three weeks 22 d post-exposure to 13.2 mg/m3. Note: cellularity in alveoli and thickened alveolar walls (20× magnification). (F) Minimal residual inflammatory reaction after recovery period of three weeks 22 d post-exposure to 13.2 mg/m3. Note: alveolar macrophages in alveoli at 20× magnification.
No fibrotic changes were detected at day 28 based on lung hydroxyproline concentration determinations in the three highest exposure groups compared with the control (Supplementary Figure 6). Also, collagen-specific picrosirius red stainings in control and exposed rats from the recovery groups did not show any fibrosis (Supplementary Figure 7). As a positive control for the staining, mice which were treated with bleomycin were used, generating fibrotic changes especially when visualized using polarized light microscopy (Supplementary Figure 7).
No treatment-related histopathological changes were visible in the brain, olfactory bulb, spleen, liver, and kidney in the control and highest exposed animals of the main and recovery group (data not shown).
Inflammation and cellular damage
Inflammatory markers as well as markers for cellular damage were assessed in the BALF at day 6 and day 28 (). Exposure to CuO NPs induced a clear exposure-related increase in the total cell number, number of macrophages, neutrophils, and lymphocytes as well as in the presence of total protein, LDH, ALP, NAG, and GGT. The increase in the total number of cells and the number of macrophages were still evident in the recovery group, although a clear reduction was noted with the one but highest dose being. At 6.3 mg/m3, this increase was still statistically significant. All other BALF parameters returned to baseline levels after the recovery period. A small increase in the number of eosinophils was observed in CuO NP-exposed animals at two dose levels only at day 6 and this was not dose related.
Table 3. BALF parameters mean and sd (n = 5) at day 6 and day 28 after 5 d of exposure.
The inflammatory and cellular damage markers were analyzed by the benchmark dose approach (Supplementary Table 4). Clear dose-dependent increases in LDH () and total cell concentrations () were observed at day 6 which was indicated by the black circles, while no effect was seen in the recovery groups (red triangles). These curves were generated for all endpoints and from these, the lower (BMDL) and upper (BMDU) limits of the confidence interval (c.i.) of the benchmark dose inducing a predefined benchmark response were derived. A 100% increase in total protein (c.i. 0.35–0.60 mg/m3), ALP (c.i. 1.0–2.8 mg/m3), LDH (c.i. 0.12–0.28 mg/m3), NAG (c.i. 1.9–2.5 mg/m3), and GGT (c.i. 0–0.13 mg/m3) levels in BALF was established at day 6. The changes in all cell damage markers returned to baseline levels fully recovered. In contrast, total protein and NAG levels were increased after the recovery period. For total protein and NAG, it might seem that a dose–response is present in the recovery group (Supplementary Table 4), but the c.i. lies at higher extrapolated doses than the highest one applied (36.3 mg/m3 – infinitive and 17.6 mg/m3 – infinitive, respectively) suggesting that this is, therefore, not considered as an effect. The c.i. leading to a 20% increase in macrophages and neutrophils lies between 0 and 0.22 mg/m3, and 0 and 0.35 mg/m3, respectively (). This means that these endpoints are very sensitive, and that, in this case, it is not possible to derive a BMDL for risk assessment purposes (Supplementary Table 4). The benchmark response in the total number of cells was set to a 100% increase and the c.i. at which this occurred lies between 0.16 and 0.29 mg/m3. This is also a very sensitive endpoint, since this interval is below the lowest 6 h-concentration equivalent of 0.6 mg/m3. In addition, the effect was still present after the recovery period (c.i. 9.2–23.6 mg/m3). No exposure-dependent changes were observed for the percentage eosinophils and lymphocytes at a benchmark response of 20%, while the total number of lymphocytes was significantly elevated in the two-way ANOVA.
Figure 5. Dose–response curves and summary of BMDs as point of departure for risk assessment and sensitive endpoint analysis. (A) Dose–response curve for the LDH content in BALF in the main group (circles) and recovery groups (triangles). Parameterization: a = 78, b = 34, and c = 148. (B) Dose–response curve for the total cell concentration in the BALF in the main group (circles) and recovery groups (triangles). Parameterization: a = 0.396, b= 14.47, and c= 73.6. (C) Dose–response curves for the fraction of neutrophils in BALF in the main group (circles) and recovery groups (triangles). Parameterization: a = 0.5256, b = 26.77, and c = 0.0846. (D) Summary of the derived BMDs and confidence interval for all endpoints for which a dose–response was found in the main groups. The dose levels are expressed as 6-h concentration equivalents in mg/m3 on a log scale. MP, macrophages; PMN, neutrophils.
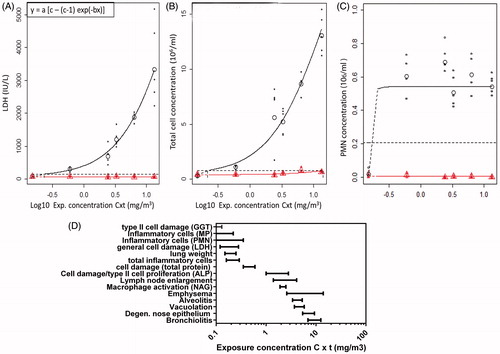
When comparing the BMDL values of all endpoints determined on day 6, the most sensitive parameter for risk assessment can be assessed (). The biochemical markers and inflammatory cell number released in the BALF after lung damage were the most sensitive parameters as indicators for lung toxicity. The BMDL can be used as point of departure for risk assessment (EFSA, Citation2009).
Discussion
This short-term inhalation study demonstrated that CuO NPs induced a dose-dependent lung inflammation, 1 d after a 5-d inhalation regime as well as histological alterations of the nose epithelium. Three weeks later the inflammation had mostly resolved, leaving a small but significant elevation of macrophages in the airspace. This inflammation was not accompanied by pathological changes or elevated biochemical markers of fibrosis, or was it associated with detectable translocation to other organs.
Lung burden, particle dissolution, and clearance from the lung
Repeated exposures to CuO NP via inhalation resulted in a linear increase in the measured lung burden, determined the day after the last exposure. Since this burden includes clearance, it reflects the retained dose in the lung rather than the deposited dose.
Based on the dissolution results in Gamble’s solution and in ALF, dissolution is not likely to happen upon direct contact with the lung lining fluid after deposition in the lung. Once CuO NPs are taken up by macrophages, the acidic environment in the lysosome is far more likely to induce dissolution and subsequent rapid removal from the lung. The exact lung clearance rate has not been determined here, but 60% of CuO NPs dissolved within the first hour at an acidic pH and this percentage did not change after 24 h. The dissolution rate in vivo depends on the speed of macrophage uptake and should be regarded overall as a fast process, more likely in terms of hours and not days. Based on the fact that Cu levels in the lung returned to baseline values within the 22 d recovery period, clearance was more rapid than the 60 d half-time that have been established for poorly soluble particles (Oberdorster, Citation2002). Hirano et al. (Citation1993) has determined the clearance rate of micron sized CuO particles (< 3 μm) after intratracheal instillations in rats and found that, after solubilization in the bronchoalveolar milieu, the half-time was 37 h. The nano-sized fraction is not known in that study. In summary, we hypothesize that the CuO NPs were cleared from the lung over the 22 d post-exposure period via a combination of macrophage clearance and dissolution.
Toxicological assessment
The CuO NPs were acutely inflammogenic to the lungs at all applied dose levels based on total BALF cell numbers, number of neutrophils, and lymphocytes. The dose-dependent increase in the total number of macrophages matches the increased levels of NAG (activation of macrophages), while increased levels in ALP indicated proliferation of pneumocyte type II cells (Capelli et al., Citation1997; Henderson, Citation2005). Exposure to CuO NP also led to acute cellular damage based on increases in total protein (resulting from vascular leakage), LDH, and GGT activities. The latter is released when alveolar type II epithelial cells and/or Clara cells are damaged (Jean et al., Citation2003).
These inhalation neutrophilic, ALP, LDH, and protein responses were comparable with intratracheal instillations using CuO NP smaller than 50 nm (Cho et al., Citation2010; Rani et al., Citation2013),. Hirano et al. also found dose-dependent increases in BALF LDH and inflammatory cells for micron-sized CuO particles. Unlike Cho et al., we did not observe a dose-dependent eosinophilic granulocyte response. In their study, female Wistar rats were chosen, while we used male Wistar rats. Eosinophilic granulocytes are involved in the pathogenesis of asthma and gender differences in asthmatic patients are known, with females being more susceptible than males potentially via interference of sex hormones on the immune function (Melgert et al., Citation2007).
We observed a strong increase in the number of macrophages the day after the last day of exposure, and this response did not completely return to baseline levels after the recovery period of 22 d. In contrast, the neutrophilic response and cellular damage did show total resolution at all dose levels. The inflammatory response reported here did not result in a pulmonary pro-fibrotic response during the recovery phase. Rani et al., however, claim to observe fibrosis 1 d and 1 week after a single instillation of 1 mg and 5 mg/kg body weight (corresponding to 0.2 and 1 mg/rat) (Rani et al., Citation2013) which is higher than the highest lung burden of 0.085 mg/rat used here. During the instillation, their dose was delivered instantaneously to the lung and was much higher compared with the lung burden of 0.085 mg/rat in the highest dose group applied here. They used a substantially higher dose rate that may overwhelm clearance and host defense mechanisms. In addition, no specific quantification for hydroxyproline or collagen stainings on the histopathological sections were done in that study and the light microscopy photos were of poor quality in general, so this makes their study questionable. In addition, the formation of fibrosis is generally not an acute process.
Deposition modeling also showed a high deposited fraction (up to 50%) in the upper respiratory tract and this provides an explanation of why besides acute lung effects, we also found degenerative effects in the nose. No additional effort was taken to break up agglomerates of NPs in the generated aerosol. Therefore, we believe that this exposure is relevant for potential workplace related exposure when handling the material.
Systemic effects
Besides effects in the nose and lung, no other organs under study were affected based on histological analysis and organ weights. To our knowledge, none of the experimental studies on pulmonary exposure to CuO NP reported in the scientific literature have included (descriptions of) examinations of systemic effects. For workers who are grinding or sieving copper, exposure to copper dust led to systemic effects like gastrointestinal irritation, hepatic effects, and possible neurological and reproductive effects. Since the exposure was poorly characterized and a control group was not included in the clinical trial, the relation between copper levels (and their specific chemical characteristics) and clinical effects remains unclear (Suciu et al., Citation1981). Apart from toxic effects, the element copper is an essential nutrient needed for normal functioning of the body. Excess intake (mainly known for the oral route) of copper that exceeds tolerated levels may lead to hemolysis, jaundice, and eventually death (Ingle et al., Citation2014). Cu NPs of 23.5 nm, administered via oral gavage to mice (a LD50 value of 413 mg/kg body weight), resulted in liver, kidney, and spleen damage (Chen et al., Citation2006). The absence of noticeable systemic toxicity in the present study seems to be explained by the lack of any increase in Cu levels compared with background levels in the liver, kidney, and spleen among others at the applied exposure levels. Further work is being conducted to look at sub-lethal effects on these distal organs, including evidence of pro-inflammatory cytokine expression and oxidative stress (manuscript in preparation).
Mechanism of toxicity and implications for risk assessment
In general, increased dissolution of particles is seen with decreased particle size and increased surface area. In vitro studies using lung cells have suggested a role for dissolved Cu ions in explaining the toxicity of CuO NPs of different sizes. However, there is also a role for the nanoparticle as such as recently reviewed by Ahamed et al. In general, increased dissolution of particles is reported in the literature with decreased particle size and increased surface area (Borm et al., Citation2006). In vitro studies using lung cells have suggested a role for dissolved Cu ions to explain the toxicity of CuO NPs of different sizes. However, there is also a role for the NP as such as recently reviewed by Ahamed et al. (Citation2015). CuO NPs were cytotoxic to different lung epithelial cell lines (A549, HBEC, and BEAS-2B cells) and most studies measured reactive oxygen species (ROS) that overwhelmed the cells antioxidant defenses (Ahamed et al., Citation2015; Jing et al., Citation2015). In our in vivo study, we did not specifically address the mechanism of action, but based on the dissolution results in artificial media and lung burden measurements, we propose that CuO NP dissolution occurs in the acidic environment of lysosomal compartments of macrophages rather than in lung lining or tissue fluid. This allows clearance of the particles but also increased bioavailability of toxic Cu ions which then may induce activation of the immune response and cellular damage. In a previous study, a comparison of intratracheal instillations of micron-sized CuO particles to a copper salt (CuSO4) indicated no significant difference in the acute inflammatory potency between the initial insoluble particles and the soluble copper salt (Hirano et al., Citation1993). Although it was not the goal of our study and we did not include a direct comparison to a copper salt or to micrometer-sized CuO particles, for risk assessment purposes, it would be helpful to assess whether the toxicity of CuO NP can be extrapolated from the toxicity data of micrometer-sized Cu or CuO particles or copper salts. This could be partly based on comparative solubility in different environments or by exposing lung macrophages in vitro. Some of these aspects will be addressed in the overarching EU project of which this study was also part by exposing lung macrophages in vitro.
For the risk assessment of the acute local effects observed here, we propose to use sensitive endpoints like lung cellular damage and lung inflammation. We consider the BMDL being the low end of the 90% confidence interval as starting point for a risk assessment. The BMDL of LDH of 0.12 mg/m3 (Supplementary Table 4) as a general marker of cellular damage is one of the most sensitive markers indicative for tissue damage for which a BMDL could be derived. This was not the case for the even more sensitive type II epithelial cell damage marker GGT, since a maximum response was already observed at the lowest dose applied and the BMDL lies somewhere between 0 mg/m3 and the BMDU. Since the cellular damage was reversible, while the inflammatory response was not completely reversible (based on the increased total number of inflammatory cells in the BALF and visible remnants of inflammation in the recovery group), we propose to use a marker of inflammation as point of departure. A neutrophil response has been identified before as a valuable and sensitive endpoint for lung injury, also from a mechanistic point of view (Pauluhn, Citation2010; Oberdorster, Citation1995). However, in this study, the point of departure could not be determined for neutrophils as it lies below the BMDL, suggesting that future studies should apply a lower dose level (). A maximum neutrophil response was observed at the lowest dose applied here. The total number inflammatory cells (BMDL of 0.16 mg/m3) might be considered as an alternative in view of the relationship with the neutrophil response. Moreover, the total number of inflammatory cells was not completely resolved after a recovery period of 22 d (BMDL of 9.2 mg/m3).
Conclusion
A clear dose-dependent increase in lung inflammation, cellular damage, and nose epithelium degeneration was found after a 5-d consecutive exposure to CuO NPs. After a 6-h exposure for 5 d to 13.2 mg/m3, the lung inflammation was not completely reversible over 22 d as macrophages and cell infiltrations were still present after a 6-h exposure for 5 d to 13.2 mg/m3, but the inflammation did not lead to a fibrotic response.
Supplementary material available online
Supplementary Tables S1–S6 and Figures S1–S7
Supplementary Materials
Download MS Word (30.9 MB)Acknowledgements
The authors would like to thank M. V. W. Wijnands for the histopathological examinations, and E. H. J. M. Jansen, D. L. A. C. Leseman, R. F. Vlug, J. C. Strootman, C. M. R. Soputan, M. P. van den Hurk, J. Rigters, P. K. Beekhof, B. Nagarajah, D. Pantano, G. van der Horst, L. J. J. de la Fonteyne, H. J. M. Schreutelkamp, H. J. Heusinkveld, S. Dekkers, A. J. F. Boere, and P. H. B. Fokkens for their help during the conduction of the animal experiment and valuable technical assistance. The authors also thank A. J. F. Boere for critically reading the manuscript.
Declaration of interest
The authors report that they have no conflicts of interest. The authors alone are responsible for the content and writing of the paper. This work was supported by the SUN project, Grant agreement no. 604305, funded by the EC Seventh Framework Program FP7-NMP.2013.1.3-1 and by the RIVM Strategic Research Program (SPR, E/121504).
References
- Ahamed M, Akhtar MJ, Alhadlaq HA, Alrokayan SA. 2015. Assessment of the lung toxicity of copper oxide nanoparticles: current status. Nanomedicine (Lond) 10:2365–77
- Ahamed MAH, Alhadlaq HA, Khan MaM, Karuppiah P, Al-Dhabi NA. 2014. Synthesis, characterization, and antimicrobial activity of copper oxide nanoparticles. J Nanomater 2014:1–4
- Anjilvel S, Asgharian B. 1995. A multiple-path model of particle deposition in the rat lung. Fundam Appl Toxicol 28:41–50
- Appel MJ, Bouman HGM, Pieters MN, Slob W. 2001. Evaluation of the applicability of the Benchmark approach to existing toxicological data. Framework: Chemical compounds in the working place RIVM
- Armstrong CW, Moore LW Jr, Hackler RL, Miller GB Jr, Stroube RB. 1983. An outbreak of metal fume fever. Diagnostic use of urinary copper and zinc determinations. J Occup Med 25:886–8
- Baisch BL, Corson NM, Wade-Mercer P, Gelein R, Kennell AJ, Oberdorster G, Elder A. 2014. Equivalent titanium dioxide nanoparticle deposition by intratracheal instillation and whole body inhalation: the effect of dose rate on acute respiratory tract inflammation. Part Fibre Toxicol 11:5
- Ben-Moshe T, Dror I, Berkowitz B. 2009. Oxidation of organic pollutants in aqueous solutions by nanosized copper oxide catalysts. Appl Catal B: Environ 85:207–11
- Bhaumik A, Haquea A, Karnatia P, Taufiquea MFN, Patelb R, Ghosh K. 2014. Copper oxide based nanostructures for improved solar cell efficiency. Thin Solid Films 572:126–33
- Borm P, Klaessig FC, Landry TD, Moudgil B, Pauluhn J, Thomas K, et al. 2006. Research strategies for safety evaluation of nanomaterials. Part V: role of dissolution in biological fate and effects of nanoscale particles. Toxicol Sci 90:23–32
- Brandon EF, Bulder AS, Van Engelen JG, Mahieu CM, Mennes WC, Pronk ME, et al. 2013. Does EU legislation allow the use of the Benchmark Dose (BMD) approach for risk assessment? Regul Toxicol Pharmacol 67:182–8
- Capelli A, Lusuardi M, Cerutti CG, Donner CF. 1997. Lung alkaline phosphatase as a marker of fibrosis in chronic interstitial disorders. Am J Respir Crit Care Med 155:249–53
- Chen Z, Meng H, Xing G, Chen C, Zhao Y, Jia G, et al. 2006. Acute toxicological effects of copper nanoparticles in vivo. Toxicol Lett 163:109–20
- Cho WS, Duffin R, Poland CA, Howie SE, Macnee W, Bradley M, et al. 2010. Metal oxide nanoparticles induce unique inflammatory footprints in the lung: important implications for nanoparticle testing. Environ Health Perspect 118:1699–706
- Cuadros-Rodríguez L, Bagur-González MG, Sánchez-Viñas M, González-Casado A, Gómez-Sáez AM. 2007. Principles of analytical calibration/quantification for the separation sciences. J Chromatogr A 1158:33–46
- De Temmerman PJ, Lammertyn J, De Ketelaere B, Kestens V, Roebben G, Verleysen E, Mast J. 2014. Measurement uncertainties of size, shape, and surface measurements using transmission electron microscopy of near-monodisperse, near-spherical nanoparticles. J Nanopart Res 16:1–22
- EFSA. 2009. Guidance of the Scientific Committee on a request from EFSA on the use of the benchmark dose approach in risk assessment. EFSA J 1150:1–72
- Evans P, Matsunaga H, Kiguchi M. 2008. Large-scale application of nanotechnology for wood protection. Nat Nanotechnol 3:577
- Filipsson AF, Sand S, Nilsson J, Victorin K. 2003. The benchmark dose method-review of available models, and recommendations for application in health risk assessment. Crit Rev Toxicol 33:505–42
- Geiser M, Kreyling WG. 2010. Deposition and biokinetics of inhaled nanoparticles. Part Fibre Toxicol 7:2
- Gosens I, Kermanizadeh A, Jacobsen NR, Lenz AG, Bokkers B, De Jong WH, et al. 2015. Comparative hazard identification by a single dose lung exposure of zinc oxide and silver nanomaterials in mice. PLoS One 10: e0126934
- Gosens I, Mathijssen LE, Bokkers BG, Muijser H, Cassee FR. 2014. Comparative hazard identification of nano-and micro-sized cerium oxide particles based on 28-day inhalation studies in rats. Nanotoxicology 8:643–53
- Henderson RF. 2005. Use of bronchoalveolar lavage to detect respiratory tract toxicity of inhaled material. Exp Toxicol Pathol 57:155–9
- Hirano S, Ebihara H, Sakai S, Kodama N, Suzuki KT. 1993. Pulmonary clearance and toxicity of intratracheally instilled cupric oxide in rats. Arch Toxicol 67:312–17
- Hsiung CS, Andrade JD, Costa R, Ash KO. 1997. Minimizing interferences in the quantitative multielement analysis of trace elements in biological fluids by inductively coupled plasma mass spectrometry. Clin Chem 43:2303–11
- Ingle AP, Duran N, Rai M. 2014. Bioactivity, mechanism of action, and cytotoxicity of copper-based nanoparticles: a review. Appl Microbiol Biotechnol 98:1001–9
- Jean J, Liu Y, Joyce-Brady M. 2003. The importance of gamma-glutamyl transferase in lung glutathione homeostasis and antioxidant defense. Biofactors 17:161–73
- Jiang J, Oberdorster G, Biswas P. 2009. Characterization of size, surface charge, and agglomeration state of nanoparticle dispersions for toxicological studies. J Nanopart Res 11:77–89
- Jing X, Park JH, Peters TM, Thorne PS. 2015. Toxicity of copper oxide nanoparticles in lung epithelial cells exposed at the air–liquid interface compared with in vivo assessment. Toxicol in Vitro 29:502–11
- Kim JS, Adamcakova-Dodd A, O'shaughnessy PT, Grassian VH, Thorne PS. 2011. Effects of copper nanoparticle exposure on host defense in a murine pulmonary infection model. Part Fibre Toxicol 8:29
- Klein CL, Wiench K, Wiemann M, Ma-Hock L, Van Ravenzwaay B, Landsiedel R. 2012. Hazard identification of inhaled nanomaterials: making use of short-term inhalation studies. Arch Toxicol 86:1137–51
- Koivisto AJ, Aromaa M, Koponen IK, Fransman W, Jensen KA, Mäkelä JM, Hämeri KJ. 2015. Workplace performance of a loose-fitting powered air purifying respirator during nanoparticle synthesis. J Nanopart Res 17:177
- Kuhlbusch TA, Asbach C, Fissan H, Gohler D, Stintz M. 2011. Nanoparticle exposure at nanotechnology workplaces: a review. Part Fibre Toxicol 8:22
- Landsiedel R, Ma-Hock L, Hofmann T, Wiemann M, Strauss V, Treumann S, et al. 2014. Application of short-term inhalation studies to assess the inhalation toxicity of nanomaterials. Part Fibre Toxicol 11:16
- Longano D, Ditaranto N, Cioffi N, DiNiso F, Sibillano T, Ancona A, et al. 2012. Analytical characterization of laser-generated copper nanoparticles for antibacterial composite food packaging. Anal Bioanal Chem 403:1179–86
- Ma-Hock L, Burkhardt S, Strauss V, Gamer AO, Wiench K, Van Ravenzwaay B, Landsiedel R. 2009. Development of a short-term inhalation test in the rat using nano-titanium dioxide as a model substance. Inhal Toxicol 21:102–18
- Marques MRC, Loebenberg R, Almukainzi M. 2011. Simulated biological fluids with possible application in dissolution testing. Dissolut Technol 18:15–28
- Melgert BN, Ray A, Hylkema MN, Timens W, Postma DS. 2007. Are there reasons why adult asthma is more common in females? Curr Allergy Asthma Rep 7:143–50
- Oberdorster G. 1995. Lung particle overload: implications for occupational exposures to particles. Regul Toxicol Pharmacol 21:123–35
- Oberdorster G. 2002. Toxicokinetics and effects of fibrous and nonfibrous particles. Inhal Toxicol 14:29–56
- OECD. 2009. 403 Guideline for the testing of chemicals. Acute Inhalation Toxicity, 19 Pages, doi:10.1787/9789264070608-en
- Pauluhn J. 2010. Multi-walled carbon nanotubes (Baytubes): approach for derivation of occupational exposure limit. Regul Toxicol Pharmacol 57:78–89
- Peoples SM, Mccarthy JF, Chen LC, Eppelsheimer D, Amdur MO. 1988. Copper oxide aerosol: generation and characterization. Am Ind Hyg Assoc J 49:271–6
- Pettibone JM, Adamcakova-Dodd A, Thorne PS, O'shaughnessy PT, Weydert JA, Grassian VA. 2008. Inflammatory response of mice following inhalation exposure to iron and copper nanoparticles. Nanotoxicology 2:189–204
- Rani VS, Kumar AK, Kumar P, Reddy AN. 2013. Pulmonary toxicity of copper oxide (CuO) nanoparticles in rats. J Med Sci 13:571–7
- Ren G, Hu D, Cheng EW, Vargas-Reus MA, Reip P, Allaker RP. 2009. Characterisation of copper oxide nanoparticles for antimicrobial applications. Int J Antimicrob Agents 33:587–90
- Slob W. 1999. Thresholds in toxicology and risk assessment. Int J Toxicol 18:259–68
- Slob W. 2002. Dose-response modeling of continuous endpoints. Toxicol Sci 66:298–312
- Slob W, Bakker MI, Biesebeek JD, Bokkers BG. 2014. Exploring the uncertainties in cancer risk assessment using the integrated probabilistic risk assessment (IPRA) approach. Risk Anal 34:1401–22
- Suciu L, Prodan L, Lazar V. 1981. Research on copper poisoning. Med Lav 72:190–7
- Woutersen RA, Van Garderen-Hoetmer A, Slootweg PJ, Feron VJ. 1994. Upper respiratory tract carcinogenesis in experimental animals and in humans. In: Waalkes MP, Ward JM, eds. Carcinogenesis. Target Organ Toxicology Series. New York: Raven Press
- Yokohira M, Hashimoto N, Yamakawa K, Suzuki S, Saoo K, Kuno T, Imaida K. 2009. Lung carcinogenic bioassay of CuO and TiO(2) nanoparticles with intratracheal instillation using F344 male rats. J Toxicol Pathol 22:71–8
- Yokohira M, Kuno T, Yamakawa K, Hosokawa K, Matsuda Y, Hashimoto N, et al. 2008. Lung toxicity of 16 fine particles on intratracheal instillation in a bioassay model using f344 male rats. Toxicol Pathol 36:620–31
- Zenou M, Ermak O, Saar A, Kotler Z. 2014. Laser sintering of copper nanoparticles. J Phys D: Appl Phys 47:025501