Abstract
Purpose We present the first study using fluoride-positron emission CT (F-PET/CT) to analyze mineralization of bone in the femur adjacent to uncemented stems following total hip arthroplasty (THA). We studied patients who were operated bilaterally for osteoarthritis with 2 different stems during the same surgical session.
Patients and methods THA was performed bilaterally during the same surgical session in 8 patients with bilateral osteoarthritis of the hip. An SL-PLUS stem was inserted in one hip and a BetaCone stem was inserted in the contralateral hip, with randomization of side and sequence. A second group of 12 individuals with a normal healthy hip was used as reference for normal bone metabolism. Clinical and radiographic evaluation was performed preoperatively, postoperatively, and at 2 years. We used [18F]-fluoride-PET/CT to analyze bone mineralization adjacent to the stems 1 week, 4 months, and 12 months after surgery. We modified the Polar Map system to fit the upper femur for analysis and presentation of the PET results from 12 regions of interest adjacent to the whole stem.
Results The clinical results were good at 2 years. By radiography, all stems were stable. At PET analyses 1 week after surgery, the activity was higher for the SL-PLUS group than for the BetaCone group. The activity was statistically significantly higher for both stems than the reference values at 4 months, and was most pronounced in the upper femur. At one year, the activity had declined more for the BC group than for the SL group.
Interpretation The bone mineralization activity varied between different regions for the same stem and between different time periods for each group. F-PET/CT is a novel and valuable tool for analysis of bone mineralization patterns around uncemented femoral stems in detail. The combination of PET/CT analysis and the modified Polar Map system may provide a useful tool for future studies of metabolic bone responses to prosthetic implants.
The long-term success of an uncemented THA is dependent on both primary and secondary stability of the implant. The secondary stability is correlated to on-growth of bone to the prosthetic surfaces. Little is known about the distribution of new bone formation over prosthetic surfaces and about the intensity over time of bone on-growth in the clinical situation. Radiographic studies give late and imprecise results (Delaunay and Kapandji Citation1998).
Porous coating of an implant surface has been used in order to facilitate primary stability, to increase the contact surface to bone, and to enhance bone on-growth and long-term stability (Nourbash and Paprosky1998). However, no clinical method of analysis has so far been able to visualize—early and at high resolution—the intensity and distribution of new bone in-growth over the prosthetic areas of a femoral stem. Positron emission tomography (PET) combined with computed tomography (CT) is a method that combines the advantages of high-accuracy scintigraphy and anatomical orientation by CT, and thus allows the study of metabolic events. So far, there have been few applications of PET in orthopedics (Hawkins et al. Citation1992, Piert et al. Citation1998, 1999, 2001, Sörensen et al. Citation2003, Ullmark et al. Citation2007, 2009, 2011, 2012). [18F]fluoride-PET is a sensitive diagnostic method that can be used for analysis of the anabolic aspects of bone turnover (Grant 2008) in new bone formation (Sörensen et al. Citation2003), and also bone viability (Ullmark et al. Citation2007). Validation studies to correlate fluoride-PET to bone histomorphometry have been performed (Messa et al. Citation1993, Piert et al. Citation2001, Andersson 2003, Toegel et al. Citation2006). It was previously assumed that [18F]-fluoride would accumulate in mineral created by both osteoblasts and osteoclasts. More recent information appears to support the view that [18F]-fluoride is bound only to the mineral formed and fixated by osteoblasts (Andersson 2003, Toegel et al. Citation2006).
We used [18F]-fluoride-PET/CT to detect new bone formation adjacent to the surface of the stem during the first year after THA surgery. Our hypothesis was that an arthroplasty component of a specific design and surface, inserted bilaterally in the same patient with the same indication for the procedure (OA) and the same surgical technique, would minimize variation and therefore result in a fairly specific and standardized pattern of bone on-growth, detectable by F-PET/CT. Any difference in fluoride uptake would then indicate a difference in bone mineralization. We suggest that the early pattern of bone mineralization seen with F-PET/CT may be a marker of the bone mineralization response to a specific implant, and that this is probably of importance for the secondary implant stability of a femoral stem. We present the first clinical, randomized study using F-PET/CT analysis for detection of bone mineralization adjacent to two different brands of hip prosthesis (SL-PLUS and BetaCone stems). A Polar Map system (Better 2004) was used for this purpose for the first time, after being modified for the femur.
Patients and methods
Patients
We studied 16 THAs in 8 patients (3 females), mean age 59 (43–69) years. What we considered an appropriate number of patients was based on outcomes from our earlier F-PET studies (Sörensen et al. Citation2003, Ullmark et al. Citation2007, 2009, 2011). The patients all had severely symptomatic bilateral hip osteoarthritis. They had no additional medical conditions or medications affecting bone metabolism. They were operated from 2005 through 2007, bilaterally with a THA using 2 models of uncemented fully porous-coated femoral components implanted, one on each side, during the same operating session. All patients were operated on by a single surgeon (GU). The sequence and side of implantation was decided by randomization using sealed envelopes. We used a second group of 12 individuals (2 of them females) with a healthy and normal hip and femur, mean age 59 (37–69). This group was scanned by F-PET/CT and used as a reference group for normal upper femoral bone mineralization (Ref). The mean fluoride uptake value of this group is referred to as normal femoral bone mineralization.
The trial was approved by the ethics committee of Uppsala University and was performed in compliance with the Helsinki Declaration of 1975, as revised in 2000.
Femoral implants
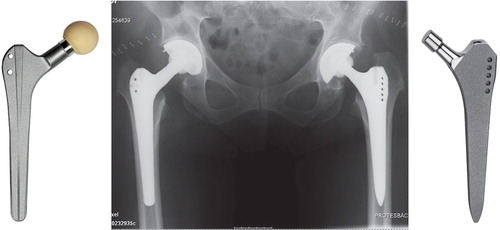
An SL-PLUS stem (SL) (Smith and Nephew Orthopaedics AG, Baar, Switzerland) was implanted in 1 of the hips in each patient. The configuration of the stem is tapered, and it has a rectangular configuration in cross section. The surface is fully grit-blasted to a roughness of 4–8 µm. In the contralateral hip, a BetaCone stem (BC) (Waldemar Link GmbH and Co., Hamburg, Germany)—also fully grit-blasted—was implanted in each patient. This stem is also tapered. The cross-sectional configuration of this stem is a modified rectangular shape including 4 small, extra ribs in the distal part and 2 extra in the upper part. The surface is porous-coated to a roughness of 70 µm. Both stems are made of titanium alloy (Ti-6Al-4V) ().
Figure 1. The BetaCone stem (left) and the SL-PLUS stem (right).
Surgical technique
All patients were operated using a posterior surgical approach. The surgical procedures were performed according to recommendations from the manufacturer. Reaming was done using the standard equipment provided by the manufacturer of the two implants. The procedure for reaming and the resulting press-fit was largely the same for both implants. After the first hip arthroplasty was performed, the patient was turned and the contralateral hip was prepared and dressed, and then the second arthroplasty was performed. We aimed for an offset symmetry by use of preoperative templating and modular prosthetic heads. All the patients had uncemented press-fit acetabular components inserted.
All patients received systemic antibiotic prophylaxis during surgery and they were given low-molecular-weight heparin for 9 days. No NSAID drugs were administrated postoperatively.
Postoperative care
The patients were mobilized on the first or second day after surgery, and allowed full weight bearing on both legs with the assistance of ambulatory aids. Thus, factors that could affect the results were equal for both hips—such as surgical technique, preoperative diagnosis, postoperative rehabilitation, and level of daily activity.
Follow-up
Clinical outcome was assessed according to the Merle d’Aubigne and Postel score modified by Charnley (Charnley 1979) at follow-up after 2 years relative to baseline (preoperatively). Radiographic assessment was done by comparing the radiographs taken immediately after surgery and at the 2-year follow-up, using AP and lateral views. The location of radiographic parameters was identified according to the modified Gruen zones. PET analysis was performed 1 week, 4 months, and 1 year after surgery.
The primary endpoint was the level of fluoride uptake (standardized uptake values: SUVs) for all regions of interest (ROIs) analyzed together, between the 2 stem groups and between each stem group and the reference group at 1 week, 4 months, and 1 year. Secondary endpoints were fluoride uptake (SUV) for each individual ROI, between the 2 stem groups and between each stem group and the reference group, at each of the 3 time points.
PET analysis
We used a Siemens/CTI Exact HR+ scanner (Siemens/CTI, Knoxville, TN) for the PET studies. The HR+ has a FOV of 15 cm, giving 63 transaxial slices. Patients were placed in the supine position on the camera bed. The legs were fixed using a vacuum cushion. A venous catheter was inserted in an antecubital or dorsal hand vein for injection of tracer.
30 min after intravenous injection of 200 MBq [18F]-fluorine, a section of the body from the knees to the upper pelvis was scanned in 2D whole-body mode. Emission scanning started from the knees (5 min per 15-cm bed position) and moved proximally to cover the entire hip prosthesis area in the one session. Transmission scanning for attenuation correction was performed after completing the emission acquisition. All emission scans were corrected for attenuation, scatter, and decay and reconstructed by a process of filtered back-projection.
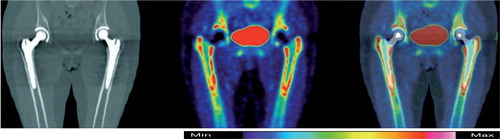
Directly after the first PET scan at the 1-week time point after surgery, the patients also underwent scanning in a hybrid PET and computed tomography (CT) device (Discovery ST; General Electrics, Milwaukee, TE). The CT image was used only in this study. This image was co-registered and fused with the HR+ PET images to indicate exact anatomical locations in the analysis ().
Figure 2. From left to right: CT-, F-PET-, and combined PET/CT-images of pelvis and hips 4 months after surgery. BetaCone stem in the right hip and SL-PLUS in the left hip. Blue color indicates low activity and white color indicates high activity.
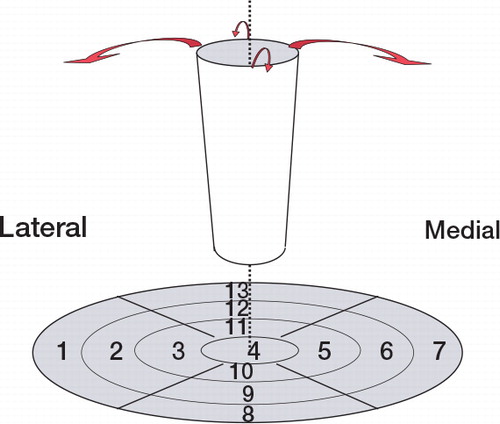
The analysis method has been described in detail elsewhere (Sörensen et al. Citation2003). The CT-images were used to place ROIs. For visualization and analysis of bone metabolic activity in the upper femur, we modified and used a PET visualization method called Polar Map (Better and Hicks 2004), which is frequently used by cardiologists for heart analysis. Briefly, ROIs were placed graphically according to the modified Polar Map. This method allows a greater number of ROIs than the number of Gruen zones (). SUVs from these ROIs were calculated by the formula: SUV of tissue = activity in tissue (Bq/mL) × body weight (g) / total dose injected (Bq). Setting average body density to 1 g/mL, this expression gives a unitless value of the regional tissue activity in proportion to the average activity per mL in the entire body. The evaluator was blinded regarding the model of stem.
Figure 3. The upper femur treated as a cylinder, folded out so that it becomes a disc named a Polar Map. Each of the 7 Gruen zones represents 1 ROI in the disc; 6 other ventral or dorsal ROIs complete all the regions adjacent to the stem.
Statistics
Unless otherwise stated, numerical results are presented as mean values (SD). We compared the prosthesis groups over time in addition to comparing them with the reference group. For each time point analyzed, the mean values for each ROI are compared between the two prosthesis groups, to the corresponding ROIs in the reference group, and also between the 13 ROIs for the reference group and those for the 2 prosthesis groups. For comparisons between prosthesis types, and within types but over time, the samples are naturally paired. For these, the mean (SD) always refers to the individual differences, and the test performed was always a one-sample t-test (on the individual differences) with the null hypothesis being mean zero (i.e. no difference). For comparison to the reference group, we used 2-sample t-testing, with no assumption of equal variances. The p-values are presented without correction for multiple comparisons. The significance level was set at ≤ 0.05. IBM SPSS software and R version 2.15.1 were used in the analyses.
Results
Clinical results
None of the patients suffered from a wound healing problem. The mean Charnley modified score ranged from 3.6 to 4.1 preoperatively and 5.8 to 6.0 postoperatively, and it was similar between groups.
Radiographic results
No subsidence was seen on radiographs for any of the femoral stems. 1 stem in the SL group had radiolucent lines in Gruen zones 1, 2, 6, and 7 at 2 years. The stem was assessed as mechanically loose at 3 years.
PET results
Of the 16 cases that were PET-scanned 3 times each, there were 7 dropouts because of technical errors. The dropouts were at 1 week (2 BC cases and 2 SL cases) and at 1 year (2 BC cases and 1 SL case).
For each of the groups (BC and SL) and for each time point, there was a difference from the reference group—except for the BC group at 1 year and possibly the SL at 1 week. The latter estimate was large (3.59) but the large standard deviation made that estimate uncertain ( and ).
Table 1. Mean uptake per group over time (with p-values from 2-sample t-test against reference)
Figure 4. Uptake (in SUV) for group and time. (The error bars are the standard deviations of the corresponding samples).
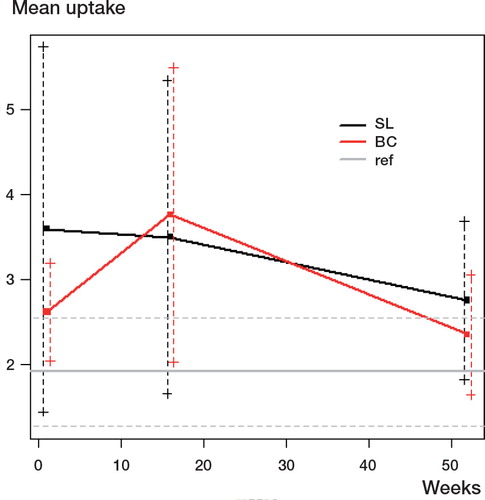
At no time point was there a statistically significant difference between the study groups. In each case, the standard deviation was large compared to the uptake difference. The SL group had a higher uptake at 1 week and at 1 year than the BC group but a lower uptake at 4 months ( and ). At 4 months, the BC group had statistically significantly higher uptake than the SL group in ROI 10, and significantly higher uptake than the reference group in ROIs 1, 2, 4, 7, 8, 9, 10, 11, 12, and 13. For the 3 time points analyzed, detailed differences between the groups (SL, BC, and reference) are presented as individual mean ROI values in Table 3 (see supplementary data).
Table 2. Differences in uptake (BC – SL) (p-value from t-test of “mean = 0”)
For the 2 stem groups, the main finding in analyzing differences over time for individual mean ROI values was a statistically significant rise in uptake from 1 week to 4 months for the BC group (Table 4, see supplementary data).
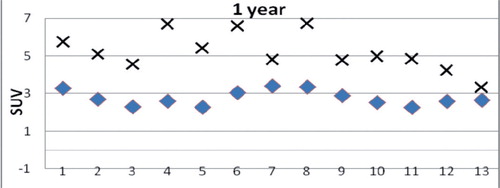
1 case in the SL group was clinically good at 2 years, had non-circumferential radiographically loosened zones at the same time point, but was assessed as showing mechanical loosening at 3 years. In , the 1-year PET results for this case are compared to those for the rest of the SL group. The uptake for all ROIs analyzed together for this case at 1 year was 5.22 (1.01), as compared to 2.75 (1.02) for the rest of the group.
Figure 5. Mean activity (in SUV) for the 13 ROIs 1 year after surgery for the SL group without the case with a loosening stem (♦) and for the single case with a loosening stem (×).
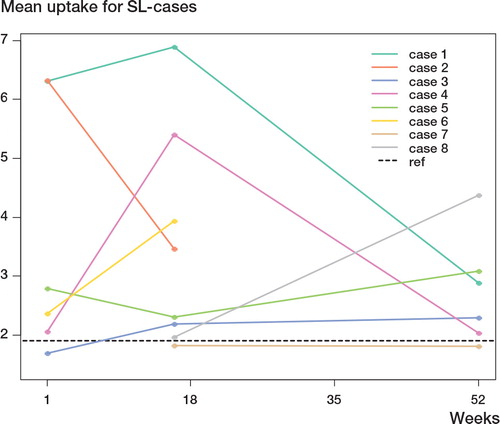
Diagrams for quantitative 18-F uptake for each individual case and stem for the 3 time points are presented in and .
Figure 6. Uptake (in SUV) for each individual case in the BC group, for the 3 time points.
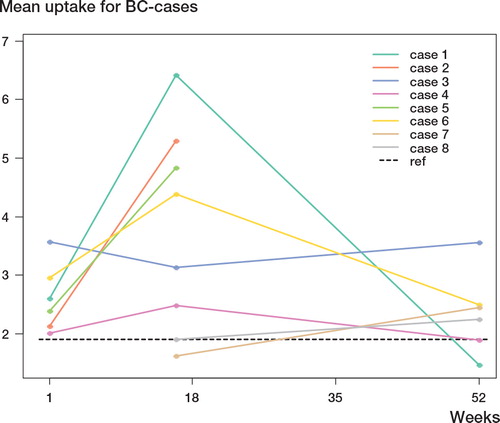
Figure 7. Uptake (in SUV) for each individual case in the SL group, for the 3 time points.
Discussion
We used the F-PET/CT technique to study bone formation adjacent to 2 different uncemented femoral stems inserted one on each side during a simultaneous bilateral THA for OA. Thus, individual factors that could affect the results such as surgical technique, preoperative diagnosis, postoperative rehabilitation, and level of daily activity were equal for both hips. The main purpose of using this design was to study the variation in isotope uptake using 2 different stems. For the first time ever, we used the F-PET/CT technique combined with a modification of the Polar Map system to analyze and visualize the bone mineralization activity adjacent to the surface of primary THA stems in the femur. In spite of the geometric similarity between the 2 stems, there were differences in bone mineralization activity between the groups. The onset of bone mineralization revealed at 1 week was lower (but not statistically significantly so) for the BC group than for the SL group. This finding may indicate that the SL-PLUS stem induces a stronger bone mineralization response than the BC stem. At 4 months, the activity in the BC group had risen to a level similar to the activity at 1 week for the SL group. The highest activity for both stems was found in the upper femur (ROIs 1, 7, 8, and 13) during all 3 time periods analyzed, indicating a more intense bone mineralization metabolism in these regions. The time extension of the phenomenon may be related to an altered load transmission—like stress shielding—and subsequently a rebuilding of the bony microstructure in these ROIs.
The activity for the BC group at 1 year had declined closer to reference values than that for the SL group. Thus, the BC group had both slower onset and earlier termination of the raised bone mineralizating activity than the SL group. The higher surface roughness for the BetaCone stem than for the SL-PLUS stem (70 µm and 4–8 µm, respectively) could have been one factor that contributed to the differences noted.
The intensity of bone mineralization, spread over the prosthetic surface, and spread longitudinally over time may reflect the secondary stabilization of a particular stem. The clinical significance of our findings cannot yet be determined, but they may be of importance to gain further knowledge about the reaction of bone to different implants—both for prediction of the long-term outcomes of THA procedures and to gain a better understanding of bone-implant interactions.
One weakness of our study was the high standard deviations, indicating the need for larger group sizes.
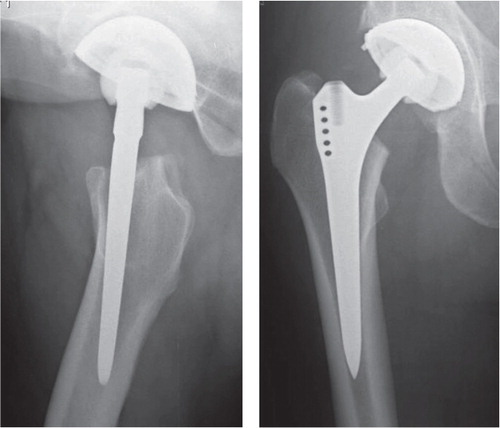
According to postoperative radiographs, the loosened SL-plus stem (Case no 6) had a less favorable position (). This set of circumstances could have contributed to the early mechanical loosening. At 2 years, the clinical scores for this THA were good but radiography at that time point showed radiolucent lines in ROIs 1, 7, 8, and 13. Even the 1-year-PET analysis revealed an abnormal uptake pattern of continuously high activity (). At 3 years, the patient had suffered slight pain and the stem was assessed as being mechanically loose. This outcome is indicative of the validity of this method.
Figure 8. Postoperative radiographs of the stem that later became loose.
Thus, F-PET can be used as a measure of bone accretion. By analyzing the distribution along the implant surface over time, information concerning the stability of the implant can be obtained. We discerned different patterns. Firstly, the normal reaction after THA surgery was a rapid rise in fluoride uptake in the first 4 postoperative months, followed by a decrease to normal values at 1 year (Ullmark et al. Citation2011, 2012). Another pattern was also seen, with prolonged and uneven distribution of high levels of uptake, signifying implant loosening as described by Ullmark et al. (Citation2009).
As the secondary outcomes involve a great number of statistical analyses, there is risk of false significances. The risk of type-I error might have been avoided by using a correction method like the Bonferroni method to sharpen the significance analyses, but arguments against it have been put forward since it increases type-II error (Rothman Citation1990). The sensitivity of the method is illustrated by the metabolic differences revealed in the 37 analyses between all 13 ROIs in normal, healthy upper femurs in the reference group. In addition, we put emphasis on analyses of patterns rather than of single significant differences—and such an approach is facilitated by the use of the Polar Map system.
We found that F-PET/CT combined with our modification of the Polar Map method can be used to identify metabolic bone mineralization responses in separate regions adjacent to femoral stems—over time and in detail—indicating its validity as a tool for research on bone mineralization responses to various joint implants. The method may be able to discriminate between bone mineralization responses to different degrees of prosthetic surface roughness or geometric forms. One possible refinement of the method would be to combine PET/CT with DXA (Ullmark et al. Citation2011), thus allowing calculations of net bone formation.
The modified Polar Map system facilitates the visualization of postoperative bone formation in the form of maps showing the entire stem surface. Thus, the activity can be presented both as numerical values and as a color scale adjacent to the whole stem in one single figure. The mean bone mineralization activity for a group of patients may be presented and analyzed in the same way in a separate Polar Map. The system has allowed us to analyze and present the difference in activity between 2 groups of stems. The 3D alterations in bone mineralization activity over time could be presented as time-dependent alterations for each anatomic location in each individual, or for each prosthesis group.
In the Polar Map method, the number of analyses of ROIs surrounding a stem can be substantially increased (). The limiting factor for an exclusive numerical value representing a unique ROI is a minimum area of 4 × 4 mm. The bone mineralization pattern taking place in the postoperative time period adjacent to a stem surface can be mapped out in detail. Such Polar Maps used for a large number of implanted prostheses should be specific for a specific model of implant, like a “fingerprint”.
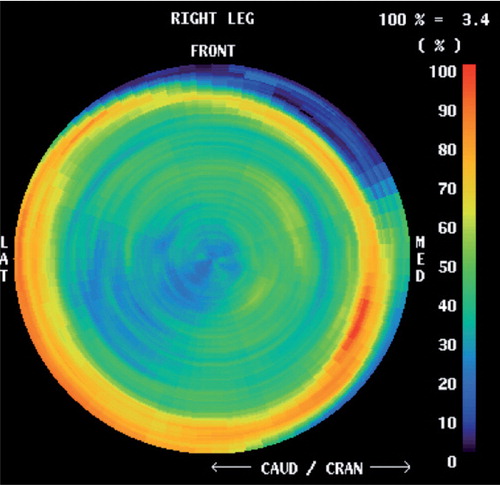
Figure 9. Maximum-detail Polar Map image of bone mineralization activity in femur adjacent to a femoral stem. The image view corresponds to looking down inside the femur from the top (the stem is invisible). Red indicates high activity and blue low.
Supplementary data
Tables 3 and 4 are available at Acta’s website (www.actaorthop.org), identification number 5071.
Supplementary Material
Download PDF (34.5 KB)All authors took part in the planning and design of the study and all revised the final manuscript. GU performed the operations and was involved in data collection, PET analysis, interpretation, and writing of the manuscript. JS was involved in PET analysis data collection, and interpretation. In addition to taking part in planning and study design, ON was involved in interpretation of the results.
No competing interests declared.
Related Research Data
- Anderson HC. Matrix vesicles and calcification. Curr Rheumatol Rep 2003; 5 (3): 222-6.
- Better N, Hicks RJ. Infarct-avid imaging and myocardial perfusion scintigraphy techniques using single-photon radiotracers. In: Nuclear Medicine in Clinical Diagnosis and Treatment. Churchill Livingstone; 2004; 1060-3.
- Charnley J. Numerical grading of clinical results. In: Charnley J. ed. Low friction arthroplasty of the hip: theory and practice. Springer-Verlag 1979: 20-4.
- Delaunay C, Kapandji AI. 10-year survival of Zweymüller total prostheses in primary uncemented arthroplasty of the hip. Rev Chir Orthop Reparatrice Appar Mot 1998; 84 (5): 421-32.
- Grant FD, Fahey FH, Packard AB, Davis RT, Alavi A, Treves ST. Skeletal PET with 18F-fluoride: applying new technology to an old tracer. J Nucl Med 2008; 49 (1): 68-78.
- Hawkins RA, Choi Y, Huang SC, Hoh CK, Dahlbom M, Schiepers C, Satyamurthy N, Barrio JR, Phelps ME. Evaluation of the skeletal kinetics of fluorine-18-fluoride ion with PET. J Nucl Med 1992; 33: 633-42.
- Messa C, Goodman WG, Hoh CK, Choi Y, Nissenson AR, Salusky IB, Phelps ME, Hawkins RA. Bone metabolic activity measured with positron emission tomography and (18F) fluoride ion in renal osteodystrophy: correlation with bone histomorphometry. J Clin Endocrinol Metab 1993; 77 (4): 949-55.
- Nourbash PS, Paprosky WG. Cementless femoral design concerns. Rationale for extensive porous coating. Clin Orthop1998; (355): 189-99.
- Patlak CS, Blasberg RG, Fenstermacher JD. Graphical evaluation of blood-to-brain transfer constants from multiple-time uptake data. J Cereb Blood Flow Metab 1983; 3: 1-7.
- Piert M, Zittel TT, Machulla HJ, Becken GA, Jahn M, Maier G, Bares R, Becker HD. Blood flow measurements with [15O] H2O and [18F]fluoride ion PET in porcine vertebrae. J Bone Mineral Research 1998; 13: 1328-36.
- Piert M, Winter E, Becker GA, Bilger K, Machulla H-J, Myller-Schauenburg W, Bares R, Becker HD. Allogenic bone graft viability after hip revision arthroplasty assessed by dynamic [18F] fluoride ion positron emission tomography. Eur J Nucl Med 1999; 26: 615-24.
- Piert M, Zittel T, Becker G, Jahn M, Stahlschmidt A, Maier G, Machulla HJ, Bares R. Assessment of porcine bone metabolism by dynamic [18F]fluoride ion PET: Correlation with bone histomorphometry. J Nucl Med. 2001; 42: 1091-100.
- Rothman KJ. No adjustments are needed for multiple comparisons. Epidemiology 1990; 1 (1): 43-6.
- Sörensen J, Ullmark G, Långström B, Nilsson O. Rapid bone and blood flow formation in impacted morcelized allografts. Acta Orthop Scand 2003; 74: 633-43.
- Toegel S, Hoffmann O, Wadsak W, Ettlinger D, Mien L, Wiesner K, Nguemo J, Viernstein H, Kletter K, Dudczak R, Mitterhauser M. Uptake of bone-seekers is solely associated with mineralisation! A study with 99mTc-MDP, 153Sm-EDTMP and 18F-fluoride on osteoblasts. Eur J Nucl Med Mol Imaging 2006; 33 (4): 491-4.
- Ullmark G, Sörensen J, Långström B, Nilsson O. Bone regeneration six years after impaction bone grafting: A PET analysis. Acta Orthop 2007; 78: 201-6.
- Ullmark G, Sörensen J, Nilsson O. Bone healing of severe acetabular defects after revision arthroplasty. Acta Orthop 2009; 80 (2): 179-83.
- Ullmark G, Sörensen J, Kärrholm J. Bone metabolism following revision THA using a distally fixed, tapered and fluted stem. Pilot studies using positron emission tomography, dual-energy X-ray absorptiometry and radiostereometry. Hip International 2011; 2 (1): 30-8.
- Ullmark G, Sörensen J, Nilsson O. Analyzes of bone formation on porous- and hydroxyl apatite-coated acetabular cups: A clinical [18F]fluoride PET study. Hip International 2012; 22 (02): 172-8.