Abstract
Background and purpose A successful outcome after lumbar discectomy indicates a substantial improvement. To use the cutoffs for minimal clinically important difference (MCID) as success criteria has a large potential bias, simply because it is difficult to classify patients who report that they are “moderately improved”. We propose that the criteria for success should be defined by those who report that they are “completely recovered” or “much better”.
Methods A cohort of 692 patients were operated for lumbar disc herniation and followed for one year in the Norwegian Registry for Spine Surgery. The global perceived scale of change was used as an external criterion, and success was defined as those who reported that they were “completely recovered” or “much better”. Criteria for success for each of (1) the Oswestry disability index (ODI; score range 0–100 where 0 = no disability), (2) the numerical pain scale (NRS; range 0–10 where 0 = no pain) for back and leg pain, and (3) the Euroqol (EQ-5D; –0.6 to 1 where 1 = perfect health) were estimated by defining the optimal cutoff point on receiver operating characteristic curves.
Results The cutoff values for success for the mean change scores were 20 (ODI), 2.5 (NRS back), 3.5 (NRS leg), and 0.30 (EQ-5D). According to the cutoff estimates, the proportions of successful outcomes were 66% for the ODI and 67% for the NRS leg pain scale.
Interpretation The sensitivity/specificity values for the ODI and leg pain were acceptable, whereas they were very low for the EQ-5D. The cutoffs for success can be used as benchmarks when comparing data from different surgical units.
Rates of successful outcome after surgical treatment of lumbar disc herniation vary and are influenced by the measurement scale or instrument that is used, definition(s), and cutoffs of the actual outcome (Greenough Citation1993, Asch et al. Citation2002, Copay et al. Citation2008, Citation2010). There is no well-defined gold standard for defining a successful outcome, but most clinicians and researchers agree that change of scores on a validated patient-reported outcome such as the Oswestry disability index (ODI) (Fairbank et al. Citation1980) and pain scales (Jensen and Karoly Citation1992) should not only reflect a statistically significant change, but also a change that is sufficiently large to be of clinical importance to the patient (Copay et al. Citation2007, Terwee et al. Citation2007). The minimal clinically important difference (MCID) has been defined as “the smallest difference in score in the domain of interest which patients perceive as beneficial and would mandate, in the absence of troublesome side effects and excessive cost” (Jaeschke et al. Citation1989). The cutoff for the MCID (external criterion or anchor) is usually defined on a self-reported global perceived health-effect scale. It has also been suggested that this method be used to define evidence-based criteria for successful outcomes after spine surgery (Copay et al. Citation2007). Such success criteria would be valuable for spine surgery registries in comparing effectiveness of treatment over time and between surgical units.
Conceptually, there is a difference between the MCID and success. Success indicates an improvement that reflects a substantial amount of change rather than a minimal amount of change. A source of bias is attached to estimates of minimal amount of change, simply because it is difficult to judge whether patients who report themselves to be “slightly” or “moderately” improved have had a change that one can consider to be important. One simple way around this obstacle is to provide estimates of success that include only patients with a substantial amount of change, defined by self-reports of “completely recovered” or “much better”.
We estimated cutoff values for success criteria for the (ODI), the numerical pain scale (NRS) for back and leg pain, and the Euroqol (EQ-5D) in patients who were operated for lumbar disc herniation.
Patients and methods
Study population
Data for this cohort study were collected through the Norwegian Registry for Spine Surgery (NORspine), which started in 2006 and is a comprehensive clinical registry for quality control and research. This study covered the first 692 consecutive patients who were operated for lumbar disc herniation at 16 surgical units in Norway and who were included in the registry during the implementation period between October 2006 and March 2008. Follow-up time from the date of the operation (baseline) was 12 months.
Informed consent was obtained from all participants. The registry protocol was approved by the Data Inspectorate of Norway.
Patient-reported outcome measures
All questionnaires were self-administered and were identical at baseline and follow-up.
Functional status was assessed by the Oswestry low back disability questionnaire (ODI) (Fairbank et al. Citation1980), which contains 10 questions on limitations of activities of daily living. Each variable is rated on a 0- to 5-point scale, added up, and converted into a percentage score. The range of possible values is from 0 to 100 (where 0 = no disability).
Intensity of pain was graded in 2 separate 0–10 numerical rating scales (NRS) for back pain (NRS back) and leg pain (NRS leg) where 0 = no pain (Jensen and Karoly Citation1992).
EQ-5D is a generic and preference-weighted measure of health-related quality of life (HRQL) (The EuroQol Group Citation1990). It evaluates 5 dimensions: mobility, self-care, activities of daily living, pain, and anxiety and/or depression. For each dimension, the patient describes 3 possible levels of problems (none, mild-to-moderate, and severe). This descriptive system therefore contains 35 = 243 combinations or index values for health status. We used the value set based on the main survey from the EuroQol group (Dolan et al. Citation1996), which has been validated for patient populations similar to that in our study (Solberg et al. Citation2005). Total score ranges from –0.6 to 1, where 1 corresponds to perfect health and 0 to death. Negative values are considered to be worse than death.
These instruments—the NRS pain scales, ODI, and EQ-5D—have shown good validity and are frequently used in research on back pain. The Norwegian versions of these instruments have shown good psychometric properties (Grotle et al. Citation2003, Solberg et al. Citation2005). The questionnaire at follow-up included a global question about the patient’s perception of change during the follow-up period (Kamper et al. Citation2010). The responses were assessed on a 7-point scale: 1 = completely recovered, 2 = much improved, 3 = slightly improved, 4 = no change, 5 = slightly worse, 6 = much worse, and 7 = worse than ever.
Data collection and registration by the NORspine registry protocol
At admission for surgery, the patient completed the baseline questionnaire, which included questions about demographics and lifestyle issues in addition to the outcome measures. During the hospital stay, using a standard registration form, the surgeon recorded data concerning diagnosis, employment status, duration of symptoms, and treatment.
12 months after surgery, a questionnaire was distributed by regular post, completed at home by the patients, and returned in the same way. 1 reminder with a new copy of the questionnaire was sent to those who did not respond.
Statistics
All statistical analyses were performed with SPSS for Windows version 14.0. Baseline and 1-year scores were compared with paired-samples t-test. Mean change scores between the subgroups were analyzed with one-way ANOVA. Spearman rank correlation coefficient was used to assess the relationship between the global change scale and the change scores of the instruments.
Cutoff values for success
The global perceived change scale was used as the anchor or external criterion for defining a successful outcome 1 year after surgery (Kamper et al. Citation2010). We defined the patients who reported that they were completely recovered or much improved (categories 1 and 2) to represent success, whereas those who reported themselves as being slightly improved, having no change, or being slightly worse (categories 3–5) were considered to represent no success. Since few patients reported that they were much worse or worse than ever (categories 6–7), we could not establish a subgroup with deterioration.
The change scores were calculated by subtracting the baseline score from the follow-up score. The mean change scores in the instruments were compared to the categories in the anchor by using ANCOVA (General Linear Model) with adjustment for baseline scores. The relationship between change scores and the external criterion was calculated using Spearman rank correlation coefficient.
A receiver operating characteristic (ROC) curve was obtained by plotting every possible cutoff score’s sensitivity on the y-axis against 1 – specificity on the x-axis. Sensitivity was defined as the proportion of patients who were correctly classified in the success group, whereas specificity was defined as the proportion of patients who were correctly classified in the no-success group. To determine the optimal cutoff score for successful outcome, the point closest to the upper-left corner of the ROC curve was used, which is assumed to be the best cutoff score to distinguish between success or not, as it represents the lowest overall misclassification. We defined the most optimal cutoff point by looking at the sensitivity and specificity for various cutoff values and the percentage of misclassification. We also computed the area under the curve (AUC), which reflects the accuracy of the instruments to differentiate between success and no success. An AUC value of > 0.70 was considered satisfactory (de Vet et al. Citation2007).
We carried out sensitivity analyses for cutoff values in the following subgroups: patients operated with microsurgical technique, patients operated with open discectomy, patients operated for the first time, and those who had been operated previously.
Floor and ceiling effects
We assessed floor and ceiling effects by calculating the frequency of the highest possible scores and the lowest possible scores at baseline. Floor effects were considered to be present if more than 15% of the patients had a minimal score at baseline (0 on the scales). Ceiling effects were considered to be present if more than 15% of the patients had a maximum baseline score (10 on the pain scales and 100 on the ODI) (de Vet et al. Citation2007).
Results
Of 894 patients registered with an operation for disc herniation, 202 (23%) did not return the postal questionnaire at 1 year, and they were excluded. Our study therefore included 692 patients (). Mean age was 46 (SD 13) years and 408 (59%) of the patients were males.
Table 1. Characteristics of the study population (n = 692) at baseline
Of the 692 patients included at baseline, 688 had complete 1-year follow-up data on all outcome measures and the global perceived change scale. At 1 year, there were few missing data on ODI (1 patient), back pain (0 patients), and leg pain (5 patients), whereas 35 patients lacked 1-year scores for the EQ-5D. All patients were operated at 1 level (n = 660) or at 2 or more levels (n = 32) between L2 and S1; 557 (80%) were operated with the use of microscope or loupes and 135 (20%) were operated without any visual enhancement (“open discectomy”). In 13 cases (2%), a laminectomy was performed. The rest were operated with less invasive procedures. None had additional fusion surgery or total disc replacement. 539 patients (80%) were operated for the first time, and 139 (20%) had been operated previously at the same level (13%) and/or a different level (8%). The complication rate was 60/692 (4%), including 19 wound infections, 9 dural tears, 7 nerve root injuries, 17 hematomas, and 8 other minor complications.
The Spearman rank correlation coefficients between the global scale and the change scores of the instruments were 0.61 (ODI), 0.57 (back pain), 0.60 (leg pain), and 0.55 (EQ-5D) ().
Table 2. The mean change scores (95% CI) of the 4 instruments according to the global perceived change scale (anchor) at 1 year
Cutoff values for success
The ROC curve analyses () showed an AUC (95% CI) for the ODI of 0.85 (0.83–0.89), NRS back 0.82 (0.78–0.85), NRS leg 0.84 (0.81–0.88), and EQ-5D 0.80 (0.76–0.84). The cutoff value (sensitivity, specificity) to distinguish between success or lack of success was a change score of 20 (0.78, 0.77) for the ODI, 2.5 (0.74, 0.77) for back pain, 3.5 (0.81. 0.73) for leg pain, and 0.3 (0.74, 0.68) for the EQ-5D. The sensitivity and specificity values were highest for ODI and the leg pain scale and they were lowest for the EQ-5D. shows the mean change scores when using these cutoff values for success for each of the 4 instruments. According to the criteria, the proportion of patients with success at 1-year follow-up was 66% for the ODI, 67% for leg pain, 59% for back pain, and 61% for EQ-5D.
ROC curves for Oswestry disability index (ODI), back and leg pain scores, and EuroQol (EQ-5D).
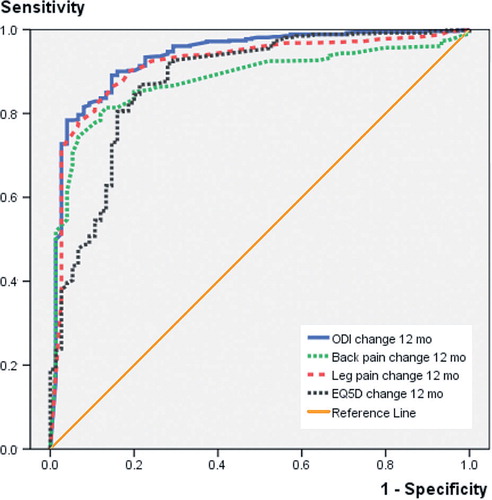
Table 3. The mean change scores (95% CI) according to the cutoffs for success for each of the 4 instruments. Values are mean change (95% confidence interval) a
Sensitivity analyses
When we compared (1) the patients who were operated with microsurgical technique with those operated with open discectomy, and (2) the patients who were operated for the first time with those who had been operated previously, we found approximately the same the cutoff values and sensitivity/specificity values (). The success criteria in the subgroup of patients who had been operated previously had to be slightly higher for the ODI and NRS leg pain in order to reach the precision of the cutoff values observed in the total study population.
Table 4. Sensitivity analysis of area under the curve (AUC) with 95% CI and sensitivity/specificity (sens, spec) of cutoff values across 4 subgroups
Floor and ceiling effects
There were no floor and ceiling effects in the 4 instruments. Only 8 patients scored 0 in the ODI, and 1 patient scored 100 at baseline. None of the patients scored 0 in the NRS pain scales, but 10 patients had the maximum score of 10 at baseline. This was still below the level of 15%, which is the criterion for definition of floor/ceiling effects. In the EQ-5D, only 1 patient had the maximum score of 1 at baseline, reflecting optimal health.
Discussion
In this study, we estimated cutoff values to identify patients with successful outcomes after surgery for lumbar disc herniation according to 4 commonly used patient-reported outcome instruments: the ODI, the NRS back and leg pain scales, and the EQ-5D. ODI and NRS leg pain were best for discrimination between a successful outcome and an unsuccessful outcome. The cutoff value was 20 for ODI and 3.5 for NRS leg pain. According to the ROC analysis, the EQ-5D had the poorest sensitivity and specificity values.
We defined patients who reported that they were “completely recovered” or “much better” to have had a successful outcome or a substantial amount of improvement. We used strict criteria—“completely recovered” or “much better”—as a cutoff (anchor) for a successful outcome. Consequently, the current cutoff values were higher than what has been reported for MCID previously (Copay et al. Citation2008). We argue that as long as we do not have better external criteria to distinguish between improved and unimproved patients, we consider that it is scientifically sound to provide the least biased estimates for success after surgery. However, we are aware that there will be patients with a possibly successful outcome among those classified as having an unsuccessful one (false negatives).
Although the AUCs were acceptable for all the instruments (> 0.70), ODI and NRS leg pain showed better ability to discriminate between success and lack of success for patients who have undergone back surgery than the 2 other outcome measures. Glassman et al. (Citation2008) used substantial clinical benefit thresholds similar to ours for the ODI and the pain scales in patients who were operated with lumbar spine arthrodesis. They found a cutoff for success of 19 ODI points, which is very similar to our results. However, they used the SF-36 health transition item as another external anchor, whereas we used the global perceived change scale. Copay et al. (Citation2008) reported lower estimates of 13 points for the ODI, 1.2 points for NRS back pain scale, and 1.6 points for NRS leg pain scale. However, they used a mixed patient sample involving different lumbar spine surgery procedures, and they used cutoff values similar to the MCID (and not related to a substantial improvement).
A weakness of the present study was that the loss to follow-up was relatively high (22.6%). However, the aim of the study was to define cutoffs over a range of outcomes, and not to evaluate the effectiveness of the surgical treatment. In a recent study on an equivalent patient population with 22% non-respondents, we found no difference in outcomes between responding and non-responding cohort participants at long-term follow-up (Solberg et al. Citation2011). Thus, we do not expect that loss to follow-up would bias our effects-size assessments.
Another weakness was the use of the global change scale as an external anchor. Kemper et al. (2010) showed that global change scale ratings are strongly influenced by the current health status of the patient and that they may not offer an accurate measure of change as transition time increases. This is a challenge for all clinimetric studies, since at the moment there are no alternative external anchors for self-reported questionnaires.
The study had several advantages. We used a theoretically sound method by using a concept of success that reflected a substantial amount of change. Such benchmark criteria would be valuable for clinical spine surgery registries in monitoring effectiveness of treatment and comparing treatment outcomes between surgical units and over time. Finally, all the cutoff estimates, reflecting a substantial amount of change, were considerably larger than previously reported estimates of measurement error or minimal detectable change (Grotle et al. Citation2004).
In summary, the ODI and the NRS leg pain scale showed the best ability to discriminate between success or lack of success in patients who had been operated for lumbar disc herniation. We recommend that a change score of at least 20 points in the ODI and of at least 3.5 in NRS leg pain should be achieved to ensure a successful outcome or substantial change after surgery. These cutoffs for success can enhance interpretation of outcomes in different surgical units.
TKS: idea, protocol, data collection, data analysis, and writing. LGJ: protocol, data analysis, and writing. ØPN: data collection, data analysis, and writing. MG: idea, protocol, data analysis, and writing.
No competing interests declared.
Related Research Data
- Asch HL, Lewis PJ, Moreland DB, Egnatchik JG, Yu YJ, Clabeaux DE, Hyland AH. Prospective multiple outcomes study of outpatient lumbar microdiscectomy: should 75 to 80% success rates be the norm? J Neurosurg 2002; 96: 34-44.
- Copay AG, Glassman SD, Subach BR, Berven S, Schuler TC, Carreon LY. Minimum clinically important difference in lumbar spine surgery patients: a choice of methods using the Oswestry Disability Index, Medical Outcomes Study questionnaire Short Form 36, and pain scales. Spine J 2008; 8: 968-74.
- Copay AG, Martin MM, Subach BR, Carreon LY, Glassman SD, Schuler TC, Berven S. Assessment of spine surgery outcomes: inconsistency of change amongst outcome measurements. Spine J 2010; 1: 291-6.
- Copay AG, Subach BR, Glassman SD, Polly DW, Jr., Schuler TC. Understanding the minimum clinically important difference: a review of concepts and methods. Spine J 2007; 7: 541-6.
- de Vet HC, Ostelo RW, Terwee CB, van der Roer N, Knol DL, Beckerman H, Boers M, Bouter LM. Minimally important change determined by a visual method integrating an anchor-based and a distribution-based approach. Qual Life Res 2007; 16: 131-42.
- Dolan P, Gudex C, Kind P, Williams A. The time trade-off method: results from a general population study. Health Econ 1996; 5: 141-54.
- Fairbank JC, Couper J, Davies JB, O'Brien JP. The Oswestry low back pain disability questionnaire. Physiotherapy 1980; 66: 271-3.
- Glassman SD, Copay AG, Berven SH, Polly DW, Subach BR, Carreon LY. Defining substantial clinical benefit following lumbar spine arthrodesis. J Bone Joint Surg (Am) 2008; 90: 1839-47.
- Greenough CG. Results of treatment of lumbar spine disorders. Effects of assessment techniques and confounding factors. Acta Orthop Scand (Suppl 251) 1993: 126-9.
- Grotle M, Brox JI, Vollestad NK. Cross-cultural adaptation of the Norwegian versions of the Roland-Morris Disability Questionnaire and the Oswestry Disability Index. J Rehabil Med 2003; 35: 241-7.
- Grotle M, Brox JI, Vollestad NK. Concurrent comparison of responsiveness in pain and functional status measurements used for patients with low back pain. Spine 2004; 29: E492-E501.
- Jaeschke R, Singer J, Guyatt GH. Measurement of health status. Ascertaining the minimal clinically important difference. Control Clin Trials 1989; 10: 407-15.
- Jensen MP, Karoly P. Self-report scales and procedures for assessing pain in adults. In: Handbook of Pain Assessment ( Eds. Truk DC, Melzack R). New York: The Guilford Press, 1992: 135-51.
- Kamper SJ, Ostelo RW, Knol DL, Maher CG, de Vet HC, Hancock MJ. Global Perceived Effect scales provided reliable assessments of health transition in people with musculoskeletal disorders, but ratings are strongly influenced by current status. J Clin Epidemiol 2010; 63: 760-766.
- Solberg TK, Olsen JA, Ingebrigtsen T, Hofoss D, Nygaard OP. Health-related quality of life assessment by the EuroQol-5D can provide cost-utility data in the field of low-back surgery. Eur Spine J 2005; 14: 1000-1007.
- Solberg TK, Sorlie A, Sjaavik K, Nygaard OP, Ingebrigtsen T. Would loss to follow-up bias the outcome evaluation of patients operated for degenerative disorders of the lumbar spine? Acta Orthop 2011; 82 (1): 56-63.
- Terwee CB, Bot SD, De Boer MR, van der Windt DA, Knol DL, Dekker J, Bouter LM, de Vet HC. Quality criteria were proposed for measurement properties of health status questionnaires. J Clin Epidemiol 2007; 60: 34-42.
- The EuroQol Group. EuroQol--a new facility for the measurement of health-related quality of life. The EuroQol Group. Health Policy 1990; 16: 199-208.