
Abstract
Background — Determination of the amount of wear in a polyethylene liner following total hip arthroplasty (THA) is important for both the clinical care of individual patients and the development of new types of liners.
Patients and methods — We measured in vivo wear of the polyethylene liner using computed tomography (CT) (obtained in the course of regular clinical care) and compared it to coordinate-measuring machine (CMM) readings. Also, changes in liner thickness of the same retrieved polyethylene liner were measured using a micrometer, and were compared to CT and CMM measurements. The distance between the centers of the acetabular cup and femoral head component was measured in 3D CT, using a semi-automatic analysis method. CMM readings were performed on each acetabular liner and data were analyzed using 3D computer-aided design software. Micrometer readings compared the thickest and thinnest regions of the liner. We analyzed 10 THA CTs and retrievals that met minimal requirements for CT slice thickness and explanted cup condition.
Results — For the 10 cups, the mean difference between the CT readings and the CMM readings was -0.09 (–0.38 to 0.20) mm. This difference was not statistically significant (p = 0.6). Between CT and micrometer, the mean difference was 0.11 (–0.33 to 0.55) mm. This difference was not statistically significant (p = 0.6).
Interpretation — Our results show that CT imaging is ready to be used as a tool in clinical wear measurement of polyethylene liners used in THA.
The most common reasons for long-term implant failure are wear and aseptic loosening. Wear of the polyethylene liner is often the limiting factor for the longevity of the implant. The liner material used most often has been polyethylene with varying degrees of crosslinking (Thomas et al. Citation2011).
Several wear measurement techniques have been developed, ranging from simple single radiographic techniques (Martell and Berdia Citation1997) to more advanced 3D techniques (Vandenbussche et al. Citation2010, Thomas et al. Citation2011). 3D methods have been developed to add a lateral view in addition to the AP view (Devane et al. Citation1997, Martell et al. Citation2003a). In vivo measurements have shown that 3D wear analysis has higher accuracy and detects 10–20% more wear than 2D methods (Olivecrona et al. Citation2002, Citation2007, Martell et al. Citation2003b, Thomas et al. Citation2011). Currently, the most accurate 3D method for monitoring wear is considered to be radiostereometric analysis (RSA). However, RSA is not available in routine clinical practice.
Computed tomography (CT) offers accurate spatial volume resolution without significant distortion. Previous studies from our research group have shown that CT can be used for evaluation of acetabular cup position and migration (Olivecrona et al. Citation2004). In the current study, to verify the CT wear estimates, we physically measured explanted acetabular component liners using (1) a coordinate-measuring machine (CMM) with computer-aided design software, and (2) a micrometer to measure liner thickness at the thickest and thinnest points. We hypothesized that there would be no statistically significant difference in wear measurements between CT, CMM, and micrometer analysis, and that CT measurements are viable for clinical assessment of early wear in THA.
Patients and methods
We identified 10 patients (5 males, ) who had available both a CT scan and a polyethylene liner explant. Liners were explanted as part of revision surgery that occurred due to: polyethylene wear, osteolysis, or instability. Only CT scans with a slice thickness of 1.6 mm or less were included; retrieved liners that were damaged during explanation were excluded. Information on cup material was only available for 4 cups: 1 cup was made of crosslinked polyethylene and 3 cups were made of conventional (non-crosslinked) polyethylene. The remaining cups were implanted between 1991 and 1996, therefore we can conclude that they were made of conventional polyethylene.
Table 1. Patient demographics, cup liner time in vivo, and CT scan interval
CT method
To analyze the data, we used a 3D processing tool (Noz et al. Citation2001, Olivecrona et al. Citation2002). This tool was updated to semi-automatically identify the center of the femoral head and the center of the acetabular cup. To identify the surface of the acetabular cup, the user places (in 3D) 4 points: 3 non-collinear points to identify the plane of the cup opening, and 1 point at the apex of the cup. A point is then placed in the sagittal view, a short distance outside the apex of the cup. Based on these parameters, the software detects the surface of the cup and places landmarks on that surface (usually around 15,000 landmarks). To identify the surface of the femoral head using the coronal view, the user identifies 2 circles: 1 to identify the bottom of the head (around the head-neck junction) and 1 to encompass the entire head. The software then detects the surface of the femoral head and places about 2,000 surface landmarks. A numerical algorithm is then used to estimate the radius and center of the head and cup.
CMM method
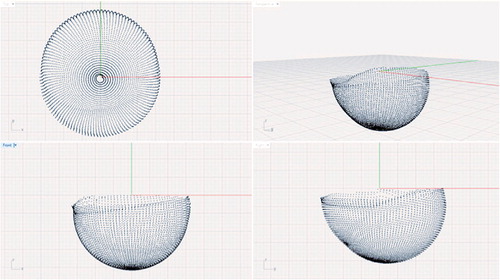
For the CMM measurements, the same polyethylene liners that were analyzed using the CT method were analyzed ex vivo using a CMM (Global Advantage; Brown and Sharp, North Kingstown, RI). Each cup was programmed individually using the specialized CMM software (PC-DMIS version 1.0; Wilcox Associates, North Kingstown, RI). The complete internal surface of each cup was measured with a line scan at 3° intervals, and 2 points per mm. The average number of points per cup was about 4,700 ().
Figure 1. Inner surface of an ex vivo liner measured using the coordinate-measuring machine (CMM).
Data points were exported to a text file and imported into computer-aided design (CAD) software (Rhinoceros McNeel and Associates, Seattle, WA). 2 spheres were created to simulate the position of the femoral head in the cup (). The diameter of the spheres was determined based on actual measurements of the explanted femoral heads, which were available for all but 1 of the patients. The actual diameter of the explanted femoral head was measured using a caliper (Digimatic; Mitutoyo Corporation). The mean difference between the nominal head size and the actual head size as measured by the calipers was 0.06 (0.02–0.10) mm. Head size distribution is given in .
Figure 2. CMM-scanned inner surface of an ex vivo liner with simulated femoral heads, before final positioning.
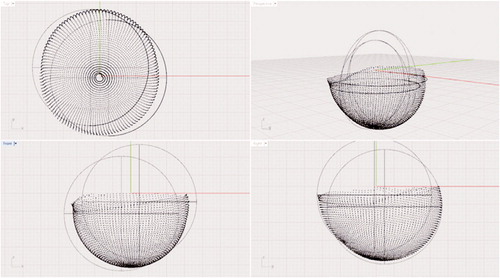
Table 2. Liners’ size distribution
For each of the CMM-scanned liners, 2 observers independently aligned the 2 spheres such that one sphere was positioned in the original position of the femoral head (pre-wear position) and the second sphere was positioned at the location of maximum wear. Once the 2 spheres were optimally positioned, the distance between their centers was calculated. This process was repeated 5 times for each cup, by each of the 2 observers. The mean difference between the 2 observers was 0.03 (–0.23 to 0.29) mm.
Micrometer method
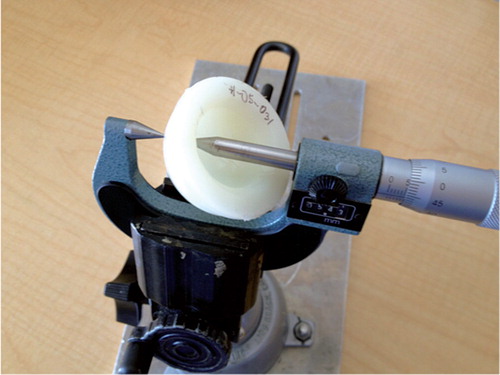
In addition, 9 cups were also analyzed using a point micrometer. Each of the 9 cups was analyzed by locating the thickest and thinnest portions of the liner wall (). 10 point-measurements were averaged around each of those locations. The difference between the thickest and thinnest portions was considered to be the amount of wear in the liner. Data were collected by 2 observers. The mean difference between the 2 observers was 0.05 (–0.15 to 0.20) mm. The annual wear rate for the 3 methods was also calculated.
Figure 3. The cup wall thickness measurement setup showing the point micrometer, cup, and holding apparatus.
Institutional Review Board approval was obtained prior to the start of the study.
Statistics
Data were tested for normality using Q-Q plots, Shapiro-Wilk test, skewness, kurtosis, and histogram distribution. Limits of agreement were calculated as 95% confidence intervals (CIs) according to Ranstam et al. (Citation2000). Between-reader agreement was calculated using both interclass correlation coefficient and Wilcoxon rank sum test. All statistical tests were performed using SPSS statistical software.
Accuracy was calculated according to Bragdon et al. (Citation2002), using the modified equation:
where x was obtained from the Student’s t-test distribution (x = 2.228), s is the standard deviation of the sample, n is the number of examinations, and m is the number of error observations per examination.
Results
When comparing the CMM readings between the 2 observers, the mean difference was 0.02 mm (CI: –0.02 to 0.08; p = 0.7; interclass correlation coefficient: 0.99). When comparing micrometer readings between the 2 observers, the mean difference was 0.05 mm (CI: 0.02 to 0.08; p = 0.2; interclass correlation coefficient: 0.99).
Measurement results and differences between different measurement techniques for each of the cups are listed in (liner 4 was excluded from micrometer measurements as it was lost to follow-up). The mean differences in wear measured using the 3 different methods (with CIs) are summarized in .
Table 3. Cup and head measurements (averaged between observers)
Table 4. Mean differences between the 3 methods
We excluded 1 outlier from the CT measurements (number 7). Micrometer analysis indicated that the thickest point of this cup averaged 4.83 mm, so wear of 5.14 mm is not possible. The accuracy in wear measurement for the difference between CMM and CT was calculated to be 0.17 mm. Between CMM and micrometer the accuracy was 0.19 mm, and between CT and micrometer accuracy was calculated to be 0.30 mm. summarizes the reference measurements (mean, standard deviation, standard error, and accuracy) for the differences between CMM and CT, CMM and micrometer, and micrometer and CT.
Table 5. Reference measurements between CMM, CT, and micrometer (average of 2 observers)
Based on time in vivo, we calculated the annual wear rate as measured by CMM, CT, and micrometer ().
Table 6. Annual wear rate calculated per measurement method
Discussion
We validated our hypothesis that the difference between the means of the 3 wear measurement techniques—CT, CMM, and micrometer—was not statistically significant.
In a previous publication (Goldvasser et al. Citation2012), we investigated the use of a high resolution CT scanner to estimate the displacement of the femoral head in a THA phantom. In that experiment, we measured the accuracy and precision of the CT scanner by using micrometers to displace the femoral head a known amount and compared these displacements to the calculated difference between the center of the head and the center of the cup. We found that the 3-axis accuracy was 0.28 mm. This result is in agreement with our current study.
A potential major concern using this technique is increased risk of radiation due to the need for CT scans, but new protocols for reduced CT radiation exposure (Martinsen et al. Citation2012, Chen et al. Citation2013) make CT technology a viable option for future clinical studies of THA performance. Another shortcoming led to the exclusion of liner 7 from CT measurements, as the CT-calculated wear was greater than the thickness of the liner. We have repeated the CT measurement (for liner 7) a number of times, with the same outcome. This error can be explained by the large amount of wear of the polyethylene. In this case, in the CT imaging, the femoral head was in contact with the acetabular cup, which introduced difficulty for the computer algorithm to differentiate between the acetabular cup and femoral head. This can be solved with software modifications. Additional source of error may be introduced by the manufacturing tolerance of the polyethylene liner; this can introduce errors in the micrometer readings. Another source of error between CT measurement and CMM and micrometer measurements is the implant time in vivo after imaging. It is likely that some additional wear took place during this period (115 days on average).
There are other wear measurement techniques that can measure in vivo 3D wear more accurately (Bragdon et al. Citation2002), but these techniques require the implantation of tantalum beads and a dedicated infrastructure, which limits the type and number of patients who can be studied, and in some cases prevents any studies. Thus, the ability to follow implant performance clinically (with an accuracy of 0.3 mm) in vivo in 3D—in a large cohort with clinically available tools and avoiding the need for special procedures—should be of some interest.
DG: study design, CT data collection and analysis, CMM data collection and analysis, micrometer data collection and analysis, and manuscript preparation. VH: CMM data analysis, micrometer data analysis, and editing of manuscript. MEN and MPZ: development of CT software and editing of manuscript. GQM: development of CT software, algorithm development, and manuscript editing. HO: project development and manuscript editing. CB: manuscript editing. LW and HM: study design and manuscript editing.
No competing interests declared. The project was funded by the Harris Orthopaedic Laboratory, Massachusetts General Hospital, Boston MA USA
- Bragdon CR, Malchau H, Yuan X, Perinchief R, Karrholm J, Borlin N, Estok DM, Harris WH. Experimental assessment of precision and accuracy of radiostereometric analysis for the determination of polyethylene wear in a total hip replacement model. J Orthop Res 2002; 20 (4): 688-95.
- Chen MY, Shanbhag SM, Arai AE. Submillisievert median radiation dose for coronary angiography with a second-generation 320-detector row CT scanner in 107 consecutive patients. Radiology 2013; 267 (1): 76-85.
- Devane PA, Horne JG, Martin K, Coldham G, Krause B. Three-dimensional polyethylene wear of a press-fit titanium prosthesis. Factors influencing generation of polyethylene debris. J Arthroplasty 1997; 12 (3): 256-66.
- Goldvasser D, Noz ME, Maguire GQ, Jr., Olivecrona H, Bragdon CR, Malchau H. A new technique for measuring wear in total hip arthroplasty using computed tomography. J Arthroplasty 2012; 27 (9): 1636-40 e1631.
- Martell JM, Berdia S. Determination of polyethylene wear in total hip replacements with use of digital radiographs. J Bone Joint Surg (Am) 1997; 79 (11): 1635-41.
- Martell JM, Berkson E, Berger R, Jacobs J. Comparison of two and three-dimensional computerized polyethylene wear analysis after total hip arthroplasty. J Bone Joint Surg (Am) 2003a; 85 (6): 1111-7.
- Martell JM, Verner JJ, Incavo SJ. Clinical performance of a highly cross-linked polyethylene at two years in total hip arthroplasty: a randomized prospective trial. J Arthroplasty (Suppl 1) 2003b; 18 (7): 55-9.
- Martinsen AC, Saether HK, Hol PK, Olsen DR, Skaane P. Iterative reconstruction reduces abdominal CT dose. Eur J Radiol 2012; 81 (7): 1483-7.
- Noz ME, Maguire GQ, Jr., Zeleznik MP, Kramer EL, Mahmoud F, Crafoord J. A versatile functional-anatomic image fusion method for volume data sets. J Med Syst 2001; 25 (5): 297-307.
- Olivecrona L, Crafoord J, Olivecrona H, Noz ME, Maguire GQ, Zeleznik MP, Svensson L, Weidenhielm L. Acetabular component migration in total hip arthroplasty using CT and a semiautomated program for volume merging. Acta Radiol 2002; 43 (5): 517-27.
- Olivecrona H, Weidenhielm L, Olivecrona L, Beckman MO, Stark A, Noz ME, Maguire GQ, Jr., Zeleznik MP, Svensson L, Jonson T. A new CT method for measuring cup orientation after total hip arthroplasty: a study of 10 patients. Acta Orthop Scand 2004; 75 (3): 252-60.
- Olivecrona H, Noz ME, Maguire GQ, Jr., Zeleznik MP, Sollerman C, Olivecrona L. A new computed tomography-based radiographic method to detect early loosening of total wrist implants. Acta Radiol 2007; 48 (9): 997-1003.
- Ranstam J, Ryd L, Onsten I. Accurate accuracy assessment: review of basic principles. Acta Orthop Scand 2000; 71 (1): 106-8.
- Thomas GE, Simpson DJ, Mehmood S, Taylor A, McLardy-Smith P, Gill HS, Murray DW, Glyn-Jones S. The seven-year wear of highly cross-linked polyethylene in total hip arthroplasty: a double-blind, randomized controlled trial using radiostereometric analysis. J Bone Joint Surg (Am) 2011; 93 (8): 716-22.
- Vandenbussche E, Saffarini M, Hansen U, Taillieu F, Mutschler C, Augereau B, Gregory TM. Measurement of femoral head penetration in polyethylene using a 3-dimensional CT-scan technique. Acta Orthop 2010; 81 (5): 563-9.