
Abstract
Background and purpose — In failed total ankle replacements (TARs), fusion is often the procedure of preference; the outcome after exchanging prosthetic components is debated. We analyzed prosthetic survival, self-reported function, and patient satisfaction after component exchange.
Patients and methods — We identified patients in the Swedish Ankle Registry who underwent exchange of a tibial and/or talar component between January 1, 1993 and July 1, 2013 and estimated prosthetic survival by Kaplan-Meier analysis. We evaluated the patient-reported outcome measures (PROMs) SEFAS, EQ-5D, EQ-VAS, SF-36, and patient satisfaction by direct questions.
Results — 69 patients underwent revision TAR median 22 (0–110) months after the primary procedure. 24 of these failed again after median 26 (1–110) months. Survival analysis of revision TAR showed a 5-year survival rate of 76% and a 10-year survival of 55%. 29 patients with first revision TAR in situ answered the PROMs at mean 8 (1–17) years after revision and had the following mean scores: SEFAS 22, SF-36 physical 37 and mental 49, EQ-5D index 0.6, and EQ-VAS 64. 15 of the patients were satisfied, 5 were neither satisfied nor dissatisfied, and 9 were dissatisfied.
Interpretation — Revision TAR had a 10-year survival of 55%, which is lower than the 10-year survival of 74% for primary TAR reported from the same registry. Only half of the patients were satisfied. Future studies should show which, if any, patients benefit from revision TAR and which patients should rather be fused directly.
Total ankle replacement (TAR) is an alternative to fusion in patients with degenerative joint disease in the ankle. The failure rate of TAR is higher than that for hip and knee replacements (CitationHenricson et al. 2011b). The increasing popularity of TAR will lead to an increasing number of revisions in the future. Fusion is the preferred method of treatment for failed TAR (CitationHopgood et al. 2006, CitationCulpan et al. 2007, CitationDoets and Zurcher 2010, CitationHenricson and Rydholm 2010). One reason may be that little is known about the outcome after exchange of one or more components, which is the alternative limb-saving procedure. CitationHintermann et al. (2013) reported the largest study so far on the subject, where the estimated prosthetic survival rate of 117 exchanged TARs was 83% at 9 years.
We describe the survival rate, methods of treatment for failures, and patient-reported outcome measures (PROMs) for all revision TARs with exchange of tibial, talar, or tibial and talar components that were performed in Sweden from January 1, 1993 until July 1, 2013.
Patients and methods
Primary TARs and secondary ankle replacement procedures carried out in Sweden since 1993 have been reported to the Swedish Ankle Registry (www.swedankle.se, CitationHenricson et al. 2011b). The following information can be found in the database: patient identification, date of primary procedure and dates of revision procedures, type of primary and secondary prosthesis, hospital and surgeon, side, primary diagnosis, cause of failure (loosening of tibial, talar, or tibial and talar component, technical failure, infection, or other (fracture, meniscal rupture, instability, varus or valgus malalignment, or pain)), and the revision method (exchange of tibial, talar, or tibial and talar component, exchange of meniscal insert, fusion, amputation, soft tissue procedure, or other (defined by free text)).
Until July 1, 2013, 1,032 primary TARs were registered for 986 patients (597 of them women). Of these patients, 69 (44 women) underwent 73 revisions with exchange of the tibial and/or talar component. Isolated exchange of a worn or fractured meniscus was excluded. None of the patients underwent bilateral revision. 3 patients were revised more than once—2 twice and 1 three times. Mean age at the time of primary TAR surgery was 53 (25–71) years and mean age at the time of revision surgery was 55 (26–75) years. The main primary diagnosis was posttraumatic arthritis (). 8 patients with revision TAR had died before July 1, 2013, all of them with the first revision TAR in situ.
Table 1. Primary diagnoses of patients with revision TAR and status after revision TAR including 95% CI for risk of new failure
STAR was the most common type of primary prosthesis in the 69 patients who underwent revision TAR. The mean time from primary surgery to revision surgery—according to the type of primary prosthesis—is shown in . The revision procedures were carried out in 9 Swedish hospitals by 9 surgeons.
Table 2. Types of primary prostheses in 69 patients who underwent revision TAR, and time from primary surgery to revision
Failure of a revision TAR, defined as removal of one or both components of the implant and followed by either repeat revision TAR, fusion of the ankle joint, or amputation, was registered. A separate analysis focused on whether and how often the patients underwent additional surgical procedures in the revised ankle. To facilitate true comparison between the survival rate of primary TAR and revision TAR, we re-analyzed the previously published Swedish survival data on primary TARs (CitationHenricson et al. 2011b) with the definition of failure used in this report (exchange of tibial, talar, or tibial and talar components).
The following forms/questionnaires relating to PROMs were sent to all patients who were alive and who had had a revision TAR in situ for a minimum period of 12 months: the validated self-reported foot and ankle score (SEFAS), the EuroQol 5-dimension (EQ-5D) scale and EuroQol visual analog scale (EQ-VAS) for health, the Short Form-36 questions (SF-36) scale, and a specific question regarding satisfaction. SEFAS provides a value between 0 and 48 where a value of 48 indicates normal foot and ankle function (CitationCoster et al. 2012). The EQ-5D index provides values between −0.594 and 1, where a value of 1 indicates full health. EQ-VAS expresses the self-estimated health on a visual analog scale from 0 to 100 where a value of 100 indicates full health. The generic SF-36 score, which estimates health-related quality of life (HRQoL), provides values between 0 and 100. A value of 100 indicates perfect HRQoL, either summarized by 2 scores (physical and mental health) or specified by 8 different subscales where the 2 subscales “bodily pain” and “physical function” can estimate patients’ overall physical health. Regarding satisfaction, we asked the patients if they were very satisfied, satisfied, neither satisfied nor dissatisfied, dissatisfied, or very dissatisfied with their revision TAR. The 2 patients who underwent more than 1 revision TAR and with the latest prosthesis still in place answered the questionnaires but were excluded from the overall evaluation. Of the 33 patients who were alive and who had had the first revision TAR in situ for a minimum of 12 months, 29 answered the PROMs at a mean time of 8 (1–17) years after their revision. Not all of the 29 patients answered all of the questionnaires.
Statistics
Survival of the revision TAR was estimated by Kaplan-Meier analysis with failure as endpoint, defined as removal of the tibial and/or talar component of the implant. Data are reported as numbers and proportions (%), or medians and means with ranges or 95% confidence intervals (CIs). The mean and median of any particular score were fairly similar, and the scores were considered to be normally distributed. Thus, the CI of mean scores was estimated assuming a normal distribution, whereas the CI of absolute counts was assessed according to Fisher’s exact test, due to small numbers. The statistical analyses were performed with SPSS version 22.
Ethics
Patients who undergo a TAR in Sweden are informed about the Swedish Ankle Registry and are offered participation by verbal agreement. To date, none of the patients have declined participation or changed their mind later on. The study was approved by the ethics committee of Lund University (January 28, 2010; no. 2009/698) and was performed according to the Declaration of Helsinki.
Results
Median time from primary TAR surgery to revision TAR surgery in the 69 cases was 22 (0–101) months. Aseptic loosening was the cause of revision in 37 cases ().
Table 3. Causes of failure of primary TAR and status after revision TAR a
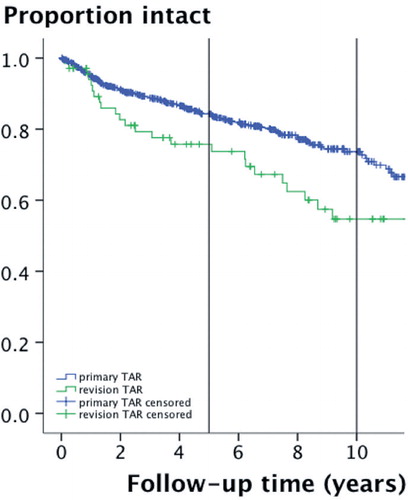
24 of the 69 patients with a revision TAR had a new failure after median 26 (0–110) months (). The survival rate of revision TAR was 76% at 5 years and 55% at 10 years (). The data of CitationHenricson et al. (2011b), as re-analyzed for this study, showed a survival rate of primary TARs performed in Sweden between 1993 and June 15, 2010 of 84% after 5 years and 74% after 10 years. The patients with a new failure of their revision TAR were 4 of the 14 patients with osteoarthritis as primary diagnosis, 9 of the 16 patients with rheumatoid arthritis as primary diagnosis, and 10 of the 38 patients with posttraumatic arthritis as primary diagnosis ().
Figure 1. Flow chart of the 69 patients with revision TAR. a 4 patients with revision TAR <12 months ago not included in PROM evaluation.
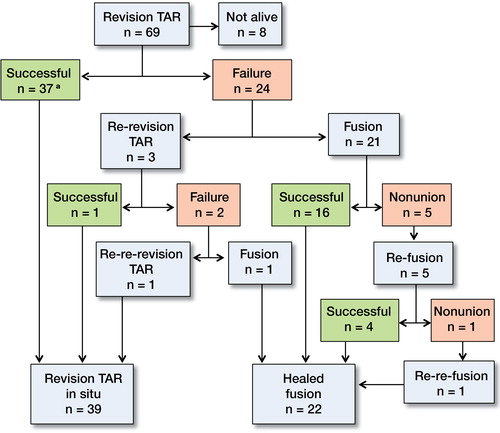
Figure 2. Survival of revision TARs, showing a 5-year survival rate of 76% and a 10-year survival rate of 55%. For comparison, the survival of primary TARs in the Swedish Ankle Registry (CitationHenricson et al. 2011b), modified by excluding meniscus exchange, showed a 5-year survival rate of 84% and a 10-year survival rate of 74%.
Patients with aseptic loosening of the primary TAR had a new failure in 10 of 37 cases (). Technical failure or any other reason for failure of the primary TAR resulted in a new failure in 14 of 30 cases, whereas the 2 revision TARs after infection were both in situ at follow-up.
21 of the 24 patients with a failed revision TAR underwent fusion. 5 of these patients developed non-union and underwent a repeated fusion, after which 4 healed. Non-union remained in the fifth patient, who then underwent a successful third fusion. 3 of the 24 patients with a failed revision TAR underwent a second revision TAR. The second revision TAR was successful in 1 of these patients, but there were 2 repeat failures. After the second failed revision TAR, 1 patient’s ankle was successfully fused while the other patient was given a third revision TAR, which was still in situ at follow-up after 6 years ().
Of the 69 patients, 41 had no additional surgical procedures after the first revision TAR registered in the database. 47 surgical procedures were registered for the remaining 28 patients after their first revision TAR. Of these procedures, 34 were major secondary revisions such as repeat exchange of prosthetic components, fusion, or repeat fusion, whereas 13 procedures were osteotomies, soft tissue procedures, or subtalar fusion.
shows the patient-reported outcome for 29 patients who were alive with the first revision TAR still in place. 15 patients were very satisfied or satisfied with their revision TAR, 5 patients were neither satisfied nor dissatisfied, and 9 patients were dissatisfied or very dissatisfied ().
Table 4. Mean functional scores and patient satisfaction after revision TAR
Table 5. Degree of patient satisfaction after revision TAR related to primary diagnosis. Values are number of patients within each group
Discussion
We found that revision TARs have a lower survival rate than primary TARs in the Swedish Ankle Registry. The subjective outcome after revision TAR was unsatisfactory, in that only half of the patients with first revision TAR in place were satisfied with the revision prosthesis.
In Sweden, primary TARs have been reported to have a survival rate of 81% after 5 years and 69% after 10 years (CitationHenricson et al. 2011b). Our modified survival analysis with removal of tibial and/or talar components as endpoint showed a survival rate of primary TARs of 84% and 74% respectively. The 5-year survival of revision TARs in the present study was slightly lower (76%), whereas the 10-year survival rate was considerably lower (55%). A direct comparison between primary and secondary ankle prostheses must be done with care, as there is patient selection in the group with revision TAR. In any case, the differences in prosthetic survival between primary and revision TAR might indicate that, in contrast to failed TKA or THA, revision arthroplasty of failed ankle prostheses is not necessarily the treatment of choice. We noted absolute differences in outcome depending on the primary diagnosis or the cause of failure of the primary TAR, which may indicate a higher risk of failure of a revision TAR in cases where the primary TAR failed for technical or unspecified reasons, and in patients with rheumatoid arthritis. Further studies with stronger statistical power should be done to determine whether this assumption may be true. We found 2 very early revisions with exchange of the tibial component only a few weeks after primary TAR. Both were classified as “technical failure” by the surgeon, but unfortunately no additional information was available.
Each of the 69 patients with a revision TAR had at least 2 major surgical procedures in the ankle, the primary TAR and the revision TAR. Moreover, 28 of these patients underwent 47 additional surgical procedures, 34 of which were again major revisions—either a repeat revision or an ankle fusion. It is obvious that we must inform the patient when considering a primary TAR—and especially when discussing a secondary TAR—that there is a substantial risk that the procedure will be followed by additional surgeries. The risk of major revision surgery after primary TAR has been examined previously. CitationSooHoo et al. (2007) compared reoperation rates following primary ankle fusion and TAR. During the 10-year study period, their 480 TARs had a higher risk of major revision surgery than their 4,705 ankle fusions. CitationSaltzman et al. (2009) compared initial results of STAR ankle prostheses and of ankle fusion, and found equal or superior clinical outcome in the arthroplasty group but also a higher risk of perioperative complications and major revision surgery.
We found low functional scores in the patients with a revision TAR in place compared to the average scores for the Swedish population (www.euroqol.com, CitationSullivan et al. 1995). Only about half of the patients were satisfied, and almost one-third of the patients were dissatisfied with their revision prosthesis.
There are few reports in the literature on the results of revision TAR. CitationKotnis et al. (2006) found inferior outcome after revision TAR. Their 5 patients with revision TAR had more pain than their 9 patients who were revised with fusion. Kharwadkar and Harris (2009) reported good short-term results of revision TAR in 2 cases. CitationHintermann et al. (2013) analyzed 117 cases where each failed primary TAR was revised with a similar type of prosthesis, and all by the same surgeon. They achieved a 9-year survival rate for the revision TARs of 83%, which was similar to their outcome after primary TARs. It appears that there are currently no general recommendations on how to treat a failed TAR. Fusion as an alternative limb-saving surgical procedure to revision TAR has been reported to give fair to good results, but the outcome may depend on the primary diagnosis and also on the fixation technique (CitationHopgood et al. 2006, CitationCulpan et al. 2007, CitationDoets and Zurcher 2010, CitationHenricson and Rydholm 2010).
The strengths of the present study include the fact that the sample of patients with revision TAR is currently one of the largest to be published. The study also captured the actual surgical outcome of this procedure in the general healthcare system, since the sample involved a complete unselected nationwide cohort of patients treated in various hospitals with different techniques, and by different surgeons with varying competence and experience. Using this study design, we could determine the outcome of nationwide revision TAR surgery—not only from highly specialized units or specific cohorts. The inclusion of validated PROMs is a strength, as this facilitates comparison with other studies. In comparison to some other studies, our definition of revision TAR precluded the exchange of a worn or fractured meniscus (CitationHenricson et al. 2011a). Our justification for this definition was to find out what method might give better outcome when the situation required a choice between fusion and a new prosthesis.
The weaknesses of the study include the risk of incomplete reporting, as in all registry studies. We feel confident, however, that the reporting to the Swedish Ankle Registry is complete or almost complete, as only a few surgeons perform TARs in Sweden—all of whom have a common interest in the Swedish Ankle Registry. A comparison of registry data with official Swedish national health authority data confirmed this assumption.
Despite the fact that it is possible to register the design of a revision prosthesis, no registration of this was found for several procedures and we regard this as another weakness of the present study. It might have been valuable to investigate a possible correlation between revision prosthetic design and a new failure, but such an analysis would have required a greater number of patients. The distribution of 69 revision TARs among 9 surgeons means that there were only a few cases per surgeon. Even so, these surgeons are responsible for all or almost all TAR surgery (primary and secondary) in Sweden, and they have the highest competence available in the country. The fact that other studies have found better results with cases treated in their unit and/or by the same surgeon might indicate differences in case mix, or that the total number of TAR procedures in Sweden should be distributed among even fewer surgeons and units in the future.
Another limitation is the lack of preoperative PROM data—which would enable prospective estimation of registration and efficacy—and of data on bone quality, alignment, and any other pre- and perioperative information that might be of importance for current or future failures. The importance of these factors must not be underestimated, and they should be examined further in future studies to find the best treatment algorithm for failed TARs. Another weakness is the lack of outcome data after a failed primary TAR treated with ankle fusion. Direct comparison of the outcome of fusion and revision TAR after a failed primary TAR should also be done in future studies. Finally, the small numbers in the respective subgroups made us refrain from statistical testing.
In summary, based on our results, revision TAR may not necessarily give the desired benefit after a failed primary TAR. Future studies should determine whether results can be improved by centralizing revision TAR surgery in highly specialized units. Larger study groups are needed, and both the outcome and function of fusion as the alternative limb-saving procedure after a failed primary TAR must be compared with the results of revision TAR.
IK, AH, BR, HM, MK, and ÅC designed the study. IK, AH, and ÅC collected data. IK, BR, MK, and ÅC interpreted the data. IK and JÅN did the statistical analyses. IK, AH, and BR wrote the first draft of the manuscript and all the authors reviewed it.
No competing interests declared.
- Coster M, Karlsson MK, Nilsson JA, Carlsson A. Validity, reliability, and responsiveness of a self-reported foot and ankle score (SEFAS). Acta Orthop 2012; 83 (2):197–203.
- Culpan P, Le Strat V, Piriou P, Judet T. Arthrodesis after failed total ankle replacement. J Bone Joint Surg Br 2007; 89 (9):1178–83.
- Doets HC, Zurcher AW. Salvage arthrodesis for failed total ankle arthroplasty. Acta Orthop 2010; 81 (1):142–7.
- Henricson A, Rydholm U. Use of a trabecular metal implant in ankle arthrodesis after failed total ankle replacement. Acta Orthop 2010; 81 (6):745–7.
- Henricson A, Carlsson A, Rydholm U. What is a revision of total ankle replacement? Foot Ankle Surg 2011a; 17 (3):99–102.
- Henricson A, Nilsson JA, Carlsson A. 10-year survival of total ankle arthroplasties: a report on 780 cases from the Swedish Ankle Register. Acta Orthop 2011b; 82 (6):655–9.
- Hintermann B, Zwicky L, Knupp M, Henninger HB, Barg A. HINTEGRA revision arthroplasty for failed total ankle prostheses. J Bone Joint Surg Am 2013; 95 (13): 1166–74.
- Hopgood P, Kumar R, Wood PL. Ankle arthrodesis for failed total ankle replacement. J Bone Joint Surg Br 2006; 88 (8):1032–8.
- Kharwadkar N, Harris NJ. Revision of STAR total ankle replacement to hybrid AES-STAR total ankle replacement-a report of two cases. Foot Ankle Surg 2009; 15 (2):101–5.
- Kotnis R, Pasapula C, Anwar F, Cooke PH, Sharp RJ. The management of failed ankle replacement. J Bone Joint Surg Br 2006; 88 (8):1039–47.
- . Saltzman CL, Mann RA, Ahrens JE, Amendola A, Anderson RB, Berlet GC, et al. Prospective controlled trial of STAR total ankle replacement versus ankle fusion: initial results. Foot Ankle Int 2009; 30 (7):579–96.
- SooHoo NF, Zingmond DS, Ko CY. Comparison of reoperation rates following ankle arthrodesis and total ankle arthroplasty. J Bone Joint Surg Am 2007; 89 (10):2143–9.
- Sullivan M, Karlsson J, Ware JE, Jr. The Swedish SF-36 Health Survey--I. Evaluation of data quality, scaling assumptions, reliability and construct validity across general populations in Sweden. Soc Sci Med 1995; 41 (10):1349–58.