
Abstract
Background and purpose — Although the results of primary total hip replacements (THRs) are generally excellent, sometimes serious complications arise. Some of these severe complications are considered to be patient injuries. We analyzed primary THR-related patient injuries in a nationwide setting.
Patients and methods — We evaluated all the primary THR-related patient injury claims in Finland between 2008 and 2010. We used the original medical records and 2 nationwide registries, the Care Register for Social Welfare and Health Care and the Patient Injury Claim Register.
Results — We identified 563 claims, 44% of which were compensated (n = 250). Of these 250 compensated claims, 79% were considered to be avoidable (treatment injuries) and 21% were severe unexpected infections (with a preoperative infection risk of less than 2%). The most common type of technical error was cup malposition (31%). High-volume hospitals (with an annual primary THR volume ≥ 400) had a lower patient injury rate. In lower-volume hospitals (with an annual primary THR volume of < 400), the relative risks (RRs) of patient injury for any reason, due to technical errors, or because of cup malposition were 2-fold (95% CI: 1.6–3.1), 4-fold (95% CI: 2.3–6.2), and 9-fold (95% CI: 3–28), respectively, compared to high-volume hospitals.
Interpretation — Our study provides the first comprehensive nationwide data on THR-related patient injury types. Hospital volume was associated with the quality and quantity of errors detected. An annual hospital volume of ≥ 400 primary THRs was established as a protective factor against patient injuries.
Although total hip replacement (THR) is considered to be a safe procedure, early complications and re-admission rates from 8% to 10% have been reported after primary THR (DeHart and Riley Citation1999, Khatod et al. Citation2006, Fehringer et al. Citation2010, Namba et al. Citation2012, Wolf et al. Citation2012). Most of these early complications cannot be avoided; nor do they lead to significant harm to the patient, e.g. superficial wound infections (Walmsley et al. Citation2005). However, sometimes serious and even fatal complications arise (Parvizi et al. Citation2001,Citation2007) and some of these can be considered to be patient injuries.
Learning from accidents is a widely used cornerstone of safety analysis, and in medicine, complications are an important source of information. Patient injuries have been shown to occur mainly during routine procedures (Regenbogen et al. Citation2007) and they represent the more severe end of the spectrum of complications (May and Stengel Citation1990, Sloan and Hsieh Citation1995, Studdert et al. Citation2000, Bismark et al. Citation2006, Dunbar and Sabry Citation2007). For a complication to be considered a patient injury in the Finnish “no-fault” insurance system, it must fulfill 1 of the 7 compensation criteria defined in the Patient Injury Act, and the consequences for the claimant must be sufficiently severe (). Therefore, only avoidable or sufficiently severe complications may qualify as patient injuries.
Table 1. Compensation criteria
Primary THR has been the leading cause of patient insurance claims in Finland for years (Statistics of Finnish Patient Insurance Center, 2015). In Finland, patients file a claim after THR up to 26 times more avidly than after hospitalization in general (Järvelin et al. Citation2012). Previous studies have indicated that high-volume hospitals and surgeons, continuous advances in intraoperative care, and improved surgical techniques may reduce postoperative complications, morbidity, and mortality after primary THR (Parvizi et al. Citation1999, Katz et al. Citation2001, Yasugana et al. Citation2009, Ravi et al., Citation2014). The purpose of this study was to investigate the types of injury, the mechanisms, and the factors that lead to patient injuries after primary THR in a nationwide setting.
Patients and methods
The patient insurance scheme in Finland (“no-fault”)
Nordic countries including Finland have adopted a “no-fault” patient insurance system (Mikkonen Citation2004) based on the concepts of “preventability” and “tolerability” rather than “negligence”, as in the tort insurance systems used in the UK and the USA. In Finland, patient injury claims are resolved by the Patient Insurance Center, and only rarely do they advance to the legal system and the courts. Claims are handled if less than 3 years have passed from the moment the patient became aware of the injury. In its decision making, the center uses external medical experts and all available information about the case. Copies of all patient documents are requested from the healthcare institutions involved in the treatment of the claimant. The Patient Insurance Center accepts or rejects claims based on the criteria defined in the Patient Injury Act (Järvelin Citation2012). The main compensation criteria for typical THR-related complications are shown in .
Study period and registry sources
Patient injury claims were collected from the Patient Insurance Center Claim Register (see below). The Care Register for Social Welfare and Healthcare (HILMO) was used as a source of patient characteristics for all THR recipients (), and of hospital primary THR volumes (). The data were collected from the HILMO between 2005 and 2010. The time period was chosen to ensure that the control THR recipients (“non-claimants”, ) were operated on during the same time period as the claimants due to the allowed 3-year delay in claim filing (see above). Altogether, 93% of patient injury claimants who filed a claim in the period 2008–2010 had their primary operation between 2005 and 2010. The 3-year average hospital volumes were used in the RR analyses, as the patient injuries were also collected from the 3-year time period.
Table 2. Patient and operation characteristics (expressed as %)
Table 3. The relative risks (RRs) of claims, patient injuries, and specific technical error types in Groups 1–3 with Group 4 as reference group
Patient Insurance Center data collection
Data on all patients who had filed a claim relating to primary THR surgery in Finland between January 1, 2008 and December 31, 2010 were collected from the claim register of the Patient Insurance Center. Claims related to primary THR with surgical procedures NFB30–62 according to the Nordic Medico-Statistical Committee’s classification of surgical procedures (NCSP) were included in the study. Patients who had hip fracture as a cause of THR were excluded (). The original patient documents, radiographs, and claim decisions were reviewed (by TH) and analyzed. The information and variables collected included patient characteristics (age, sex, diagnoses), the hospital, and detailed characteristics of the operations (operated side, surgical approach, surgeon’s experience, and type of implant (cemented vs. cementless)).
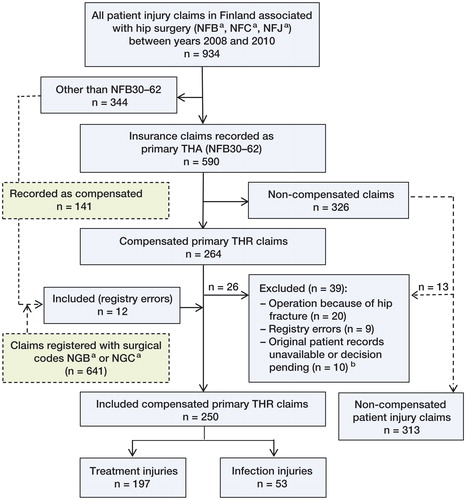
Figure 1. Flow chart of data collection. NFB: any primary hip arthroplasty operation; NFC: any hip revision operation; NFJ: any hip fracture operation; NGB: any primary knee arthroplasty; NGC: any revision knee arthroplasty. a 2 claims of 10 were from high-volume hospitals (group 4). 9 claims were treatment injury claims, and 1 was an infection claim (group 3).
Categorization of hospital volume
Hospitals performing primary THRs in Finland were categorized into 4 groups according to the average annual volume of each hospital between 2005 and 2010. Overall, 67 hospitals were grouped based on volume as follows: < 100 (group 1), 100–199 (group 2), 200–399 (group 3), and ≥ 400 (group 4). Group 4 hospitals (later referred to as “high-volume centers”) were used as the reference group in the relative risk (RR) analyses in , to investigate the effect of hospital volume on types of patient injury. Other hospital groups were also compared with each other (). No uniform categorization of hospital volume exists in the literature. The high-volume group 4 hospitals were all university teaching hospitals.
Analysis of associated factors
We investigated how different factors (age, sex, primary diagnosis, operation type, and annual primary THR volume of the operating hospital) were associated with claim filing and claim decisions. We also determined whether patients operated on in various volume hospitals differed regarding these factors.
Classification of compensated treatment injuries
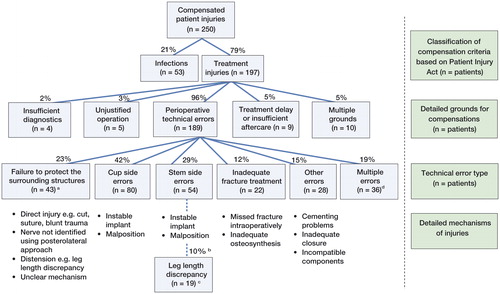
The Patient Injury Act categorizes all compensated claims into 7 classes. We divided the treatment injuries into 6 subclasses, which were further analyzed and divided according to the type of error or the injury mechanism. The classification of compensated patient injuries is shown in .
Figure 2. Types of patient injury. a Nerve or vascular lesions/injuries. b Percentage (%) of all perioperative technical errors. c Unplanned leg length difference of > 2 cm due to stem malposition. d Two patients had 3 errors.
Statistics
Unless otherwise stated, analyses were conducted using the chi-square test. Logistic multivariate regression models were used when patient-specific variables were available, and they were tested using STATA 12 software. Statistical significance was set at an alpha level 0.05. Relative risk and 95% confidence intervals (CIs) were calculated according to Gardner and Altman (Citation1994). Group 4 hospitals were used as the reference group in RR calculations. The number of treatments needed to cause a compensatable technical error for lower-volume hospitals (groups 1–3) was calculated based on absolute risk reduction (Cook and Sackett Citation1995, Bender Citation2001).
Ethics
Permission to carry out the study was obtained from the Finnish Ministry of Social Affairs and Health (STM/4724/2011). The study was conducted according to the Declaration of Helsinki. Data handling was performed according to Finnish data protection legislation.
Results
During the study period, 563 THR-related claims were resolved by the Patient Insurance Center (). The incidences of all filed claims and of filed infection claims during the study period were 2.6% and 0.6%, respectively. Of all the claims filed, 44% were compensated (). Of all the compensated claims, 79% were treatment injuries and 21% were infection injuries (). The incidences of compensated claims and of compensated infections were 1.2% and 0.2%, respectively. The overall risk for patient injuries was lower for patients who were operated on in high-volume hospitals (Group 4) ().
Patient-reported reasons for filing a claim
Common problems raised by claimants were pain and/or dissatisfaction with the function of the artificial hip joint. One or both were addressed in the majority of the claims associated with treatment injuries. Some other specific clinical problems reported by claimants in their claims included infections (n = 121), nerve damage (n = 111), leg length discrepancy (n = 85), fracture treatment (n = 55), dislocation (n = 41), and delay in treatment (n = 17). The compensation rates for these were as follows: infections 44%, nerve damage 36%, leg length discrepancy 28%, fracture treatment 20%, dislocations 71%, and delays in treatment 35%.
Patient-related and operation-related variables associated with patient injuries
THR recipients were more inclined to file a claim if they were under 65 years of age, if they were operated with fully cementless implants, or if they were operated in hospitals that performed less than 400 primary THRs annually (). Infection claimants were also more often males and more often operated in group 1–3 hospitals (). Compared to group 4 hospitals, for THR recipients who were operated in group 1–3 hospitals, the RRs for filing a claim for any reason—due to infection or due to treatment injury—were 1.8 (CI: 1.5–2.2), 1.6 (CI: 1.1–2.4), and 1.8 (CI: 1.5–2.3), respectively (). None of the variables were associated with Patient Insurance Center claim decisions (). Since a higher proportion of denied claims in group 4 hospitals was noted (p = 0.05), a multivariate logistic regression model analysis was also conducted. Analysis showed only a trend (odds ratio (OR) = 1.5, CI: 0.97–2.3; p = 0.07). Patients operated in high-volume centers (group 4) were otherwise similar to THR recipients operated in lower-volume hospitals (groups 1–3) for all patient-related and operation-related characteristics, but statistically significantly more patients with secondary causes of osteoarthritis were operated on in high-volume centers (group 4) than in group 1–3 hospitals ().
Types of injury
Compensated THR-related patient injuries were divided into 2 categories: treatment injuries and infection injuries ( and ).
Treatment injuries and technical errors
On average, every 109th and 140th THR resulted in compensated treatment injury and compensated intraoperative technical error, respectively. Intraoperative technical errors were the single most frequently compensated type of treatment injury detected. Malposition of the cup was the most common type of intraoperative technical error (31%) based on the Insurance Center expert evaluations. Almost half (47%) of patients with cup malposition had dislocation after their primary operation and 85% of compensated claimants with dislocation had a malpositioned cup. Malposition of the stem was the most common compensated error on the femoral side. It accounted for 61% of stem-side technical errors, 58% of which resulted in leg length discrepancy. Inability to protect the surrounding nerves and blood vessels was a reason for compensation in 43 technical error claims (22%). 3 of these were vascular injuries, all of which were operated on using the anterolateral (Harding) approach. Of all nerve injuries, a direct injury was detected in one-third of cases. Of all claimants compensated for nerve injuries, two-thirds had been operated on via the posterolateral approach.
Infection injuries
All compensated infection injuries (n = 53) were deep surgical site infections. The RR of filing a claim because of infection was higher in males (RR = 1.6, CI: 1.0–2.4) () and in patients who were operated on in group 1–3 hospitals (). Compared to high-volume centers, the risk of infection injuries that were compensated was statistically significantly higher in group 2 hospitals only ().
Factors associated with patient injuries
Hospital volume. An annual hospital volume above 400 primary THRs was associated with fewer filed claims, fewer compensated claims, and fewer compensated technical errors ( and ).
Figure 3. Hospital volume and patient injuries. A. The association between high THR volume and lower incidence of claims filed, compensated claims, and perioperative technical errors. B. The number of compensated claimants with avoidable technical errors in each individual hospital performing total hip replacements (THRs) relative to hospital volume. Hospitals with over 50 primary THRs per year were included. The thick red line represents the average rate of compensated claimants with perioperative technical errors in Finnish hospitals. Hospitals below the line performed better than the national average.
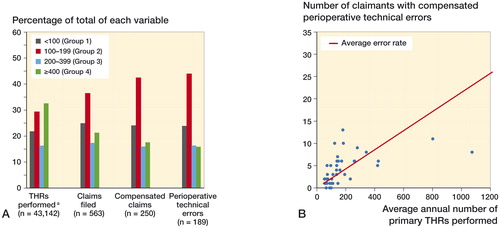
High-volume centers (group 4) performed 34% of all THRs in Finland. Even so, these hospitals accounted for only 21% of the filed claims and for 18% of the compensated patient injuries (). For patients who were operated on in group 1–3 hospitals, the RR of compensations for any reason were increased over 2-fold (RR = 2.3, CI: 1.6–3.1), and for technical errors almost 3-fold (RR = 2.6, CI: 1.7–3.8) (). The number needed to treat to cause an unnecessary compensatable intraoperative technical error for lower-volume hospitals (groups 1–3) was 150 (CI: 112–228), meaning that every 150th THR performed in lower-volume hospitals resulted in a patient injury that could have been avoided by operating the patient in a high-volume joint center (group 4).
The quality of technical errors was also different depending on the hospital volume (). Postoperative leg length discrepancy and intraoperative nerve damage were the only avoidable error types detected at a similar rate in all hospitals. In group 4 hospitals, however, these 2 error types accounted for 60% of all compensated technical errors, whereas in group 1–3 hospitals the corresponding percentage was 23%. Instead, the risk of technical errors classified as “other errors” was 13 (CI: 2–96) times higher for patients who were operated on in group 1–3 hospitals rather than group 4 hospitals ().
Surgeons
Compensated intraoperative technical errors (n = 189) were distributed among 112 surgeons. 2 surgeons with the most patient injuries had operated on 8% of all patients who were compensated due to technical errors. Only 9 surgeons had more than 1 compensated technical error per year. These 9 surgeons had operated on 24% of all claimants who were compensated due to technical errors, and they produced 53% more compensated technical errors than all group 4 hospitals together. Some of these 9 surgeons operated in several different hospitals. The individual THR volumes of Finnish orthopedic surgeons are not available in any register. Thus, to minimize the possibility that a small number of surgeons might explain the association detected between hospital volume and patient injuries, we excluded all 9 surgeons with more than one technical error per year from the hospital volume effect calculations. After this exclusion, the risk of compensation in group 1–3 hospitals for any reason was still over 2-fold (RR = 2.2, CI: 1.5–3.3), and for technical errors almost 3-fold (RR = 2.9, CI: 1.7–4.9), compared to that for high-volume joint centers ().
Discussion
Complications are important outcome measures of the quality of medical care. Patient injuries are usually avoidable complications due to technical errors or unexpected infections, and better represent the more severe end of the spectrum of complications. To our knowledge, the present study is the first to provide a comprehensive nationwide analysis of THR-related patient injuries, using the original patient records.
Almost 80% of the patient injuries in Finland were caused by avoidable errors (treatment injuries). The average incidence of compensated treatment injuries was 1 injury per 109 THRs. The vast majority of these were intraoperative technical errors, of which cup malposition was the most common type of error. According to a registry analysis of almost 180,000 revisions, dislocations and technical errors are mainly related to incorrect orientation of the implant and the second leading cause of revisions in Sweden (after aseptic loosening) (Malchau et al. Citation2002). Another study monitoring the quality of THR found that approximately 25% of all THRs failed due to factors related to technical errors (Biau et al. Citation2011). The types of injury and their frequencies found in the present study were also very similar to those reported earlier for closed malpractice claims of THR recipients in the USA (Matsen et al. Citation2013). Acetabular-side errors have previously been shown to account for half of all technical errors in THRs (Biau et al. Citation2009,Citation2011), and up to 60% of acetabular components have been shown to be in a suboptimal position, depending on the target ranges used (Barrack et al. Citation2013, Lee et al. Citation2014). Our results are in line with the literature. What our study adds to this knowledge is that technical errors are a clinically important source of severe complications (patient injuries) and that they are associated with the THR volume of the hospital.
The overall risk of patient injury after THR was lower in hospitals with an annual volume above 400 THRs despite the fact that patients operated in these hospitals more often had secondary causes of osteoarthritis and therefore a higher degree of surgical complexity. There was also a difference in the quality of the errors detected between high-volume hospitals and lower-volume hospitals. It has been reported previously that high-volume surgeons and hospitals have less complications in primary THR surgery (Lavernia and Guzman Citation1995, Kreder et al. Citation1997,Citation1998, Norton et al. Citation1998, Battaglia et al. Citation2006, Ravi et al. Citation2014). One explanation for this might be the better routines of highly specialized surgeons and staff in high-volume centers. There were also hospitals of groups 1–3 with a low incidence of patient injuries. The relatively short study period and also chance may partly explain this. It might also be that the quality of performance in some of these hospitals is at same level as in the high-volume centers. A small group of orthopedic surgeons (n = 9) performed 24% of all the THRs with reported compensated technical errors in Finland, and produced over 50% more technical errors than the 4 largest joint centers put together. Although we were not able to analyze the individual surgeon volumes, this group of surgeons with the most technical errors does not explain the association between lower hospital volume and higher incidence of patient injuries. When these 9 surgeons were analyzed more closely, it was noted that some operated in different hospitals and that some were the heads of their orthopedic departments. Both of these findings highlight essential flaws in the current supervisory process. When self-evaluation is practiced or when heads of orthopedic departments who are responsible for supervision are only aware of what happens in their own hospital, it is virtually impossible to control and eliminate these risk factors. Better coordination and corrective measures in the hospitals by the hospital administration—or establishment of a nationwide supervision body focusing on benchmarked performance standards—would therefore be beneficial. A public register and open reporting of hospital- and surgeon-level performance in a way that the National Institute for Health and Care Excellence (NICE) in the UK operates would be a valuable tool for this kind of supervisory body, enhancing safety and improving patient care in endoprosthetic surgery.
When conclusions are being drawn from studies investigating patient injuries, one has to take into account that the spectrum of complications detected is somewhat skewed, since a large proportion of adverse events are neither compensatable nor avoidable, e.g. superficial infections (Walmsley et al. Citation2005). Furthermore, only some of all the complications qualify as patient injuries—and these represent the more severe end of the spectrum of complications. Our study therefore highlights what kinds of avoidable severe complications occur after THR. Also, reporting bias has to be accounted for. It has been suggested that only 3% of all patients who are eligible for compensation (severe complications) ever file claims (Studdert et al. Citation2000, Bismark et al. Citation2006, Järvelin Citation2012). The average rate of patient injury claims after hospitalization varies between 0.1% and 0.3% (Pukk et al. Citation2003, Järvelin Citation2012). In the present study, 2.6% of all THR recipients filed a patient injury claim and 1.2% were compensated. The incidences were similar to those noted earlier in Finland, between 1998 and 2003 (Järvelin et al. Citation2012). This shows that THR recipients file patient injury claims up to 26 times more often than patients in general after hospitalization. At the same time, the claim rejection rate among THR recipients is similar to the average claim rejection rate in the Patient Insurance Center. It is therefore clear that the THR-related patient injuries that are compensated (1.2%) represent more than 3% of severe complications, because severe complications that are eligible for compensation are not experienced by 40% of THR recipients. This better coverage is most likely due to the substantially higher claim rate detected among THR recipients. Although many complications are not reported, the mechanisms behind the adverse events reported are most likely similar to those behind complications in general (Järvelin Citation2012). Studies investigating patient injuries are therefore an important source of information about the factors and mechanisms behind the severe complications in THR.
Strengths and limitations
The strengths of our study included the large patient cohort and the prospectively collected registry data. We used 2 comprehensive nationwide registers in the data collection and in the analyses. Patient injury claims were collected from the registry data of the Patient Insurance Center, which manages all patient injury claims in Finland. Each patient injury claim and decision (including patient records and radiographs) was individually assessed by a specialist in the field of endoprosthetic surgery (TH). In Finland, operative treatments in hospitals are heavily subsidized, with few socioeconomic barriers, resulting in national registry data that is highly generalizable. The no-fault insurance system also limits socioeconomic barriers, as claim filing and handling are always free of charge to claimants. We combined several different data sources, which has been suggested to further strengthen the generalizability of patient injury studies (Järvelin Citation2012). Although Finland and other Nordic countries use the no-fault insurance system, many other countries rely on tort systems. This might affect the generalizability of these results beyond Nordic countries. However, a recent study from the USA (Matsen et al. Citation2013) found similar technical error types and rates in THR to those in our study. High-volume hospitals (group 4) had less patient injuries. Several different variables such as patient awareness, age, sex, and socioeconomic status may affect the likelihood that a patient will file a claim after an adverse event (Studdert et al. Citation2000, Bismark et al. Citation2006, Dunbar and Sabry Citation2007). None of the variables investigated explained the better performance of high-volume centers. It has also been suggested that hospital culture (active information on patient insurance) and patient awareness have an influence on the likelihood that a patient will file a claim. This is undoubtedly true; however, the differences between individual hospitals will most likely be evened out in a nationwide study. There was a trend that claims by THR recipients from lower-volume hospitals (groups 1–3) were more often accepted. This might be explained by the difference in the quality of errors between high-volume joint centers and other hospitals. Finally, we lack information on the surgery volumes of individual surgeons, which has been associated with complication rates after THR. Unfortunately, these data were not available in any registries. Thus, we could not determine how surgeon volume relates to patient injuries in THR. In contrast, in Finland hospital volumes give an indication of the volumes for surgeons operating in those hospitals because, as a rule, surgeons rarely operate in more than one hospital.
Conclusion
This is the first nationwide study to investigate THR-related patient injuries in detail. We have presented the types and frequencies of several complications, adverse events, and typical avoidable technical errors leading to patient injuries. We have also shown that a high annual hospital volume (above 400 THRs) is associated with a lower incidence of filed claims, patient injuries, and avoidable technical errors. In Finland, all high-volume hospitals are university hospitals. Individual surgeons play a key role in reducing avoidable patient injuries in THR. These findings provide important new information for considering preventive measures against the complications and patient injuries in primary THR surgery. In some countries, the THR performance of hospitals is reported and published so that anyone can follow the performance of one hospital and compare it with that of other hospitals. These kinds of well-maintained registry could also give information about the individual surgeon’s performance, at least to surgeons themselves, and might improve patient care. Awareness of the usual errors related to THR and the causes of patient injuries should lead to improved patient safety through improved systems of care.
All the authors contributed to the conception and design of the study, to critical analysis of the data, to interpretation of the findings, and to critical revision of the manuscript. The authors wrote the manuscript together. HH and TH performed the statistical analysis.
We thank Reima Palonen and Saija Lehtinen of the Patient Insurance Center for their invaluable assistance and help. We also thank Mikko Peltola of the National Institute for Health and Welfare (THL) for his crucial help with HILMO data.
No competing interests declared. The study was funded by the Finnish Patient Insurance Center.
- Barrack R L, Krempec J A, Clohisy J C, McDonald D J, Ricci W M, Ruh E L, Nunley R M. Accuracy of acetabular component position in hip artroplasty. J Bone Joint Surg (Am) 2013; 95: 1760–8.
- Battaglia T C, Mulhall K J, Brown T E, Saleh K J. Increased surgical volume is associated with lower THR dislocation rates. Clin Orthop Relat Res 2006; 447: 28–33. Review.
- Bender R. Calculating confidence intervals for the number needed to treat. Control Clin Trials 2001; 22(2): 102–10.
- Biau D J, Milet A, Thévenin F, Anract P, Porcher R. Monitoring surgical performance: an application to total hip replacement. J Eval Clin Pract 2009; 15(3): 420–4.
- Biau D J, Meziane M, Bhumbra R S, Dumaine V, Babinet A, Anract P. Monitoring the quality of total hip replacement in a tertiary care department using a cumulative summation statistical method (CUSUM). J Bone Joint Surg (Br) 2011; 93(9): 1183–8.
- Bismark M, Brennan T A, Davis P B, Studdert D M. Claiming behaviour in a no-fault system of medical injury: a descriptive analysis of claimants and non-claimants. Med J Aust 2006; 185(4): 203–7.
- Cook R J, Sackett D L. The number needed to treat: a clinically useful measure of treatment effect. BMJ 1995; 310(6977): 452–4. Erratum in: BMJ 1995; 310(6986): 1056.
- DeHart M M, Riley L H Jr. Nerve injuries in total hip arthroplasty. J Am Acad Orthop Surg 1999; 7(2): 101–11. Review.
- Dunbar F C, Sabry F. The propensity to sue: why do people seek legal actions? Bus Econ 2007; 42(2): 31–42.
- Fehringer E V, Mikuls T R, Michaud K D, Henderson W G, O’Dell J R. Shoulder arthroplasties have fewer complications than hip or knee arthroplasties in US veterans. Clin Orthop 2010; (468) (3): 717–2.
- Gardner M J, Altman D G. Statistics with confidence: Confidence intervals and statistical guidelines. BMJ publications, London, Reprint 1994: 51–52.
- Järvelin J. Studies on filed and compensated claims for patient injuries. University of Helsinki. Juvenes Print – Finnish University Print Ltd Tampere, Finland 2012 [serial online]. Available from: http://urn.fi/URN:ISBN:978-952-245-750-9.
- Järvelin J, Häkkinen U, Rosenqvist G, Remes V. Factors predisposing to claims and compensations for patient injuries following total hip and knee arthroplasty. Acta Orthop 2012; 83(2): 190–6.
- Katz J N, Losina E, Barrett J, Phillips C B, Mahomed N N, Lew R A. Association between hospital and surgeon procedure volume and outcomes of total hip replacement in the United States medicare population. J Bone Joint Surg (Am) 2001; 83-A: 1622–9.
- Khatod M, Barber T, Paxton E, Namba R, Fithian D. An analysis of the risk of hip dislocation with a contemporary total joint registry. Clin Orthop Relat Res 2006; 447: 19–23.
- Kreder H J, Deyo R A, Koepsell T, Swiontkowski M F, Kreuter W. Relationship between the volume of total hip replacements performed by providers and rates of postoperative complications in the state of Washington. J Bone Joint Surg (Am) 1997; 79: 485–94.
- Kreder H J, Williams J I, Jaglal S, Hu R, Axcell T, Stephen D. Are complication rates for elective primary total hip arthroplasty in Ontario related to surgeon and hospital volumes? A preliminary investigation. Can J Surg 1998; 41: 431–7.
- Lavernia C J, Guzman J F. Relationship of surgical volume to short-term mortality, morbidity, and hospital charges in arthroplasty. J Arthroplasty 1995; 10: 133–40.
- Lee Y K, Biau D J, Yoon B H, Kim T Y, Ha Y C, Koo K H. Learning curve of acetabular cup positioning in total hip arthroplasty using a cumulative summation test for learning curve (LC-CUSUM). J Arthroplasty 2014; 29(3): 586–9.
- Malchau H, Herberts P, Eisler T, Garellick G, Söderman P. The Swedish Total Hip Replacement Register. J Bone Joint Surg (Am) 2002: 84(Suppl 2).
- Matsen F A 3rd, Stephens L, Jette J L, Warme W J, Posner K L. Lessons regarding the safety of orthopaedic patient care: an analysis of four hundred and sixty-four closed malpractice claims. J Bone Joint Surg (Am) 2013; 95(4): e201–8.
- May M L, Stengel D B. Who sues their doctors? How patients handle medical grievances. Law Soc Rev 1990; 24: 105–20.
- Mikkonen M. Prevention of patient injuries: the Finnish patient insurance scheme. Med Law 2004; 23: 251–7.
- Namba R S, Inacio M C, Paxton E W. Risk factors associated with surgical site infection in 30,491 primary total hip replacements. J Bone Joint Surg (Br) 2012; 94(10): 1330–8.
- Norton E C, Garfinkel S A, McQuay L J, Heck D A, Wright J G, Dittus R, Lubitz RM. The effect of hospital volume on the in-hospital complication rate in knee replacement patients. Health Serv Res 1998; 33(5 Pt 1): 1191–210.
- Parvizi J, Holiday A D, Ereth M H, Lewallen DG. The Frank Stinchfield Award. Sudden death during primary hip arthroplasty. Clin Orthop Relat Res 1999; 369: 39–48.
- Parvizi J, Johnson B G, Rowland C, Ereth M H, Lewallen D G. Thirty-day mortality after elective total hip arthroplasty. J Bone Joint Surg (Am) 2001; 83-A: 1524–8.
- Parvizi J, Mui A, Purtill J J, Sharkey P F, Hozack W J, Rothman R H. Total joint arthroplasty: when do fatal or near-fatal complications occur? J Bone Joint Surg (Am) 2007; 89 (1): 27–32.
- Pukk K, Lundberg J, Penaloza-Pesantes R V, Brommels M, Gaffney F A. Do women simply complain more? National patient injury claims data show gender and age differences. Qual Manag Health Care 2003; 12: 225–31.
- Ravi B, Jenkinson R, Austin P C, Croxford R, Wasserstein D, Escott B, Paterson J M, Kreder H, Hawker G A. Relation between surgeon volume and risk of complications after total hip arthroplasty: propensity score matched cohort study. BMJ 2014; 348: g3284.
- Regenbogen S E, Greenberg C C, Studdert D M, Lipsitz S R, Zinner M J, Gawande A A. Patterns of technical error among surgical malpractice claims: an analysis of strategies to prevent injury to surgical patients. Ann Surg 2007; 246(5): 705–11.
- Sloan F A, Hsieh C R. Injury, liability, and the decision to file a medical malpractice claim. Law Soc Rev 1995; 29(3): 413–35.
- Statistics of Finnish Patient Insurance Center, 2014 [serial online]. Available from: http://www.pvk.fi/en/Statistics/.
- Statistics of National Institute for Health and Welfare (THL), Finland, 2013 [serial online]. Available from: http://www.julkari.fi/handle/10024/120409.
- Studdert D M, Thomas E J, Burstin H R, Zbar B I W, Orav E J, Brennan T A. Negligent care and malpractice claiming behavior in Utah and Colorado. Med Care 2000; 38(3): 250–60.
- Walmsley P J, Kelly M B, Hill R M, Brenkel I. A prospective, randomised, controlled trial of the use of drains in total hip arthroplasty. J Bone Joint Surg (Br) 2005; 87(10): 1397–401.
- Wolf B R, Lu X, Li Y, Callaghan J J, Cram P. Adverse outcomes in hip arthroplasty: long-term trends. J Bone Joint Surg (Am) 2012; 94(14): e103.
- Yasugana H, Tsuchiya K, Matsuyama Y, Ohe K. High-volume surgeons in regard to reductions in operating time, blood loss, and postoperative complications for total hip arthroplasty. J Orthop Sci 2009; 14: 3–9.