
Abstract
Background and purpose — When evaluating the outcome after total knee arthroplasty (TKA), increasing emphasis has been put on patient satisfaction and ability to perform activities of daily living. To address this, the forgotten joint score (FJS) for assessment of knee awareness has been developed. We investigated the validity and reliability of the FJS.
Patients and methods — A Danish version of the FJS questionnaire was created according to internationally accepted standards. 360 participants who underwent primary TKA were invited to participate in the study. Of these, 315 were included in a validity study and 150 in a reliability study. Correlation between the Oxford knee score (OKS) and the FJS was examined and test-retest evaluation was performed. A ceiling effect was defined as participants reaching a score within 15% of the maximum achievable score.
Results — The validity study revealed a strong correlation between the FJS and the OKS (intraclass correlation coefficient (ICC) = 0.81, 95% CI: 0.77–0.85; p < 0.001). The test-retest evaluation showed almost perfect reliability for the FJS total score (ICC = 0.91, 95% CI: 0.88–0.94) and substantial reliability or better for individual items of the FJS (ICC? 0.79). We found a high level of internal consistency (Cronbach’s? = 0.96). The ceiling effect for the FJS was 16%, as compared to 37% for the OKS.
Interpretation — The FJS showed good construct validity and test-retest reliability. It had a lower ceiling effect than the OKS. The FJS appears to be a promising tool for evaluation of small differences in knee performance in groups of patients with good clinical results after TKA.
When arthroplasty was first introduced as a treatment for osteoarthritis of the knee, the main aims when evaluating the success of the treatment were pain relief and achievement of an acceptable range of movement. Since the 1970s, as prosthetic designs have evolved, the results of total knee arthroplasty (TKA) have greatly improved in line with growing patient expectations. This development has led to greater emphasis on patient-perceived outcome, such as patient satisfaction and ability to perform activities of daily living (ADL), when evaluating the results of TKA in search of optimal treatment protocols.
Several scoring systems based on patient-reported outcome measures (PROMs) have been developed in order to evaluate outcome after TKA (Bellamy et al. Citation1988, Insall et al. Citation1989, Ware and Sherbourne Citation1992, Dawson et al. Citation1998, Rabin and de Charro Citation2001, Talbot et al. Citation2010, Collins and Roos Citation2012). A scoring system that has been widely used in TKA research is the Oxford knee score (OKS), which has been repeatedly validated (Dawson et al. Citation1998, Dunbar et al. Citation2000, Haverkamp et al. Citation2005, Naal et al. Citation2009, Takeuchi et al. Citation2011). In recent years, however, the OKS has been shown to have a considerable ceiling effect (Marx et al. Citation2005, Jenny and Diesinger Citation2012, Jenny et al. Citation2014), which makes it less suitable when investigating potentially small differences in performance of the knee in patients with good or excellent clinical results after TKA.
To address this issue, a new scoring system—the forgotten joint score (FJS)—was recently developed (Behrend et al. Citation2012). The FJS scoring system is based on a 12-item questionnaire concerning patients’ ability to forget their artificial joint in everyday life (i.e. lack of awareness of the knee), because this could be considered to be the ultimate goal after arthroplasty. Earlier studies have found good correlation between the FJS and other PROMs (WOMAC and KOOS) and they have shown that the FJS has promising ability to measure outcome (Behrend et al. Citation2012, Thienpont et al. Citation2014, Thompson et al. Citation2015). Correlation between the FJS and OKS has not been investigated previously.
We developed a Danish version of the FJS and investigated its validity and responsiveness, including correlation with the OKS and test-retest characteristics of the FJS. Investigation of correlation with the OKS was chosen on the basis of an earlier study by Dunbar et al. (Citation2001), who found that the OKS was the most appropriate disease-specific PROM to use when evaluating the outcome of TKA.
Patients and methods
In this retrospective cross-sectional survey-based study, we randomly selected 360 patients who had received a primary unilateral TKA at our institution (Copenhagen University Hospital, Hvidovre, Denmark) between January 2010 and January 2013. They had not undergone previous open knee surgery and did not have revision surgery after primary TKA. The patients who were invited to participate in the study were treated either with a cemented previous-generation fixed-bearing, cruciate retaining TKA (AGC; Biomet, Warsaw, IN), a cemented newer-generation fixed-bearing, cruciate retaining TKA (Vanguard CR; Biomet) or an uncemented, mobile-bearing, cruciate retaining TKA (Vanguard ROCC; Biomet). All 3 prosthetic designs have shown good clinical results (Emerson et al. Citation2000, Worland et al. Citation2002, Ritter Citation2009, Stormont and Chillag Citation2009, Bercovy et al. Citation2012, Thomsen et al. Citation2013, Atrey et al. Citation2014, Kievit et al. Citation2014, Schroer et al. Citation2014).
The study was conducted according to the COSMIN guidelines (Mokkink et al. Citation2010) and consisted of 2 parts, a validity study and a reliability study. In January 2014, all 360 patients were invited to participate in the study, giving a follow-up period of 1–4 years. All participants received a set of questionnaires consisting of a Danish version of the FJS and OKS questionnaires. If participants had not returned the questionnaires within 2 weeks, a new set of questionnaires was sent. After 4 weeks, 315 participants had completed the questionnaires sufficiently well. The 315 participants who completed the first survey were included in the validity study.
The first 200 participants who returned the first set of questionnaires were then invited to participate in the reliability study. These participants were asked to complete a second FJS questionnaire 4 weeks after the first set of questionnaires had been delivered to the patients. Patients were excluded from the reliability study if they reported a change in knee pain or function in the period between the first questionnaire and the second one. 150 participants completed the second questionnaire sufficiently well and were included in the reliability study ( and ).
Figure 1. Flow diagram presenting participants who were invited to participate in the study and included in the analysis.
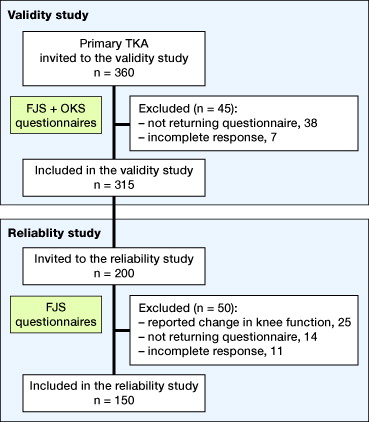
Table 2. Demographics of patients included in the validity and reliability studies. The numbers in parentheses are standard deviations (SDs) where the data were normally distributed, or percentages of the total
The FJS is a 12-item questionnaire concerning the participants’ awareness of their artificial joint during ADL. The questions included in the FJS questionnaire are presented in . For each question, the participant can choose between 6 response options: never, almost never, seldom, sometimes, mostly, or not relevant for me.
Table 1. Questions included in the FJS questionnaire
When calculating the total score for the FJS, all responses are summed (never, 0 points; almost never, 1 point; seldom, 2 points; sometimes, 3 points; mostly, 4 points) and then divided by the number of completed items (questions met with “not relevant for me” were treated as having a missing value and were not included in completed items). This mean value is subsequently multiplied by 25 to obtain a total score range of 0 to 100. Finally, the score is subtracted from 100 to change the direction of the final score in such a way that high scores indicate a high degree of “forgetting” the artificial joint—i.e. a low degree of awareness. If more than 4 responses are “not relevant for me” or missing, the total score should be discarded (Behrend et al. Citation2012).
The OKS is a previously validated PROM based on a 12-item questionnaire. It has been widely used to evaluate outcome after TKA. Participants can have a total score of 0 to 48, where 48 indicates the best possible outcome. In the case of missing responses, the mean value representing all of their other responses is used. If more than 2 responses are missing, the total score should be discarded (Dawson et al. Citation1998).
Translation
Translation of the FJS questionnaire to Danish was performed according to internationally adopted methods including forward translation, back translation, evaluation of translation quality, and confirmation (Guillemin et al. Citation1993, Ware et al. Citation1995, Ganestam et al. Citation2013). First, 3 independent Danish translations of the English version of the FJS questionnaire were done. The 3 translators then agreed on a consensus version of the translated questionnaire. An extra answer option stating: “not relevant for me” was added to each individual question in order to improve responsiveness of the questionnaire. A bilingual translator then translated the Danish consensus version back into English. Finally, the inventor of the questionnaire approved the backward translation to ensure that comprehension of the content was not lost in the translation process (Behrend et al. Citation2012). All the translations were performed by medical doctors.
Statistics
Construct validity of the FJS was assessed using Pearson’s correlation coefficient with the OKS as a reference. The OKS has previously been validated (Dawson et al. Citation1998).
The test-retest reliability was evaluated using the intraclass correlation coefficient (ICC) estimated from a one-way ANOVA model with a random effect parameter for subject. The ICC calculated was classified in terms of agreement according to the guidelines presented by Landis and Koch (Citation1977): < 0.2, poor; 0.2–0.4, fair; 0.4–0.6, moderate; 0.6–0.8, substantial; and > 0.8, almost perfect. The standard error of measurement (SEM) was calculated using the formula: SEM = SD ×? (1? ICC) where SD is standard deviation. The SEM was used to calculate the minimal detectable change (MDC) for the FJS using the formula: MDC = 1.96 ×? (2 × SEM) (de Vet et al. Citation2006).
Internal consistency of the FJS was evaluated using Cronbach’s?, which indirectly measures the extent to which each of the 12 items of the FJS questionnaire measure the same construct. A Cronbach’s? of > 0.9 was considered satisfactory.
A ceiling effect was defined as when patients reached a score within 15% of the maximum achievable score for the FJS (? 85 points) and the OKS (? 41 points).
Item response modeling
Exploratory factor analysis was used to evaluate the uni-dimensionality of the FJS score, thereby determining whether the items of the score related to a single latent factor or several. Item response models were used to describe the relationship between the items and the underlying latent factor that they were intended to measure. The items in the FJS score contain 5 possible answers. The graded response model was therefore chosen to describe the data. Both a model with equal discrimination parameters (constrained model) and a model with estimated discrimination parameters (unconstrained model) were fitted to the data, to determine whether the items should be weighted. Likelihood ratio test (LRT) was used to test the difference between the models. Item characteristic curves were plotted for each item to illustrate the probability of giving a specific answer given the trait level.
Any p-value of less than 0.05 was considered statistically significant. All analyses were performed using R version 3.0.2 (R foundation for Statistical Computing, Vienna, Austria).
Ethics
The study was approved by the Danish National Data Protection Agency (AHH-2014-010).
Results
315 of the 360 invited participants returned the first FJS questionnaire sufficiently well completed, giving a response rate of 88% ().
Construct validity
There was a strong correlation between the FJS and OKS scoring systems, with a correlation coefficient of 0.81 (95% CI: 0.77–0.85; p < 0.001).
Reliability
Reliability testing evaluated the ability of the questionnaire to distinguish patients from each other despite the measurement error. The test-retest evaluation showed almost perfect reliability for the FJS total score (ICC = 0.91) and substantial reliability or better for the individual FJS sub-scores (). The agreement of the questionnaire (the ability of the questionnaire to detect changes over time) was evaluated using the calculated SEM and MDC. The calculated SEM was 8.7. The calculated MDC was 24 (95% CI: 21–28).
Table 3. Intraclass correlation coefficients (ICCs) of total and individual sub-scores of the FJS
Internal consistency
We found a high level of internal consistency amongst the 12 individual FJS sub-scores (Cronbach’s? = 0.96).
Ceiling effect
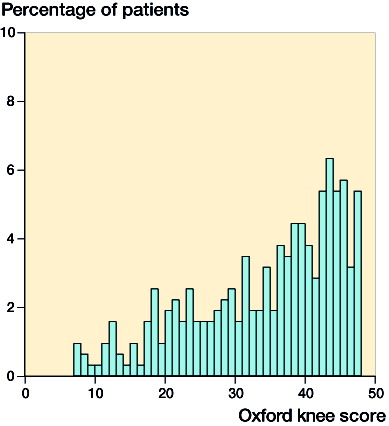
Distributions of the total FJS and OKS scores are presented in and . We found a ceiling effect of 16% for the FJS, as compared to 37% for the OKS.
Figure 2. Distribution of FJS scores.
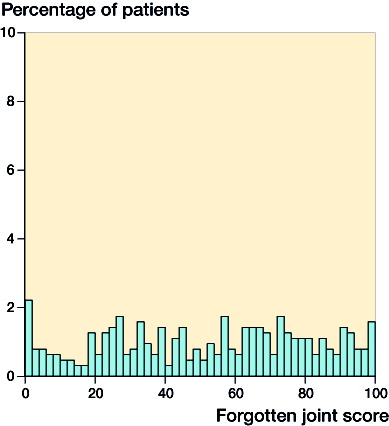
Figure 3. Distribution of OKS scores.
Item response modeling
Exploratory factor analysis supported the assumption of uni-dimensionality of the FJS score; factor loading values were all between 0.66 and 0.90, with item 4 having the weakest loading.
Testing between a constrained model and an unconstrained model showed a significant difference in the LRT (p = 0.005), indicating that an unconstrained model provided a better fit. Estimates from the unconstrained model showed that item 2 had a lower discrimination estimate (2.0) than the other items (2.4–3.7). Because of this, a second model not including item 2 was tested; this 11-item model showed no significant difference between the constrained model and the unconstrained model (p = 0.1).
The analysis that followed was done from the constrained 12-item FJS score model, since this related to the construct of the 12-item FJS score. Estimates of the constrained model can be found in . There was a difference between the threshold parameters across the different items, mostly items 4 and 8. Item 4 had the largest threshold estimates, making it positively skewed, and item 8 had the lowest threshold estimates, making it negatively skewed ().
Figure 4. Item characteristic curves for individual FJS items of the constraint graded response model.

Table 4. Estimates from the constrained graded response model
Discussion
For patients to “forget” their artificial knee, it has to be free of pain, has to offer an acceptable range of movement, and has to provide stability in all degrees of flexion during ADL. The FJS includes all these parameters in the evaluation of the outcome after TKA. This study was conducted to investigate the validity and reliability of the FJS.
The translation of the FJS questionnaire from English to Danish was performed according to internationally accepted methods. We therefore believe that the Danish version of the FJS questionnaire is an acceptable representative of the original questionnaire, and that it can be used in research concerning the outcome of TKA.
The OKS is a disease-specific PROM that has been widely used in TKA research. It has already been extensively validated (Dawson et al. Citation1998, Dunbar et al. Citation2000, Haverkamp et al. Citation2005, Naal et al. Citation2009, Takeuchi et al. Citation2011) and in an earlier study, Dunbar et al. (Citation2001) found the OKS to be the most appropriate disease-specific PROM to use when evaluating outcome after TKA. For this reason, we chose to use correlation to the OKS for validation of the FJS in this study.
We found that the FJS showed good construct validity, as it correlated strongly with the OKS (r = 0.81). Our findings are supported by the results of earlier studies where the FJS was compared to the WOMAC and the KOOS (Behrend et al. Citation2012, Thompson et al. Citation2015).
When evaluating the test-retest reliability of the FJS, we found an ICC of 0.91 for the total FJS score. According to the interpretation put forward by Landis and Koch (Citation1977), this equals almost perfect reliability. When looking at the individual sub-scores of the FJS, the lowest ICC was found for question 5 concerning awareness of the knee when traveling in a car. The ICC for question 5 was 0.79, which indicated a substantial degree of reliability. For all other sub-scores, we found almost perfect reliability (ICC > 0.8). This high degree of reliability for each question leads us to believe that all the questions in the FJS questionnaire are suitable and warranted when evaluating the outcome of TKA. Our findings concerning test-retest reliability of the FJS are similar to the findings of Thompson et al. (Citation2015), who validated an English version of the FJS and found an ICC of 0.97 for the total FJS score.
The calculated MDC of 24 points found in our study was relatively high, which can be explained by the wide distribution of the individual participant scores (). This could indicate that the FJS is less suitable for repeated assessments of individual patients during follow-up after TKA, as only differences above 24 points for individual patients can be expected to be detected.
The reported high level of reliability and internal consistency along with a lower degree of ceiling effect do, however, lead us to believe that the FJS system is reliable and useful when evaluating the outcome of groups of patients in TKA research.
The FJS presents an even distribution of scores throughout the total scoring scale compared to the distribution of the OKS scores, which clearly has a distribution that is shifted to the right ( and ). This was reflected in the assessment of the ceiling effect. We found a ceiling effect of 16% for the FJS and 37% for the OKS, which is comparable to the findings presented in earlier studies (Marx et al. Citation2005, Behrend et al. Citation2012, Jenny and Diesinger Citation2012, Giesinger et al. Citation2014, Jenny et al. Citation2014, Thompson et al. Citation2015). The wide distribution of FJS scores for patients with good clinical results after TKA could indicate that the FJS is more sensitive than the OKS when evaluating small differences in knee performance in these patients.
Item response analysis of the FJS score showed evidence of an unconstrained model structure, meaning that a weighted sum of the items of the FJS score would give a better representation of the underlying trait. However, there was no evidence of a better fit with an unconstrained model when item 2 was removed, suggesting that error from not using weights is mainly introduced from item 2. Item 4 showed positively skewed threshold parameters, indicating that the item has difficulty in identifying people with low awareness. Likewise, item 8 was found to be negatively skewed, indicating difficulty in identifying people with a high degree of awareness.
A limitation of this study was that we were not able to include preoperative FJS and OKS scores because of the retrospective design. We therefore cannot draw any conclusions regarding the ability of the FJS to measure changes in knee awareness over time (responsiveness). An earlier study by Giesinger et al. (Citation2014) found that the FJS performed well when changes in knee awareness after TKA were being evaluated. The ability of the FJS in evaluation of changes in knee awareness over time, however, requires further evaluation.
The follow-up period of only 1 year for some patients in this study was short, and one could argue that patients still in rehabilitation could have have influenced the results concerning test-retest reliability. Earlier studies, however, have revealed that knee function reaches a plateau beyond 1 year after TKA (Shoji et al. Citation1990, Kim et al. Citation2009). Also, patients who reported a change in knee pain or function were excluded. We therefore believe that the reliability of the FJS found in this study is valid.
In summary, the FJS demonstrated good construct validity, correlated with the OKS, and had good test-retest reliability at the group level. The FJS had a lower ceiling effect than the OKS. Suggestions for improvement of the FJS score would be rephrasing of items 4 and 8 and considering item weighting or exclusion of item 2. The FJS appears to be a promising tool for evaluation of small differences in knee performance in groups of patients with good or excellent clinical results after TKA.
MGT conceived the study, summarized data, and drafted the manuscript. RL summarized data. TK performed the statistical analyses. KWB contributed to the study design and helped to draft the manuscript. HH carried out surgical procedures and helped to draft the manuscript. AT conceived the study and helped to draft the manuscript.
This project was financed by Dept. of Orthopedic Surgery, Copenhagen University Hospital Hvidovre with financial support from Biomet, Warsaw, Indiana, USA. The investigators of this study have independently initiated the project. Biomet had no involvement in study design; in the collection, analysis and interpretation of data; in the writing of the report; or in the decision to submit the article for publication.
- Atrey A, Edmondson M C, East D, Miles K, Butler-Manuel A, Ellens N. A retrospective medium- to long-term results of 1500 AGC total knee replacements - An independent centre functional follow up and survivorship. J Orthop 2014; 11: 37–42.
- Behrend H, Giesinger K, Giesinger J M, Kuster M S. The “forgotten joint” as the ultimate goal in joint arthroplasty: validation of a new patient-reported outcome measure. J Arthroplasty 2012; 27(3): 430–6.e1.
- Bellamy N, Buchanan W W, Goldsmith C H, Campbell J, Stitt L W. Validation study of WOMAC: a health status instrument for measuring clinically important patient relevant outcomes to antirheumatic drug therapy in patients with osteoarthritis of the hip or knee. J Rheumatol 1988; 15(12): 1833–40.
- Bercovy M, Beldame J, Lefebvre B, Duron A. A prospective clinical and radiological study comparing hydroxyapatite-coated with cemented tibial components in total knee replacement. J Bone Joint Surg Br 2012; 94(4): 497–503.
- Collins N J, Roos E M. Patient-reported outcomes for total hip and knee arthroplasty: commonly used instruments and attributes of a “good” measure. Clin Geriatr Med 2012; 28(3): 367–94.
- Dawson J, Fitzpatrick R, Murray D, Carr A. Questionnaire on the perceptions of patients about total knee replacement. J Bone Joint Surg Br 1998; 80(1): 63–9.
- Dunbar M J, Robertsson O, Ryd L, Lidgren L. Translation and validation of the Oxford-12 item knee score for use in Sweden. Acta Orthop Scand 2000; 71(3): 268–74.
- Dunbar M J, Robertsson O, Ryd L, Lidgren L. Appropriate questionnaires for knee arthroplasty. Results of a survey of 3600 patients from The Swedish Knee Arthroplasty Registry. J Bone Joint Surg Br 2001; 83(3): 339–44.
- Emerson R H, Higgins L L, Head W C. The AGC total knee prosthesis at average 11 years. J Arthroplasty 2000; 15(4): 418–23.
- Ganestam A, Barfod K, Klit J, Troelsen A. Validity and reliability of the Achilles tendon total rupture score. J Foot Ankle Surg 2013; 52(6): 736–9.
- Giesinger K, Hamilton D F, Jost B, Holzner B, Giesinger J M. Comparative responsiveness of outcome measures for total knee arthroplasty. Osteoarthritis Cartilage 2014; 22(2): 184–9.
- Guillemin F, Bombardier C, Beaton D. Cross-cultural adaptation of health-related quality of life measures: literature review and proposed guidelines. J Clin Epidemiol 1993; 46(12): 1417–32.
- Haverkamp D, Breugem S J M, Sierevelt I N, Blankevoort L, van Dijk C N. Translation and validation of the Dutch version of the Oxford 12-item knee questionnaire for knee arthroplasty. Acta Orthop 2005; 76(3): 347–52.
- Insall J N, Dorr L D, Scott R D, Scott W N. Rationale of the Knee Society clinical rating system. Clin Orthop Relat Res 1989; (248): 13–4.
- Jenny J-Y, Diesinger Y. The Oxford Knee Score: compared performance before and after knee replacement. Orthop Traumatol Surg Res 2012; 98(4): 409–12.
- Jenny J-Y, Louis P, Diesinger Y. High activity arthroplasty score has a lower ceiling effect than standard scores after knee arthroplasty. J Arthroplasty 2014; 29(4): 719–21.
- Kievit A J, Schafroth M U, Blankevoort L, Sierevelt I N, van Dijk C N, van Geenen R C I. Early experience with the Vanguard complete total knee system: 2-7 years of follow-up and risk factors for revision. J Arthroplasty 2014; 29(2): 348–54.
- Kim Y-H, Choi Y, Kim J-S. Range of motion of standard and high-flexion posterior cruciate-retaining total knee prostheses a prospective randomized study. J Bone Joint Surg Am 2009; 91(8): 1874–81.
- Landis J R, Koch G G. The measurement of observer agreement for categorical data. Biometrics 1977; 33(1): 159–74.
- Marx R G, Jones E C, Atwan N C, Closkey R F, Salvati E A, Sculco T P. Measuring improvement following total hip and knee arthroplasty using patient-based measures of outcome. J Bone Joint Surg Am 2005; 87: 1999–2005.
- Mokkink L B, Terwee C B, Patrick D L, Alonso J, Stratford P W, Knol D L, et al. The COSMIN checklist for assessing the methodological quality of studies on measurement properties of health status measurement instruments: an international Delphi study. Qual Life Res 2010; 19(4): 539–49.
- Naal F D, Impellizzeri F M, Sieverding M, Loibl M, von Knoch F, Mannion A F, et al. The 12-item Oxford Knee Score: cross-cultural adaptation into German and assessment of its psychometric properties in patients with osteoarthritis of the knee. Osteoarthritis Cartilage 2009; 17(1): 49–52.
- Rabin R, de Charro F. EQ-5D: a measure of health status from the EuroQol Group. Ann Med 2001; 33: 337–43.
- Ritter M A. The Anatomical Graduated Component total knee replacement: a long-term evaluation with 20-year survival analysis. J Bone Joint Surg Br 2009; 91(6): 745–9.
- Schroer W C, Stormont D M, Pietrzak W S. Seven-year survivorship and functional outcomes of the high-flexion Vanguard complete knee system. J Arthroplasty 2014; 29(1): 61–5.
- Shoji H, Solomonow M, Yoshino S, D’Ambrosia R, Dabezies E. Factors affecting postoperative flexion in total knee arthroplasty. Orthopedics 1990; 13: 643–9.
- Stormont D, Chillag K. The relationship between pre-and postoperative range of motion utilizing three cruciate-retaining total knee prostheses. J Investig Surg 2009; 22(5): 368–74.
- Takeuchi R, Sawaguchi T, Nakamura N, Ishikawa H, Saito T, Goldhahn S. Cross-cultural adaptation and validation of the Oxford 12-item knee score in Japanese. Arch Orthop Trauma Surg 2011; 131(2): 247–54.
- Talbot S, Hooper G, Stokes A, Zordan R. Use of a new high-activity arthroplasty score to assess function of young patients with total hip or knee arthroplasty. J Arthroplasty 2010; 25: 268–73.
- Thienpont E, Opsomer G, Koninckx A, Houssiau F. Joint awareness in different types of knee arthroplasty evaluated with the Forgotten Joint score. J Arthroplasty 2014; 29(1): 48–51.
- Thompson S M, Salmon L J, Webb J M, Pinczewski L A, Roe J P. Construct validity and test re-test reliability of the Forgotten Joint Score. J Arthroplasty 2015; 30(11): 1902–5.
- Thomsen M G, Husted H, Otte K S, Holm G, Troelsen A. Do patients care about higher flexion in total knee arthroplasty? A randomized, controlled, double-blinded trial. BMC Musculoskelet Disord 2013; 14: 127.
- De Vet H C W, Terwee C B, Knol D L, Bouter L M. When to use agreement versus reliability measures. J Clin Epidemiol 2006; 59(10): 1033–9.
- Ware J E, Sherbourne C D. The MOS 36-item short-form health survey (SF-36). I. Conceptual framework and item selection. Med Care 1992; 30: 473–83.
- Ware J E, Keller S D, Gandek B, Brazier J E, Sullivan M. Evaluating translations of health status questionnaires. Methods from the IQOLA project. International Quality of Life Assessment. Int J Technol Assess Health Care 1995; 11(3): 525–51.
- Worland R L, Johnson G V-V, Alemparte J, Jessup D E, Keenan J, Norambuena N, et al. Ten to fourteen year survival and functional analysis of the AGC total knee replacement system. Knee 2002; 9(2): 133–7.