
Abstract
Background and purpose — There is a general call for phased introduction of new implants, and one step in the introduction is an early evaluation of micromotion. We compared the micromotion in the Triathlon and its predecessor, the Duracon total knee prosthesis, concentrating especially on continuous migration over 5 years of follow-up. Patients and methods — 60 patients were randomized to receive either a cemented Triathlon total knee prosthesis or a cemented Duracon total knee prosthesis. 3-D tibial component migration was measured by radiostereometric analysis (RSA) at 3 months and at 1, 2, and 5 years. Results — There was no statistically significant difference in maximum total point motion (MTPM) between the 2 groups (p = 0.1). The mean MTPM at 5 years for the Duracon was 1.10 (SD 1.21) mm and for the Triathlon it was 0.66 (SD 0.38) mm. The numbers of continuously migrating prostheses were similar in the groups at the fifth year of follow-up; 6 of 21 prostheses in the Duracon group and 3 of 21 in the Triathlon group had migrated more than 0.3 mm between the second year and the fifth year of follow-up (p = 0.2). Interpretation — The Triathlon has a micromotion pattern similar to that of the Duracon total knee system at both short-term and medium-term follow-up, and may therefore, over time, show the same good long-term mechanical stability.
The Duracon prosthesis has been in clinical use for about 20 years and has good medium- to long-term survivorship (SKAR Citation2013). In a previous paper, we presented a comparison of the 2-year tibial implant micromotion RSA results for the Triathlon prosthesis and the Duracon prosthesis. That study showed that there was no significant difference in continuous migration, translation, or rotation between the 2 designs (Molt et al. Citation2012). The Triathlon cemented knee prosthesis was developed (with modifications) from the Duracon cemented knee prosthesis. The Triathlon was launched in 2004 and included a single radius design, a slightly more constrained polyethylene insert and a delta tibial stem design.
In the last 2 decades, the orthopedic community has experienced failures in cement quality, in resurfacing techniques, and in orthopedic implants tender processes because available methods of safety checking were insufficient (Linder Citation1995, Thanner et al. Citation1995, Cohen Citation2011, Gothesen et al. Citation2013). Any modification of an arthroplasty component introduces a risk of altering the long-term stability of that component; and early detection of implants that are likely to have compromised long-term stability is essential to minimize the number of patients exposed to potentially “unsafe” components (Malchau Citation2000).
Using RSA, an increase in maximum total point motion (MTPM) of more than 0.2 mm between the first and second year has been shown to indicate that patients are at risk of loosening by 10 years (predictive power: 85%). An additional increase in micromotion of >0.1 mm per year strengthens the prediction (Ryd et el. 1995). Recent discussion of phased introduction of new implants suggests that the mean MTPM from the first year of follow-up should be used as an early detector of late mechanical loosening. Migration of up to 0.5 mm was considered acceptable, while migration of 1.6 mm or more was considered unacceptable (Pijls et al. Citation2012). TKAs with migration of between 0.5 mm and 1.6 mm were described as being at risk of having revision rates of more than 5% at 10 years (Pijls et al. Citation2012).
We compared micromotion of the tibial component in the Triathlon and Duracon cemented total knee prostheses at 5 years of follow-up, using RSA as primary outcome. We also report the differences that we found in predicting loosening from patterns of migration using 2 different methods—that recommended by Ryd et al. (Citation1995) and that recommended by Pijls et al. (Citation2012).
Patients and methods
Design
As described in a previous publication, patients from a single center were prospectively randomized to receive either a Triathlon CR or a Duracon CR cemented knee system (Stryker, Mahwah, NJ) (Molt et al. Citation2012)
Participants
Total knee replacement was performed in 118 patients using either the Triathlon or the Duracon. 60 of these were included in the study (39 women), with 30 patients randomized to each group (). The inclusion and exclusion criteria for selection to participate in the study are provided in Tables 1 and 2 (see Supplementary data).
Figure 1. Consort fl ow chart
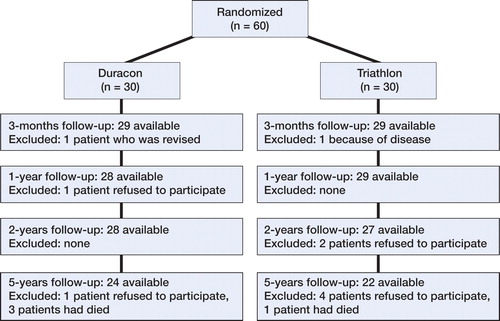
Randomization was achieved using sealed envelopes; the envelopes were drawn on the day before surgery, at the operative planning session for the next day. The 60 patients were kept unaware of the treatment allocated to them. Two surgeons (MM and STL) were involved both in the selection and in the operation of patients.
Prostheses and surgery
The main difference between the Duracon and Triathlon total knee prostheses is that the Triathlon femoral component has a single axis of rotation (single radius between 10 and 110 degrees) (Iwaki et al. Citation2000). This provides more uniform motion, lower contact stresses on the insert, better mid-flexion stability, and more efficient muscle activity (Wang et al. Citation2006, Kessler et al. Citation2007, Ostermeier and Stukenborg-Colsman Citation2011, Wolterbeek et al. Citation2012). The Triathlon prosthesis has improved flared femoral posterior condyles and rotary arc, which facilitate internal-external rotation during deep knee flexion. The Triathlon tibial tray has a delta-shaped stem and the Duracon tibial tray has a central, round stem with delta-shaped wings.
All the patients received a cemented chrome-cobalt femoral component. Both the Triathlon and the Duracon total knee systems had cemented chrome-cobalt tibial components; a cruciate retaining design; and a relatively unconstrained polyethylene insert. The cement used was Refobacin bone cement R (Biomet Inc., Warsaw, IN). The cement was applied to the cut surface of the tibia, with no cement around the stem. No patellar components were used in either group.
The surgical technique was described in our previous publication (Molt et al. Citation2012).
At the time of surgery, 8 tantalum markers (0.8 mm diameter; RSA Biomedical, Umeå, Sweden) were inserted into the proximal tibial metaphysis and 5 markers were inserted in the polyethylene tibial insert (Ryd Citation1986).
Evaluation
Evaluation of RSA was done according to Valstar et al. (Citation2005). The first RSA investigation was performed within 2 days of the operation, after weight bearing had been achieved, and thereafter at 3 months and 1, 2, and 5 years. RSA was performed with the patient in supine position, with the knee of interest inside a calibration cage (Cage 10; RSA Biomedical). The 3-D migration of the tibial component was measured using UmRSA software (version 6.0; RSA Biomedical).
The migration was described as segment motion (translation and rotation) of the geometric center of the prosthetic markers and as the MTPM. This enabled the micromotion between the tibial insert and the tibial bone to be described. Positive directions for translations along the orthogonal axes were: transverse (medial to lateral), longitudinal (caudal to cranial), and sagittal (posterior to anterior); positive directions for rotations about the coordinate axes were anterior tilt (transverse axis), internal rotation (longitudinal axis), and varus (sagittal axis).
An increase in MTPM of more than 0.2 mm between the first and second year of follow-up and of more than 0.3 mm between the second and fifth year was considered to be continuous migration. We used the definition of modified continuous migration (MCM) = 0.1 mm/year according to Ryd et al. (Citation1995).
To ensure that measurements were accurate, stable fixation of the tantalum markers within the bone and insert was essential. The upper limit for mean error (ME) of rigid body fitting was 0.2 mm, and the upper limit for condition number was 100. Tantalum markers were considered to be unstable if they moved more than 0.3 mm relative to the other tantalum markers between examinations. Unstable markers were excluded from the analysis.
The precision of this investigation has been reported as 2 SD values of 0.12 mm, 0.21 mm, and 0.14 mm for x-, y-, and z-translation, respectively, and 0.12°, 0.11°, and 0.09° for x-, y-, and z-rotation (Pijls et al. 2005, Molt et al. Citation2012).
Statistics
From previous studies, the migration of total knee prostheses during the first 2 years has been about 1.0 ± 0.5 mm (MTPM), and to detect a decrease of 50% to 0.5 ± 0.5 mm, considering an alpha level of 0.05 and a beta level of 0.20 (power ≈ 80%), this would require 17 cases in each group. With a beta level of 0.75, 15 patients in each group would be needed. Continuous migration between the first and second year of follow-up has been found in up to 50% of cases (Nilsson et al. 1996, Hansson et al. 2008). Supposing that an improvement would have to give a decrease in continuous migration by 10% in order to be clinically relevant, an alpha level of 0.05 and beta level of 0.20 (power =80%) would require 25 cases in each group. Due to the risk of patient dropout, we included 30 patients in each group.
The statistical analyses were performed using SPSS Statistics version 22. All variables were considered to be continuous and were measured on an interval scale, except migratory pattern, which was proportional. Correlation between methods used in prediction of loosening was displayed in Venn diagrams, and compared using chi-square test and Fisher’s exact test. Statistical significance was set at the 5% level.
Ethics and registration
Ethical approval was obtained from the local medical ethics committee (entry no. 445/2005). Patients were considered for enrollment according to the clinical findings, and they gave their written informed consent according to International Conference on Harmonisation Good Clinical Practice (ICH GCP) requirements. The trial was registered at ClinicalTrials.gov (identifier: NCT00436982).
Results
Demographics
The 2 groups were similar regarding patient demographics and severity of osteoarthritis ().
Table 3. Demographics
RSA and radiological analysis
The mean amount of migration and rotation of the tibial components (in mm and degrees, respectively) are presented for each of the time points in and .
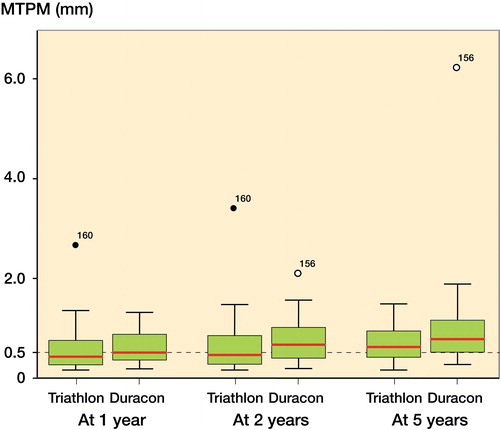
Figure 2. Box plots of median MTPM of the Triathlon group (left) and the Duracon group (right) at 1 year, 2 years, and 5 years. The horizontal hatched line denotes 0.5 mm. The central red line denotes the median value. The box denotes the second and third quartiles. The whiskers denote the range, excluding outliers. Dots denote outliers.
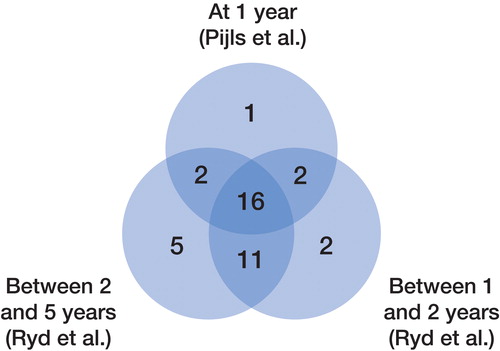
Table 4. The mean translation and rotation of the tibial component measured by RSA at 3 months, 1 year, and 2 years. Values are mean (SD)
There were no statistically significant differences in translation along the 3 coordinate axes between the Duracon group and the Triathlon group (all p-values >0.07), except for anterior translation at 2 years (p = 0.05).
There were no differences in rotation around the 3 coordinate axes at any time point between the Duracon group and the Triathlon group (all p-values >0.09), except for anterior tilt at 3 months (p = 0.04) and varus tilt at 3 months and also 1, 2, and 5 years (p = 0.004, 0.05, 0.01, and 0.03, respectively).
12 of 25 tibial trays in the Duracon group and 12 of 27 tibial trays in the Triathlon group had continuous migration at the 1-year follow-up.
7 of 24 tibial trays in the Duracon group and 5 of 26 tibial trays in the Triathlon group had continuous migration between the first-year and second-year follow-up, and 6 of 21 tibial trays in the Duracon group and 3 of 21 tibial trays in the Triathlon group showed continuous migration between the second-year and fifth-year follow-up (Ryd et al. Citation1995) ().
4 knees in the Duracon group continued to migrate, and 3 stabilized between the second and the fifth year; 2 knees changed in classification from stable to continuously migrating. 1 knee in the Triathlon group continued to migrate, and 4 stabilized between the second and the fifth year; 2 knees changed in classification from stable to continuously migrating. None of the knees in either group had been revised.
Comparison of individual predictions at the 3 time points, using the results of 42 patients (with complete data at all 3 follow-ups) from both groups, showed correlations between predictions made at 2 and 5 years (Fisher’s exact test, p = 0.6), but not between predictions made at 1 and 2 years (Fisher’s exact test, p = 0.04) and at 1 and 5 years (p = 0.005) ( and , and ).
Table 5. Numbers of patients classifi ed as having stable (St) or continuously migrating (CM) prostheses at 1, 2, and 5 years. 42 RSA assessments (n = 60) were complete at all 3 follow-ups. 16 baseplates were stable and 3 were continuously migrating at all 3 follow-ups. 18 were excluded because of missing data at any of the follow-ups or all of them
Figure 3. The numbers of patients who were classifi ed as stable at 1, 2, and 5 years were 21, 31, and 34, respectively, depending on the choice of method: MTPM <0.5 mm at 1 year according to Pijls et al., MTPM <0.2 mm between 1 and 2 years according to Ryd et al., or MTPM <0.3 mm between 2 and 5 years according to Ryd et al. 42 RSA assessments (n = 60) were complete at all 3 follow-ups. 16 baseplates were stable and 3 were continuously migrating at all 3 follow-ups. 18 were excluded because of missing data at any of the follow-ups or all of them. Fisher’s exact test: p-values <0.05 lead to rejection of the null hypothesis. There was no difference in prediction whether made at 2 years or 5 years.
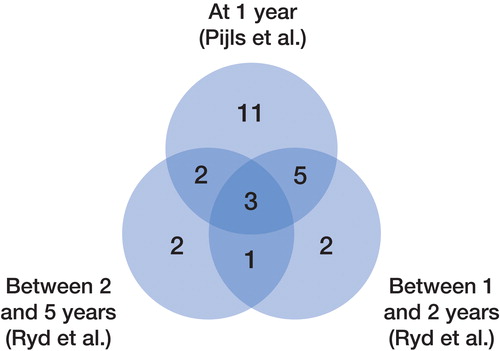
Figure 4. The numbers of patients classifi ed as having continuously migrating prostheses at 1, 2, and 5 years were 21, 11, and 8, respectively, depending on the choice of method: MTPM <0.5 mm at 1 year according to Pijls et al., MTPM <0.2 mm between 1 and 2 years according to Ryd et al., or MTPM <0.3 mm between 2 and 5 years according to Ryd et al. 42 RSA assessments (n = 60) were complete at all 3 follow-ups. 16 baseplates were stable and 3 were continuously migrating at all 3 follow-ups. 18 were excluded because of missing data at any of the follow-ups or all of them. Fisher’s exact test: p-values <0.05 lead to rejection of the null hypothesis. There was no difference in prediction whether made at 2 or 5 years.
Discussion
The purpose of this study was 2-fold. We wanted to compare the short- to medium-term fixation of the Duracon and the Triathlon tibial components and we wanted to assess the predictive power of migration as defined in 3 different ways.
The RSA data for the 2 prostheses showed no major differences between implants, and we therefore suggest that the Triathlon prosthesis will perform at least as well as the Duracon in the long term.
The 5-year revision rate for the Triathlon prosthesis ranged from 1.9% to 3.0%, which is comparable to that of the Duracon, with a 5-year revision rate of 3.3% (AOANJRR Citation2013, NJR Citation2013). The Swedish Knee Arthroplasty Registry, with patients operated from 2002 to 2011, reported that the Triathlon prosthesis had a risk ratio for revision at 6 years of 0.66 (95% CI: 0.49–0.89), and the risk ratio for revision of the Duracon prosthesis was 0.99 (95% CI: 0.83–1.17) at 10 years when compared to the AGC prosthesis (Biomet), which was referred to as the gold standard (with all types of revision included) (SKAR Citation2013). Considering registry-reported revision rates, wear and loosening can be predicted with RSA, but poor outcome of total joint replacements may depend on several factors other than aseptic loosening (rheumatoid arthritis, misalignment, age, infection, pain, instability, type of implant, type of fixation, modular implant designs, synovitis, and fracture) (Kärrholm Citation2012). If a “change of insert” was not considered as a component revision, the risk ratio was reduced to 0.47 (95% CI: 0.32–0.68) and 0.87 (95% CI: 0.73–1.04), respectively (SKAR Citation2013).
Recently, Pijls et al. (Citation2012) published a study based on 2 parallel meta-analyses, 1 on RSA studies (n = 847) and 1 on prosthesis survival. They found a correlation between first-year migration and revision rates, and concluded that a mean amount of migration of >0.5 mm at 1 year indicated a revision rate of >5% at 10 years, i.e. a slightly inferior result. Patients with a mean MTPM of between 0.5 and 1.6 mm were considered to be “at risk”, whereas migration of >1.6 mm was considered “unacceptable”.
While the method of Ryd evolved from assumptions made about prospective individual MTPM, the method of Pijls evolved in retrospect where large numbers of patients and studies were matched indirectly between their RSA review and their survival rate review, and then matched according to the type of prosthesis, fixation method, and articulating insert. The findings of Pijls et al. (Citation2012) somewhat contradict the results of Ryd et al. (Citation1995), who did not find any correlation between MTPM at 6 months and 1 year and future risk of loosening. Thus, “continuous” migration cannot be identified at that early stage. Pijls did not analyze 2-year data because these were too inconsistently reported, and “continuity” of migration could not be analyzed.
The more stringent individual analysis according to Ryd indicates excellent long-term data, especially for the Triathlon implant, and the proven track-record of the Duracon corroborates this prediction. According to Pijls, approximately 50% of the prostheses were classified as being “at risk” at 1 year. The corresponding data according to Ryd were approximately 25% at 2 years, and even less at 5 years. Conversely, Pijls overestimated cases at risk by 100% and 160% compared to the “true” Ryd data at 2 and 5 years, and the method of Pijls suggests that both prostheses have a risk of revision rate of >3% at 5 years and >5% at 10 years, whereas the method of Ryd indicates better results.
The benefit of prediction by RSA in long-term follow-up is not needed. In this context, the method of Pijls is appealing; 1 year is shorter than 2 years (or 5 years). However, as always, speed comes at a price; precision is lost.
In summary, the RSA results of our study indicate good long-term fixation in both groups, slightly better for the Triathlon group than for the Duracon group, but without the difference reaching statistical significance. Prediction of prosthetic performance by RSA can be done both according to Pijls et al. (Citation2012) and according to Ryd et al. (Citation1995). The first is quicker, and the latter is more precise.
Supplementary data
Tables 1 and 2 are available on the Acta Orthopaedica website (www.actaortop.org), identification number 8038.
STL designed the study and coordinated it. MM participated in designing the study and prepared the manuscript. STL and LR gave advice in preparation of the manuscript. All the authors read and approved the final manuscript.
No competing interests declared.
We thank Dr. Peter Ljung for his work with the 2-year follow-up article, and also our study coordinator Marie Davidsson for her excellent help in monitoring the patients and the files.
- Ahlbäck S. Osteoarthrosis of the knee. A radiographic investigation. Acta Radiol Diagn (Stockh) 1968; Suppl277: 277–2.
- AOANJRR. Australian Orthopaedic Association National Joint Replacement Registry. Annual Report Adelaide AOA 2013.
- Cohen D. Out of joint: the story of the ASR. Bmj 2011; 342: d2905.
- Gothesen O, Espehaug B, Havelin L, Petursson G, Lygre S, Ellison P, Hallan G, Furnes O. Survival rates and causes of revision in cemented primary total knee replacement: a report from the Norwegian Arthroplasty Register 1994-2009. Bone Joint J 2013; 95-b(5): 636–42.
- Iwaki H. Pinskerova V, Freeman M A. Tibiofemoral movement 1: the shapes and relative movements of the femur and tibia in the unloaded cadaver knee. J Bone Joint Surg Br 2000; 82(8): 1189–95.
- Kessler O, Durselen L, Banks S, Mannel H, Marin F. Sagittal curvature of total knee replacements predicts in vivo kinematics. Clin Biomech 2007; 22(1): 52–8.
- Kärrholm J. Radiostereometric analysis of early implant migration - a valuable tool to ensure proper introduction of new implants. Acta Orthop 2012; 83(6): 551–2.
- Linder L. Boneloc–The Christiansen experience revisited. Acta Orthop Scand 1995; 66(3): 205–6.
- Malchau H.Introducing new technology: a stepwise algorithm. Spine Phila Pa 2000; 1976 25(3): 285.
- Molt M, Ljung P, Toksvig-Larsen S. Does a new knee design perform as well as the design it replaces? Bone Joint Res 2012; 1(12): 315–23.
- NJR. National Joint Registry for England and Wales, 10th Annual Report, 2013.
- Ostermeier S, Stukenborg-Colsman C. Quadriceps force after TKA with femoral single radius. Acta Orthop 2011; 82(3): 339–43.
- Pijls B G, Valstar E R, Nouta K A, Plevier J W, Fiocco M, Middeldorp S, Nelissen R G. Early migration of tibial components is associated with late revision. Acta Orthop 2012; 83(6): 614–624.
- Ryd L. Micromotion in knee arthroplasty. A roentgen stereophotogrammetric analysis of tibial component fixation. Acta Orthop Scand 1986; Suppl220: 1–80.
- Ryd L, Albrektsson B E, Carlsson L, Dansgard F, Herberts P, Lindstrand A, Regner L, Toksvig-Larsen S. Roentgen stereophotogrammetric analysis as a predictor of mechanical loosening of knee prostheses. J Bone Joint Surg Br 1995; 77(3): 377–83.
- SKAR. The Swedish Knee Arthroplasty Register. Annual Report. Lund: Dept. of Orthopedics, Skåne University Hospital, 2013.
- Thanner J, Freij-Larsson C, Kärrholm J, Malchau H, Wesslen B. Evaluation of Boneloc. Chemical and mechanical properties, and a randomized clinical study of 30 total hip arthroplasties. Acta Orthop Scand 1995; 66(3): 207–14.
- Valstar E R, Gill R, Ryd L, Flivik G, Borlin N, Kärrholm J. Guidelines for standardization of radiostereometry (RSA) of implants. Acta Orthop 2005; 76(4): 563–72.
- Wang H, Simpson K J, Ferrara M S, Chamnongkich S, Kinsey T, Mahoney O M. Biomechanical differences exhibited during sit-to-stand between total knee arthroplasty designs of varying radii. J Arthroplasty 2006; 21(8): 1193–9.
- Wolterbeek N, Garling E H, Mertens B J, Nelissen R G, Valstar E R. Kinematics and early migration in single-radius mobile- and fixed-bearing total knee prostheses. Clin Biomech 2012; 27(4): 398–402.