Abstract
In order to identify unreliable data in a dataset of motility parameters obtained from a pilot study acquired by a veterinarian with experience in boar semen handling, but without experience in the operation of a computer assisted sperm analysis (CASA) system, a multivariate graphical and statistical analysis was performed. Sixteen boar semen samples were aliquoted then incubated with varying concentrations of progesterone from 0 to 3.33 µg/ml and analyzed in a CASA system. After standardization of the data, Chernoff faces were pictured for each measurement, and a principal component analysis (PCA) was used to reduce the dimensionality and pre-process the data before hierarchical clustering. The first twelve individual measurements showed abnormal features when Chernoff faces were drawn. PCA revealed that principal components 1 and 2 explained 63.08% of the variance in the dataset. Values of principal components for each individual measurement of semen samples were mapped to identify differences among treatment or among boars. Twelve individual measurements presented low values of principal component 1. Confidence ellipses on the map of principal components showed no statistically significant effects for treatment or boar. Hierarchical clustering realized on two first principal components produced three clusters. Cluster 1 contained evaluations of the two first samples in each treatment, each one of a different boar. With the exception of one individual measurement, all other measurements in cluster 1 were the same as observed in abnormal Chernoff faces. Unreliable data in cluster 1 are probably related to the operator inexperience with a CASA system. These findings could be used to objectively evaluate the skill level of an operator of a CASA system. This may be particularly useful in the quality control of semen analysis using CASA systems.
Introduction
It is common to work with large datasets derived from cell and molecular analyses such as flow cytometry or genomic analysis, therefore validity of the data is crucial. In the context of this work we consider validity as quality of data due to the skill of researcher/technician/student, not to experimental strategies or experimental settings. This problem is especially relevant when students or poorly trained technicians obtain data, so objective assessment of the level of training is an important component when considering the reliability of the data analysis.
In any dataset, values deviating from a fixed standard deviation could be considered as outliers [Hayes et al. 2007]. Several statistical techniques could help to identify outliers in univariated and multivariate datasets, and all have strengths and weaknesses [Coucke et al. 2012]. For an experienced researcher it is easy to identify abnormal values in small datasets with few independent variables. But, can one objectively identify unreliable data (‘suspected data’), not simply outliers, in large datasets with many independent variables?
Motility is mostly assessed visually with a light microscope [Vyt et al. 2004]. Visual estimation of motility is inexpensive and not time consuming but the accuracy of the outcome depends on the subjective estimation by individuals [Woelders 1991]. CASA systems objectively evaluate sperm motility, and provide many motility parameters, creating large datasets, when ejaculates are examined. These datasets could contain many different parameters of either a continuous or categorical nature. Use of CASA in clinical research is desirable over manual motility evaluation, and criteria for use have been established [ESHRE 1998]. Furthermore, motility parameters obtained by CASA have been related to fertility [Holt et al. 1997]. Among the advantages of CASA systems are the objectivity of measurements, time savings, and detail in description of individual sperm motility patterns. A variety of strategies using multivariate statistics, such as PCA and cluster analysis, have been used to identify datasets obtained from CASA systems [Agarwal et al. 2003; Martinez-Pastor et al. 2005; Núñez-Martínez et al. 2006].
Representation of multivariate data in the form of Chernoff faces has been used to detect outliers [Johnson 1998] and to describe data obtained from CASA systems [Martínez-Pastor et al. 2008; Martínez-Pastor et al. 2011]. In addition, multivariate statistics can be used to reduce the dimensionality of a dataset and to cluster observations based on similarities. The goal of this work was to objectively identify unreliable data in a dataset obtained by an inexperienced user of a CASA system using multivariate graphs and statistics.
Results
Chernoff faces were constructed with parameters obtained from the CASA system for each semen evaluation in each treatment type, subsequently named as individuals (96 individuals in total). The chart was arranged by boar and treatment (). It is clear from the form and dimensions that faces in the first two columns (boars a and b) had lower values than the rest of the faces in the chart. Abnormal faces in the first two columns appear to be independent of the boar, as faces from the same boars look different in posterior evaluations (see other columns with the same name). Values associated with form and dimensions of faces were also independent of treatment.
Figure 1. Chernoff faces for individual evaluations of semen samples. Treatments are indicated on the right of each row. Letters on columns indicate boar and numbers below faces indicate number of evaluation (individual). DMSO: dimethyl sulfoxide; progesterone: (P4). Facial characteristic parameters: MTO: width of center; MPR: progressive motility; VAP: height of face; VSL: width of top half of face; VCL: width of bottom half of face; ALH: length of nose; BCF: height of mouth; STR: curvature of mouth; LIN: width of mouth; ELONG: height of eyes; AREA: distance between eyes.
Principal component analysis was applied to the motility parameters of each semen sample and eleven new variables (principal components) were obtained. Principal components 1 and 2 (Dim in axes of –4) explained 63.08% of total variance of the dataset (44.64 and 18.44%, respectively, ). Variance explained by principal components 3 to 11 was 11.041, 8.530, 6.608, 4.259, 2.140, 2.080, 1.267, 0.936, and 0.060, respectively. A map of individuals (semen samples) with respect to principal factors 1 and 2 is depicted in A. In B, parameters obtained from the CASA system are represented as vectors. The direction of the vector is determined by the component loadings (eigenvectors in ). When vectors are long, the cosines of the angles between the vectors approximate the correlations between the quantified variables. The component loadings indicate correlations between the principal components and the quantified variables. A high correlation between linearity (LIN) and mean amplitude of the lateral head displacement (ALH) was observed; whereas on the whole, variables form three groups according to proximity among them (B, group 1: straightness (STR) and beat cross frequency (BCF); group 2: total motility (MTO), progressive motility (MPR), area of the spermatozoa (AREA), and straight line velocity (VSL); and group 3: head width/head length (ELONG), velocity average path (VAP), curvilinear velocity (VCL), and mean amplitude of the lateral head displacement (ALH).
Figure 2. Individuals and variables according to principal component analysis (PCA). Each point in A was tagged to identify individuals. Variables in B are illustrated as vectors; direction of vectors is determined by component loadings. Dim 1, principal component 1; Dim 2, principal component 2; STR: curvature of mouth; BCF: height of mouth; MTO: width of center; MPR: top vs. bottom width (height of split); AREA: distance between eyes; VSL: width of top half of face; ELONG: height of eyes; VAP: height of face; VCL: width of bottom half of face; ALH: length of nose; LIN: width of mouth; Dim: principal component.
Table 1. Detail of principal component analysis (PCA) realized on motility descriptors computer assisted sperm analysis (CASA)-derived.
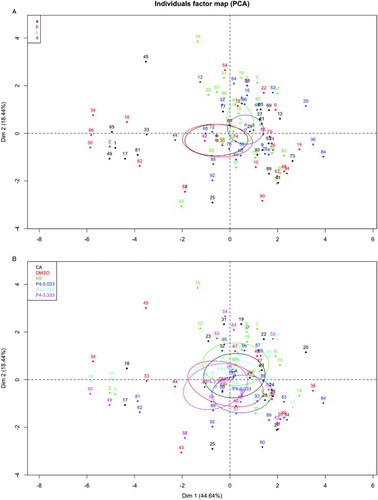
Individual boars in the principal components maps were identified for treatment (A and 3B, respectively). A group of individuals with low values of principal component 1 was isolated revealing the relationship with boar a and b and to all of treatments (black and red points in A). Overlapping confidence ellipses of principal factors was observed for all boars and treatments (A and 3B, respectively), indicating that no differences among animals nor between treatments was observed.
Figure 3. Identification of individuals by boar or treatment on map of principal factors. Ninety-five percent confidence ellipses were drawn for each boar (A) or treatment (B). Centroid for each boar or treatment is signaled with a hollow square and the identification for each boar or treatment is signaled by a different color. Dim 1, principal component 1; Dim 2, principal component 2; CA: with no refrigeration; DMSO: dimethyl sulfoxide; MF: with refrigeration; P4: progesterone.
Ward's criterion, which is based in the Huygens theorem [Ward 1963] was used to construct the hierarchical tree. The selection criterion for paired clusters to merge at each step is based on the optimal value of an objective function. The objective function may be any functional relation that an investigator selects to reflect the relative desirability of grouping [Ward 1963]. This allows us to decompose the total inertia (total variance) in between- and within-group variance [Husson et al. 2010]. After hierarchical clustering on principal components 1 and 2, individuals were grouped in three clusters (A). The number of clusters was selected on the basis of the form of dendrogram and gain within inertia. All of the variables from the original data set were used for the construction of dendrogram. The significant results of hierarchical clustering analysis are presented in . It is clear that cluster 1 is characterized by a lower mean of descriptive variables in contrast to overall mean (). Clusters were depicted on the map of principal components (B). Cluster 1 included evaluations with low values of principal component 1. With the exception of individual 44 (boar d, treatment progesterone 0.033 µg/ml) all evaluations in cluster 1 are from boars a and b and include all treatments. Excluding individual 44, cluster 1 was composed by individuals 1, 2, 17, 18, 33, 34, 49, 50, 65, 66, 81, and 82, i.e., all of Chernoff faces in the first two columns in , which in turn, correspond to the first two evaluations realized by the evaluator in semen samples of boars a and b. C shows a 3-dimensional representation of the hierarchical tree on the map produced by the first two principal components. In that graph, the principal components map, the hierarchical tree, and the partition issue from this tree bring different information that is superimposed to better visualize the data set.
Figure 4. Hierarchical clustering on principal component analysis (PCA). Embedded bar plot in A indicates within inertia gain. Inertia refers to variance, and total inertia (total variance) is decomposed in between and within-group variance. The within inertia gain characterizes the homogeneous of a cluster. Number of clusters was chosen on basis of dendrogram form and gain within inertia. B) clusters were mapped with colors on PCA map and centroid of each cluster is signaled with a hollow square. C) the dendrogram (A) was overlapped on PCA map. Dim 1, principal component 1; Dim 2, principal component 2. Dim: principal component.
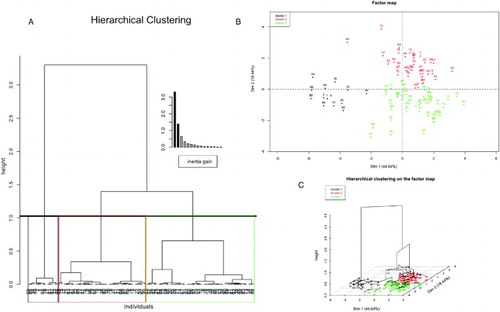
Table 2. Statistical description of hierarchical clustering on principal components 1 and 2*.
Discussion
In this work Chernoff faces, PCA, and hierarchical clustering analysis, were combined in an attempt to objectively identify unreliable data in a dataset obtained by an inexperienced user of a CASA system. Representation of the sperm motility parameters as Chernoff faces served to provide a visualization of the dataset and to identify abnormal values. Subsequent to graphical analysis, PCA was performed to reduce the dimensionality of the data to two principal components. Finally, data were grouped by hierarchical clustering. The previous procedure permitted an objective identification of a group of unreliable data within the dataset. The use of CASA-derived averaged data has been shown to have risks when characterization of sperm subpopulations is realized [ESHRE 1998; Katkov and Lulat 2000]. However, this risk was not relevant to this study because categorizing sperm subpopulations was not the goal of this study.
Presentation of points in a k-dimensional space as a face makes it easy for the human mind to grasp many of the essential regularities and irregularities present in the data [Chernoff 1973]. Results of the ranking of Chernoff faces, rows indicating treatment, and columns indicating boar, revealed that the first two columns contain data that was highly distinct from the rest.
Motility parameters, obtained from a CASA system, can be represented using Chernoff faces [Martínez-Pastor et al. 2008]. However, to our knowledge, this is the first time that Chernoff faces were used to represent individual measurements obtained from a CASA system.
In accordance with confidence ellipses, no differences were observed among boars or among treatments. These results were anticipated due to experimental settings, i.e., no effects were expected after a low time of incubation of sperm with progesterone, as previously observed [Libersky and Boatman 1995; Wu et al. 2006]. However, a group of individuals shared low values of principal component 1 indicating that such individuals share common characteristics. On the basis of Chernoff face representation and individual measurements with low values of principal component 1, it is clear that the common characteristic pertains to the first two specimens which were obtained from boars a and b.
Hierarchical clustering identified groups of similar individuals. With the exception of individual 44 (boar d), the rest of the individuals in cluster 1 corresponded to boars a and b. A first biological explanation to the conformation of that cluster is related to possible differences in parameters derived from the CASA system from distinct boars. However, this explanation was discarded because differences were not found globally among boars. Two criteria, derived from hierarchical clustering, permit the exclusion of individual 44 from cluster 1: first, individual 44 is far from centroid of cluster 1, and second, it corresponds to boar d (individuals a and b characterize cluster 1). The twelve individuals that composed cluster 1 are the same that presented abnormal features when Chernoff faces were drawn. Certainly, the Chernoff face of individual 44 was similar to individuals in cluster 1; however, as this represents the third evaluation from the boar d, this result was possibly due to random error.
Individuals that constituted cluster 1, as well as the previous knowledge that these individuals correspond to the first twelve evaluations performed by the operator of the CASA system, indicates that a factor in cluster 1 conformation could be the inexperience of the operator in management of a CASA system. Possibly the number of variables, such as different concentrations of progesterone, fresh versus chilled semen, boars, and inexperience in the use of a CASA system by the operator, influenced the results. However, the operator of the CASA system has extensive experience in semen processing under different circumstances. Given that no effects on motility were observed due to experimental settings suggests that the lack of experience in managing a CASA system is the major factor that influences these results. It is known that after training in semen evaluations, technicians reduce the variability of semen measurements, such as morphology, viability, and motility [Franken and Oehninger 2012].
In summary, the use of multivariate graphics and statistics permitted an objective identification of unreliable values in a dataset obtained from a CASA system. The statistical procedures described in this work could serve to identify unreliable data in large datasets. These findings could be valuable to objectively evaluate the skill level of a person in using a CASA system or other equipment, and also could serve to improve the quality control of semen analysis using a CASA system.
Materials and Methods
In this work we used a dataset obtained from a pilot study intended to analyze the effects of progesterone on boar sperm motility, after a brief cooling of diluted semen. Multivariate graphics and statistics were used to identify unreliable data in these datasets. Sixteen commercial seminal doses (four per boar) from four fertile boars were obtained from Supergen (Quecholac, Puebla, México).
Procedures to obtain and to prepare seminal doses were as follows: Boars were identified as a, b, c, and d, and four ejaculates were obtained from each boar at two-day intervals. Ejaculates were diluted in a commercial extender (Gold Life, Schippers, Europe BV, AH, The Netherlands) to a final concentration of 350 x 106 sperm/ml, and equilibrated as they warmed to approximately 37°C during one h. From each specimen six aliquots of 296 µl were taken. One aliquot from each specimen was evaluated in a CASA system before chemical treatment and refrigeration. Progesterone (P4) (Sigma, St. Louis, MO, USA), diluted in dimethyl sulfoxide (DMSO) to a concentration of 0.03, 0.33, or 3.33 µg/ml, was added to three aliquots. Aliquots supplemented with or without an equivalent volume of DMSO were used as controls. After chemical treatments, all aliquots were covered with cotton and maintained in a refrigerator at 17°C for 30 mi; then, aliquots were warmed to 37°C for three min in bath water and evaluated in a CASA system.
Chemical supplementation of semen aliquots and CASA system operation was realized by a veterinarian experienced in the handling of semen. The veterinarian had theoretical knowledge of a CASA system but he did not have practical experience in the operation of a CASA system.
The CASA system used was an UltiMate Sperm Analyzer™ (Hamilton Thorne Biosciences, Beverly, MA, USA) with Boar 12.3B1 software (Piramid Technical Consultants, Inc., Lexington, MA, USA). The plate was warmed to 37°C, and a negative phase contrast, 10X objective, and magnification 1.89 was used. The software settings were those recommended by the manufacturer for analysis of boar sperm and reported by Vyt et al. [2004], namely frames per second (Hz) 60, number of frames 45, minimum cell contrast 18, minimum cell size (pix) 7, cell size (pix) 9, cell intensity 125, slow-static cell with average path velocity (VAP) cut-off (µm/s) 20 and straight line velocity (VSL) cut-off (µm/s) 5, minimum static intensity gates 0.5, maximum static intensity gates 2.5, minimum static size gates 0.65, maximum static size gates 2.6, minimum elongation gates and maximum elongation gates 85. Sperm with a VAP <10 µm/s were considered immobile, while sperm with a velocity >15 µm/s were considered motile. Sperm with velocities between 16 and 35 µm/s were defined as medium speed sperm; those with a velocity >35 µm/s were considered rapidly moving sperm. Spermatozoa deviating <10% from a straight line were designated as linear motile.
Four microliters of chemically treated aliquots were put in Leja4® slides (Leja, Luzernestraat, Netherlands) of 20 µm depth, prewarmed to 37°C. Motility was evaluated in a CASA system. At least 200 sperm were evaluated per sample (∼3-4 fields), and means for each of the following motility parameters were recorded: total motility (%), progressive motility (%), velocity average path (VAP, µm/s), curvilinear velocity (VCL, µm/s), straight line velocity (VSL, µm/s), beat cross frequency (BCF, Hz), linearity (LIN, VSL/VCLx100, %), straightness coefficient (STR, VSL/VAPx100, %), elongation (ELONG, head width/head length), area (AREA, area of the sperm head, µm2), and mean amplitude of the lateral head displacement (ALH, µm). All samples were analyzed at least twice, with the mean of the two readings recorded in the database.
Statistics
Data were standardized (z standardization) before application of multivariate statistics. For an initial exploration of the dataset, standardized data of sperm motility parameters from each semen sample were used to construct multivariate graphical descriptions named Chernoff faces [Chernoff 1973]. Chernoff faces were made with R plugin TeachingDemos version 1.2.3 [Snow 2010]. PCA was performed on all variables (motility parameters) and treated semen samples in the database; then confidence ellipses for treatment or boar were drawn on a principal factors map to identify differences among treatments. Hierarchical clustering was performed on principal components. PCA and hierarchical clustering were realized with R plugin FactoMineR version 1.16 [Husson et al. 2011] on R version 2.13.1 [Team 2011] running on a MacBook with MacOsX version 10.6.8.
Declaration of interest: The authors report no declarations of interest.
Author contributions: Processed semen samples and managed the CASA system: LBM; Designed the work, realized statistical analysis, and wrote the manuscript: AAM; Designed the work and wrote the manuscript: MMM, RHC; Realized statistical analysis and wrote the manuscript: OHG.
Abbreviations
| CASA: | = | computer assisted sperm analysis |
| PCA: | = | principal component analysis |
| DMSO: | = | dimethyl sulfoxide |
| P4: | = | progesterone |
| MTO: | = | total motility |
| MPR: | = | progressive motility |
| VAP: | = | velocity average path |
| VSL: | = | straight line velocity |
| VCL: | = | curvilinear velocity |
| BCF: | = | beat cross frequency |
| ALH: | = | mean amplitude of the lateral head displacement |
| AREA: | = | area of the spermatozoa |
| ELONG: | = | head width/head length |
| LIN: | = | linearity |
| STR: | = | straightness |
| Dim: | = | principal component |
References
- Agarwal, A., Sharma, R.K. and Nelson, D.R. (2003) New semen quality scores developed by principal component analysis of semen characteristics. J Androl 24:343–352.
- Chernoff, H. (1973) The use of faces to represent points in k-dimensional space graphically. J Am Stat Assoc 68:361–368.
- Coucke, W., China, B., Delattre, I., Lenga, Y., Van Blerk, M., Van Campenhout, C., (2012) Comparison of different approaches to evaluate external quality assessment data. Clin Chim Acta 413:582–586.
- ESHRE (1998) Guidelines on the application of CASA technology in the analysis of spermatozoa. ESHRE Andrology Special Interest Group. European Society for Human Reproduction and Embryology. Hum Reprod 13:142–145.
- Franken, D.R. and Oehninger, S. (2012) Semen analysis and sperm function testing. Asian J Andrology 14:6–13.
- Hayes, K., Kinsella, A. and Coffey, N. (2007) A note on the use of outlier criteria in Ontario laboratory quality control schemes. Clin Biochem 40:147–152.
- Holt, C., Holt, W.V., Moore, H.D., Reed, H.C. and Curnock, R.M. (1997) Objectively measured boar sperm motility parameters correlate with the outcomes of on-farm inseminations: results of two fertility trials. J Androl 18:312–323.
- Husson, F., Josse, J. and Pagès, J. (2010) Principal components methods-hierarchical clustering-partitional clustering: why would we need to choose for visualizing data. Technical Report-Agrocampus. http://www.jstatsoft.org/. Accessed March 22 of 2012.
- Husson, F., Josse, J., Le, S. and Mazet, J. (2011) FactoMineR: Multivariate Exploratory Data Analysis and Data Mining with R. R package version 1.16. http://CRAN.R-project.org/package=TeachingDemos. Accessed April 30 of 2012.
- Johnson, D. (1998) Applied multivariate methods for data analysis. Duxbury Press, Pacific Grove, CA, USA.
- Katkov, I.I. and Lulat, A.G. (2000) Do conventional CASA-parameters reflect recovery of kinematics after freezing? CASA paradox in the analysis of recovery of spermatozoa after cryopreservation. Cryoletters 21:141–148.
- Libersky, A. and Boatman, E. (1995) Effects of progesterone on in vitro sperm capacitation and egg penetration in the Golden hamster. Biol Reprod 53:483–487.
- Martinez-Pastor, F., Garcia-Macias, V., Alvarez, M., Herraez, P., Anel, L. and de Paz, P. (2005) Sperm subpopulations in Iberian red deer epididymal sperm and their changes through the cryopreservation process. Biol Reprod 72:316–327.
- Martínez-Pastor, F., Cabrita, E., Soares, F., Anel, L. and Dinis, M.T. (2008) Multivariate cluster analysis to study motility activation of Solea senegalensis spermatozoa: a model for marine teleosts. Reproduction 135:449–459.
- Martínez-Pastor, F., Tizado, E.J. Garde, J.J. Anel, L. and de Paz, P. (2011) Statistical Series: Opportunities and challenges of sperm motility subpopulation analysis. Theriogenology 75:783–795.
- Núñez-Martínez, I., Moran, J.M. and Peña, F.J. (2006) A three-step statistical procedure to identify sperm kinematic subpopulations in canine ejaculates: changes after cryopreservation. Reprod Domest Anim 41:408–415.
- Snow, G. (2010) TeachingDemos: Demonstrations for teaching and learning. R package version 2.7. http://CRAN.R-project.org/package=TeachingDemos. Accessed April of 2011.
- Team, R.D.C. (2011) R: A Language and Environment for Statistical Computing Vienna, Austria. http://www.R-project.org/. Accessed April of 2011.
- Vyt, P., Maes, D., Rijsselaere, T., Dejonckheere, E., Castryck, F. and Soom, V.A. (2004) Motility assessment of porcine spermatozoa: A comparison of methods. Reprod Domest Anim 39:447–453.
- Ward, J. (1963) Hierarchical grouping to optimize an objective function. J Am Stat Assoc 58:236–244.
- Woelders, H. (1991) Overview of in vitro methods for evaluation of semen quality. 11th Int Conf Boar Semen Pres 1:145–165.
- Wu, J., Chiang, K. and Cheng, F. (2006) Expression of progesterone receptor(s) during capacitation and incidence of acrosome reaction induced by progesterone and zona proteins in boar spermatozoa. Anim Reprod Sci 93:34–45.