
Abstract
We observed the effects of changes in progesterone (P) during late follicular phases on the treatment outcome of in vitro fertilization-embryo transfer (IVF-ET) and intracytoplasmic sperm injection (ICSI) in patients with different ovarian responses. The data of 8,575 cycles of patients receiving gonadotropin-releasing hormone (GnRH) agonist using the long protocol were retrospectively analyzed. According to the number of oocytes retrieved, the cycles were divided into poor ovarian response group (oocyte retrieval <5), intermediate ovarian response group (5≤ oocyte retrieval ≤15), and high ovarian response group (oocyte retrieval ≥16). We found that in the poor ovarian response group, the clinical pregnancy rate was not significantly associated with both the level of P or the day of human chorionic gonadotrophin (hCG) and the duration of pre-hCG P elevation (p = 0.66 and p = 0.1874). In intermediate and high ovarian response groups, the clinical pregnancy rate was inversely related to both the level of P on the day of hCG administration and the duration of pre-hCG P elevation (all p < 0.0001). The cut-off values of serum P level on the day of hCG administration were 1 ng/ml and 1.75 ng/ml in intermediate and high ovarian response groups, respectively. The cut-off values of pre-hCG P elevation duration were obtained on day 1 in the intermediate ovarian response group, and days 1 or 3 in the high ovarian response group. After correcting for other confounding factors, multivariate logistic regression analysis indicated that P level on the day of hCG administration was not associated with clinical pregnancy rates, but pre-hCG P elevation duration was negatively associated with clinical pregnancy rate in the intermediate and high ovarian response groups. P level is associated with clinical pregnancy rate only in the patients with intermediate or high ovarian response. The longer the duration of pre-hCG P 1 ng/ml, the lower the clinical pregnancy rate.
Introduction
Endometrium, the location of embryo implantation, provides nutrition for early embryonic development. Implantation failure is an important cause of in vitro fertilization-embryo transfer (IVF-ET) failure. The dialogue between the embryo and endometrium is vital, so it is no doubt that endometrial receptivity is strongly associated with pregnancy. Endometrial receptivity, a physiological status suitable for embryo implantation, has attracted more and more attention in recent years. The endometrium can accept embryo implantation only under the action of hormones and at a specific time. At present, the levels of hormones in the late follicular phase are regarded as reliable standards to evaluate endometrial receptivity. On one hand, it has been suggested that the level of progesterone (P) affects treatment outcomes of fresh cycles by changing endometrial receptivity [Bosch et al. Citation2003; Lee et al. Citation2009; Van Vaerenbergh et al. Citation2011] rather than the quality of the embryo [Bourgain and Devroey Citation2003; Lahoud et al. Citation2012; Melo et al. Citation2006]. On the other hand, it has also been suggested that the level of P is not associated with clinical pregnancy rates [Lai et al. Citation2009; Martínez et al. Citation2004; Miller et al. Citation1996]. In addition, there is a report that P elevation predicts good pregnancy outcomes [Doldi et al. Citation1999].
During ovarian stimulation, P elevation in the late follicular phase is associated with the accumulated secretion of theca cells caused by the simultaneous development of multiple ovarian follicles and the imbalance between follicle-stimulating hormone (FSH) and luteinizing hormone (LH) caused by LH repression. Pinopode occurs ahead of schedule with elevated P. This leads to inconsistent development between the embryo and endometrium, namely that the window of endometrial implantation has closed before embryo development enters the implantation period, decreasing the implantation rate. The degree of P elevation varies according to the ovarian stimulation protocol and ovarian response. The time the endometrial implantation window closes varies according to the duration of elevated pre-human chorionic gonadotropin (hCG) P. If the duration of elevated pre-hCG P is associated with clinical pregnancy rates, it is necessary to shorten the duration of pre-hCG P elevation. However, in most of the current studies, the sample size is limited, several ovarian stimulation protocols are used simultaneously, the cut-off values of P elevation are set without considering ovarian response, and the effects of the duration of elevated pre-hCG P elevation on treatment outcome are not observed. Therefore, in these studies, the results differ.
In the study described below, the sample size was large, all cycles received the long protocol, the effects of both P level on the day of first hCG administration and pre-hCG P elevation duration on treatment outcome were considered in the patients with different ovarian responses.
Results
Of the 8575 cycles, 6681 underwent IVF, 1811 intracytoplasmic sperm injection (ICSI), and 83 rescue ICSI, with a mean female age of 30.8 years (20–48) (). This study was divided as a function of the number of oocytes retrieved into a 1067 cycle poor ovarian response group, a 5800 cycle intermediate ovarian response group, and a 1708 cycle high ovarian response group. With P elevated on the day of first hCG administration, the clinical pregnancy rate significantly decreased in the intermediate ovarian response group (58.21%, to 42.55%, p < 0.0001, ) and in the high ovarian response group (56.00%, to 45.45%, p < 0.0001, ). However, in the poor ovarian response group, the level of P on the day of first hCG administration showed no significant relationship with clinical pregnancy rate (35.16%, to 45.45%, p = 0.66, ). The corresponding trend analysis performed using the Bosh and Labarta's method [Kilicdag et al. Citation2010] resolved statistical differences between 1.00–1.25 ng/ml and <1.00 ng/ml level of P, and between 1.75–2.00 ng/ml and 1.50–1.75 ng/ml level of P in the intermediate and high ovarian response groups, respectively ( and ). This suggested that 1 ng/ml or 1.75 ng/ml might be the cut-off values for serum P on the first day of hCG administration to affect clinical pregnancy rate in the patients with intermediate ovarian response and patients with high ovarian response, respectively.
Figure 1. The relation between serum progesterone (P) level on the day of hCG administration and clinical pregnancy rate in each group. The response was considered as a function of the P levels on the day of hCG administration. Samples were divided into the following 8 intervals: ≤1.00, 1.00–1.25, 1.25–1.5, 1.5–1.75, 1.75–2.00, 2.00–2.25, 2.25–2.5, and >2.5 ng/ml. The clinical pregnancy rate in each P interval was calculated to observe the relation between P level and clinical pregnancy rate in these patients. (A) intermediate ovarian response group (Mantel-Haenszel test: χ2 = 74.1721, p < 0.0001); (B) high ovarian response group (Mantel-Haenszel test: χ2 = 16.6985, p < 0.0001); (C) poor ovarian response group (Mantel-Haenszel test: χ2 = 0.1936, p < 0.66).
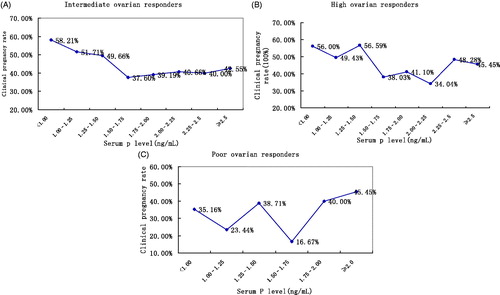
Figure 2. Cut-off values of the level of serum progesterone (P) on the day of hCG administration and duration of elevated pre-hCG P in the intermediate and high ovarian response groups. (A) Cut-off values of serum P level on the day of hCG administration in the intermediate ovarian response group. P levels were divided into the following 8 intervals: ≤1.00, 1.00–1.25, 1.25–1.5, 1.5–1.75, 1.75–2.00, 2.00–2.25, 2.25–2.5, and >2.5 ng/ml according to the level of P on the day of hCG administration. *p < 0.05 for comparison with preceding progesterone level interval; data are expressed as OR (95% CI) for each of the serum progesterone levels compared with the preceding progesterone group (<1.0 ng/ml). (B) Cut-off values of serum P level on the day of hCG administration in high ovarian response group. Response of the patients on the basis of the level of P on the day of hCG administration were divided into the following 8 intervals: ≤1.00, 1.00–1.25, 1.25–1.5, 1.5–1.75, 1.75–2.00, 2.00–2.25, 2.25–2.5, and >2.5 ng/ml. *p < 0.05 for comparison with preceding progesterone level interval; data are expressed as OR (95% CI) for each of the serum progesterone levels compared with the preceding progesterone group (<1.0 ng/ml). (C) Cut-off value of duration of pre-hCG P elevation in intermediate ovarian response group. According to different duration of elevated pre-hCG P, the following 5 intervals: 0, 1, 2, 3, and ≥4-day groups in these patients were considered. *p < 0.05 for comparison with preceding duration of pre hCG P rise interval; data are expressed as OR (95% CI) for each of the pre-hCG P elevation rise duration compared with the preceding duration of pre hCG P rise group (0 day). (D) Cut-off value of duration of pre-hCG P elevation in high ovarian response group. Patients were divided according to the duration of elevation of pre-hCG P; the durations of pre-hCG P elevation are divided into the following 5 intervals: 0, 1, 2, 3, and ≥4-day groups in these patients. *p < 0.05 for comparison with preceding duration of pre hCG P rise interval; data are expressed as OR (95% CI) for each of the pre-hCG P elevation rise duration compared with the preceding duration of pre -hCG P rise group (0 day). hCG: chorionic gonadotropin; on the day of hCG administration: the day of human chorionic gonadotropin administration; P: progesterone; OR:odds ratio; CI: confidence interval.
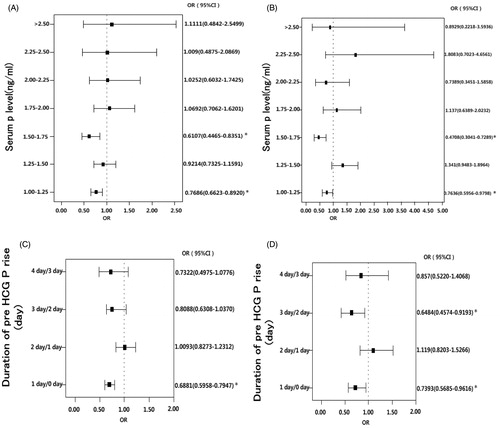
Table 1. General data of the 8575 patients undergoing their first IVF/ICSI cycle.
The duration of pre-hCG P elevation as a function of clinical pregnancy rate and miscarriage rate
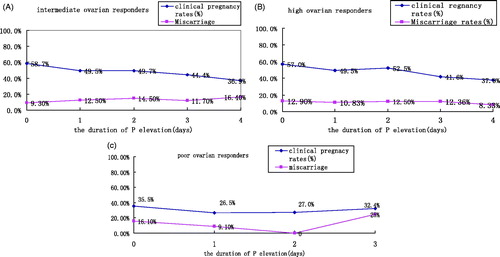
With the extension of duration of pre-hCG P elevation, clinical pregnancy rates significantly decreased (58.7%, to 36.9%, p < 0.0001), and there was a significant difference in the miscarriage rate among different time points (9.3%, to 16.4%, p = 0.011) in the intermediate group (). With the extension of duration of pre-hCG P elevation, clinical pregnancy rates significantly decreased (57%, to 37.9%, p < 0.0001), but there was no a significant difference in the miscarriage rate among different time points (12.9% to 8.33%, p = 0.943) in the high ovarian response group (). However, in the poor ovarian response group, the duration of pre-hCG P elevation was not significantly related to clinical pregnancy rate (35.5%, to 32.4%, p = 0.1874), and there was no a significant difference in the miscarriage rate among different time points (16.1%, to 25%, p = 0.373, ).
Figure 3. The relationship of duration of elevated pre-hCG P with the clinical pregnancy rate and miscarriage rate in each group. According to different durations of pre-hCG P elevation, the durations of pre-hCG P elevation are divided into the following 5 intervals: 0, 1, 2, 3, and ≥4-day groups in these patients. The clinical pregnancy rate and miscarriage rate in each pre-hCG P elevation group is calculated to observe the relation between duration of pre-hCG P elevation and clinical pregnancy rate in these patients. (A) intermediate ovarian response group (Clinical pregnancy rate: χ2 = 70.4634, p < 0.0001; miscarriage rate: χ2 = 13.237, p = 0.011); (B) high ovarian response group (Clinical pregnancy rate: χ2 = 21.4188, p < 0.0001; miscarriage rate: χ2 = 0.779, p = 0.943); (C) poor ovarian response group (Clinical pregnancy rate: χ2 = 1.7379, p = 0.1874; miscarriage rate: χ2 = 2.926, p = 0.373). hCG: human chorionic gonadotropin; P: progesterone.
There was a statistical difference between 1 day and 0 day duration of pre-hCG P elevation in the intermediate ovarian response group (), suggesting that 1 day might be the cut-off values of duration of pre-hCG P elevation to affect the clinical pregnancy rate in the patients with intermediate ovarian response. In the high ovarian response group, there were statistical differences between 3 days and 2 days, and 1 day and 0 day duration of pre-hCG P elevation (), suggesting that 1 day and 3 days might be the cut-off values of duration of pre-hCG P elevation to affect the clinical pregnancy rate in the patients with high ovarian response.
Logistic regression analysis of clinical pregnancy rate-related factors
In the intermediate ovarian response group, univariate logistic regression analysis indicated that age, body mass index (BMI), duration of infertility, Gn duration, Gn dosage, number of oocytes retrieved, fertilization rate, cleavage rate, rate of high-quality embryos, embryonic type (embryo or blastula), endometrial thickness, endometrial type, P level on the day of first hCG administration, and duration of pre-hCG P elevation were correlated with the clinical pregnancy rate. The above factors underwent multivariate logistic regression analysis. Multivariate logistic regression analysis displayed p < 0.05 in a number of factors including age, duration of infertility, Gn dosage, fertilization rate, rate of high-quality embryos, embryonic type (embryo or blastula), and duration of elevated pre-hCG P (). After correcting other confounding factors, the level of P on the day of first hCG administration failed to show an effect on clinical pregnancy rate. A negative effect of the duration of elevated pre-hCG P on decreased clinical pregnancy rate [OR: 0.88 (95%CI: 0.84–0.93)] was observed.
Table 2. Logistic regression analysis of clinical pregnancy rate-related factors in different ovarian response groups.
In the high ovarian response group, univariate logistic regression analysis indicated that age, Gn dosage, cleavage rate, rate of high-quality embryos, embryonic type (embryo or blastula), endometrial thickness, endometrial type, the level of P on the first day of hCG administration, and the duration of elevated pre-hCG P were correlated with the clinical pregnancy rate. The above factors underwent multivariate logistic regression analysis. Multivariate logistic regression analysis showed that the following factors including age, cleavage rate, rate of high-quality embryos, embryonic type (embryo or blastula), endometrial thickness, endometrial type, and duration of elevated pre-hCG P were significant p < 0.05 (). After correcting for other confounding factors, the level of P on the day of first hCG administration failed to show effects on clinical pregnancy rates and the negative effects of the duration of elevated pre-hCG P on clinical pregnancy rate decreased [OR: 0.88 (95%CI: 0.81–0.95)].
In the poor ovarian response group, univariate logistic regression analysis indicated that age, duration of fertility, basal FSH, Gn dosage, the level of P on the day of first hCG administration, number of oocyte retrieved, rate of high-quality embryos, endometrial thickness, number of embryos transferred were correlated along with the clinical pregnancy rate. The above factors underwent multivariate logistic regression analysis. Multivariate logistic regression analysis displayed p < 0.05 in the factors including age, duration of fertility, rate of high-quality embryos, endometrial thickness, and number of transferred embryos ().
The covariance of factors related to duration of elevated pre-hCG P was also considered. The level of E2 on the day of first hCG administration, the level of P on hCG, and the number of oocytes retrieved were significantly and positively correlated with the duration of elevation of pre-hCG P; but age, Gn dosage, Gn duration, and basal level of P were slightly and positively correlated with the duration of elevated pre-hCG P ().
Table 3. Analysis of pre-hCG P elevation duration-related factors in the 8575 cycles.
Discussion
Endometrial receptivity and embryo quality are the determinative factors of IVF/ICSI success [Roque et al. Citation2013]. Physiological status, progestogen along with the synergistic effects of E2 allows the endometrium to be ready for embryonic implantation. During controlled ovarian hyperstimulation, estrogens and progestogen beyond physical dosage act on the endometrium. Fleming and Jenkins [Citation2010] have reported that P secretion is associated with the number of developmental ovarian follicles, LH stimulation for theca cells, and FSH stimulation for granulosa cells. Based on the classic theory of two cells and two hormones, aldosterone is transformed into progestogen by FSH in granulosa cells, and then the progestogen is transformed into androgen by LH in theca cells, finally the androgen is transformed into estrogen in granulosa cells. Before luteinization, LH promotes the transformation of progestogen into androgen, decreasing the level of progestogen. Therefore, during ovarian stimulation, P elevation in the late follicular phase is associated with the accumulated secretion of theca cells caused by the simultaneous development of multiple ovarian follicles and the accelerated imbalance between FSH and LH caused by LH repression. With elevated P, pinopode occurs ahead of schedule. This leads to inconsistent development between embryo and endometrium. When embryo development enters the implantation period, endometrial implantation window has been closed, decreasing implantation rate. It is generally thought that elevated P does not affect embryo quality. In a study on oocyte-donation cycles, oocytes from the same donor were used in 2 IVF cycles. The level of P on the day of first hCG administration increased in the first IVF cycle, but in the second cycle, the level of P on the day of hCG was normal, and there were no significant differences in fertilization rate, cleavage rate, pregnancy rate, and miscarriage rate between the two cycles [Melo et al. Citation2006]. This suggests that elevated P affects endometrial receptivity rather than the quality of oocytes. A large-sample retrospective analysis indicated that there were no significant differences in fertilization rate and cleavage rate between the elevated P group and the control group, demonstrating that the elevation of P did not affect the quality of oocytes, but could affect pregnancy outcomes of IVF by decreasing the endometrial receptivity [Xu et al. Citation2012].
In this study, we retrospectively analyzed 8,575 IVS/ICSI cycles and carried out a Mantel-Haenszel trend test. We found that the negative effects of elevated P on the day of hCG administration and the duration of elevted pre-hCG P on pregnancy rates were associated with ovarian response; when the level of P was more than 1 ng/ml in the intermediate ovarian response group or more than 1.75 ng/ml in the high ovarian response group, clinical pregnancy rates significantly decreased, but in the poor ovarian response group, the level of P on the day of hCG administration was not significantly related to clinical pregnancy rate. In the high ovarian response group, with P elevated to >1 ng/ml lasting one day or 3 days, the rate of clinical pregnancy significantly decreased, but miscarriage rate was not significantly changed. In the intermediated ovarian response groups, with P elevated to >1 ng/ml lasting more than one day, the rate of clinical pregnancy significantly decreased, and miscarriage rate was significantly changed. In poor ovarian response group, the duration of elevated pre-hCG P was not significantly related to clinical pregnancy rate. The duration of elevated pre-hCG has no significant effects on miscarriage rates in each group. Logistic regression analysis of the clinical pregnancy rate-related factors indicated that the level of P on the day of hCG administration failed to affect the clinical pregnancy rate, but the duration of elevated pre-hCG P showed a negative effect on clinical pregnancy rate in the high and intermediate ovarian response groups.
There are many studies about the effects of the level of P on treatment outcome, but the level of P that affects pregnant outcomes has not been established. In previous studies, the cut-off value of the level of serum P on the day of hCG administration to affect pregnancy outcomes ranged from 0.9–2.0 ng/ml [Bosch et al. Citation2003; Griesinger et al. Citation2013; Kilicdag et al. Citation2010; Miller et al. Citation1996]. In some papers, the cut-off value was determined according to P (ng/ml) × 1000/E2 (pg/ml) >1 [Elnashar Citation2010; Younis et al. Citation2001]. Recently, attention has been paid to the definition of elevated P. Saleh et al. [Citation2009] used receiver operating characteristic (ROC) curve in a small-sample study, and found that the level of P on the day of hCG administration was not able to predict treatment outcome. A retrospective analysis of 4,032 IVF/ICS cycles indicated that a level of P on hCG administration >1.5 ng/ml decreased the pregnancy rate; and ROC curve was not suitable for predicting the effects of the level of P on the day of hCG administration on the rate of pregnancy because there was no a linear relationship between treatment outcome and the level of P on the day of hCG administration [Bosch et al. Citation2010]. Venetis et al. [Citation2007] emphasized the effects of the elevation of pre-hCG P on pregnancy rate in their Meta analysis of P as a function of pregnancy rate; and concluded that the level of P was not associated with pregnancy rate because the cut-off value of the level of P was set artificially in most studies, and reagents to determine P level and ovarian stimulation protocols were different in these studies. Another Meta analysis of 5 papers using GnRH antagonists and gonadotrophins to treat patients showed that as the level of E2 increased, the number of oocytes retrieved increased but with elevated P, a lower pregnancy rate was achieved [Kolibianakis et al. Citation2012]. A recent Meta analysis of more than 55,000 IVF cycles indicated that except the papers with P level using 0.4–0.6 ng/ml as the cut-off value, other papers (cut-off values of elevated P: 0.8–1.1 ng/ml, 1.2–1.4 ng/ml, 1.5–1.75 ng/ml, and 1.9–3.0 ng/ml) showed negative effects of elevated P on the day of hCG administration on pregnancy rates [Venetis et al. Citation2013]. In many studies, the methods to determine P elevation are different, so it remains a confounder to ensure the accuracy of studies [Fleming Citation2008]. In some current studies, the relation between P level and the number of oocytes retrieved is taken into consideration, namely that the cut-off values of the level of P are set according to different ovarian responses. Xu et al. [Citation2012] have reported that elevated P on the day of hCG administration decreases the pregnancy rate in all patients with different ovarian responses, and whether patients receive freezing cycles or early injection of hCG depends on the level of P on the day of hCG administration and ovarian response. In a retrospective analysis of 1,189 cycles, patients were divided into poor, intermediate, and high ovarian response groups, and p > 0.9 ng/ml on the day of hCG administration was regarded as early luteinization; the negative effects of early luteinization on pregnancy rate was only found in the patients with poor ovarian response [Fanchin et al. Citation1997].
Elevated serum P is related to the entrance of P secreted by multiple ovarian follicles into the blood [Barriere et al. Citation2007]. The level of P is positively correlated with the number of oocyte retrieved [Fatemi et al. Citation2013]. Therefore, the patients in this study were divided into poor, intermediate, and high ovarian response groups according to the number of oocytes retrieved. The longer the duration of elevated pre-hCG P, the earlier endometrial development starts, which aggravates the inconsistent development between embryo and endometrium. Therefore, when embryo development enters the implantation period, the endometrial implantation window has closed, decreasing the pregnancy rate. Fanchin et al. [Citation1993] have reported that when the level of P is between 2.86–3.18 nmol/L and lasts 2 days, the endometrium enters secretory phase ahead of schedule, resulting in inconsistent development between embryo and endometrium and decreases the embryo implantation rate. Kolibianakis et al. [Citation2002] and Van Vaerenbergh et al. [Citation2009] also found that when the endometrium on the day of hCG administration occurred ahead of schedule more than 3 days, no pregnancy was observed. A prospective study reported that the duration of elevated pre-hCG P was significantly longer in the non-pregnant group than in the pregnant group [Kyrou et al. Citation2011]. We also observed the relation between the duration of elevated pre-hCG P and the clinical pregnancy rate in this study, and found that with elevated P on the day of hCG administration or with extended duration of elevated pre-hCG P, the clinical pregnancy rate decreased in the intermediate and high ovarian response groups. Further analysis indicated that 1 ng/ml or 1.75 ng/ml might be the range of cut-off values for the level of serum P on the day of hCG administration that affects the clinical pregnancy rate in the patients with intermediate or high ovarian response. Using this cut off, one day of elevated pre-hCG P may be indicative of affecting the clinical pregnancy rate in the patients with intermediate or high ovarian response, and 3 days of elevated pre-hCG P more severely affect clinical pregnancy rate in the latter. However, both the level of P on the day of hCG administration and the duration of elevated pre-hCG P were not significantly associated with the clinical pregnancy rate in the poor ovarian response group. Therefore, in the patients having intermediate or high ovarian response and undergoing the long protocol, when the level of P on the day of hCG administration rises to 1 ng/ml, the clinical pregnancy rate is significantly affected, and when the level of P on the day of hCG rises to 1.75 ng/ml, the clinical pregnancy rate significantly decreases again; likewise, when p > 1 ng/ml lasts 1 day, the clinical pregnancy rate significantly decreases for the first time, and when p > 1 ng/ml lasts 3 days, we should pay attention to a further significant decline in clinical pregnancy rate in the patients with high ovarian response. In the high ovarian response group and poor ovarian response group, the duration of elevated pre-hCG P was not related to the rate of miscarriage; but in the intermediate ovarian response group, there was a significant difference in the miscarriage rate among different time points in which pre-hCG P was elevated. This may be related to the presence of other factors, e.g., age and endometrium.
After correcting for other confounding factors, logistic analysis indicated that the duration of elevated pre-hCG P was an independent factor that affects the clinical pregnancy rate, but the level of P on the day of hCG administration was not related to the clinical pregnancy rate in intermediate or high ovarian response patients. This suggests that we should pay more attention to the duration of elevated pre-hCG P in order to control the negative effect of P on treatment outcome. In the patients with poor ovarian response, both the level of P on the day of hCG administration and the duration of elevated pre-hCG P were not related to the clinical pregnancy rate, which was consistent with above results obtained by chi-square analysis. Our results are slightly different from the results of Huang et al. [Citation2012] who observed that the duration of elevated pre-hCG P affects treatment outcome in all patients. This may reflect different ovarian stimulation protocols.
The results presented in the above analysis suggest that preventing the elevation of the level of P before hCG administration is important. Venetis et al. [Citation2007] reported that elevated P before hCG administration was correlated with the number of ovarian follicles and E2 level, and that elevated P was caused by the accumulated secretion of the simultaneous development- multiple ovarian follicles. Andersen et al. [Citation2006] and Bosch et al. [Citation2005] and Bosch et al. [Citation2008] have confirmed that elevated P is associated with FSH dosage. Kyrou et al. [Citation2012] have reported that when the level of estrogen is greater than 1,790.5 pg/ml and the number of oocyte retrieved is greater than 9.5 on on the day of hCG administration, there will be the risk of p > 1.5 ng/ml. This study also found that the duration of elevated pre-hCG P was positively correlated with the number of oocytes retrieved, Gn dosage and Gn duration. Therefore, during ovarian stimulation, the starting dose of Gn should be determined based on patient’s age, BMI, basal number of ovarian follicles, and previous ovarian response; and at the same time, regimen of Gn administration must be adjusted according to ovarian response [Sunkara et al. Citation2011].
Although the study is limited by its retrospective nature and patients only from our reproductive center participated certain response features were revealed. In summary, ovarian response should be taken into account when considering the effect of the level of P on clinical pregnancy rate. In the patients with poor ovarian response, the changes in the level of P have no significant effects on the clinical pregnancy rate, so the quality and number of embryos and endometrial status should be considered. In intermediate or high ovarian response patients the situation is more complex. If P is greater than 1.00 ng/ml, then rises to 1.75 ng/ml or 1.00 ng/ml of elevated P lasts over 3 days, consideration should be given to fresh cycles in order to improve pregnancy rate. Whether the duration of elevated pre-hCG P affects endometrial histomorphology remains to be further studied. We hope that a further prospective study will be carried out by more reproductive centers.
Materials and Methods
All study methods were approved by the Ethics Committee of the First Affiliated Hospital of Zhengzhou University. All the subjects enrolled into the study gave written formal consent to participate. A total of 8575 cycles receiving IVF or ICSI in our reproductive center between January 2011 and June 2013 were enrolled in this study. The exclusion criteria included: (i) uterine malformation, (ii) oocyte or sperm-donation cycles, (iii) oocyte retrieval failure, (iv) repetition cycles, (v) cycles of cancelled embryo transfer, and (vi) cycles of no embryos transferred.
Controlled ovarian stimulation scheme
Controlled ovarian stimulation was performed with standard long protocol in all patients. Decapeptyl (Ferring, Germany) or diphereline (Ispen Pharma Biotech, France), gonadotropin releasing hormone agonist (GnRH-α), was used to obtain complete down regulation (FSH ≤ 5 IU/L, E2 ≤ 50 pg/ml and LH ≤ 5 IU/L, endometrial thickness ≤5 mm, and the diameter of the largest follicle <10 mm), Gn (FSH, gonal-F, Merch-Serono, Geneva, Switzerland) was given. The starting dose of Gn was determined based on patient’s age, BMI, basal FSH, and the number of antral follicle. When the diameter of the largest follicle was more than 14 mm, the fasting blood was collected every d to determine the levels of LH, E2, and P. The regimen of Gn administration was adjusted based on follicle size and the levels of hormones. When the diameter of the largest follicle was more than 20 mm and the follicles with a diameter of more than 16 mm accounted for more than 2/3, hCG was intramuscularly injected instead of Gn. Thirty-seven h later, oocyte retrieval was performed under ultrasonic guidance. The number of oocyte retrieval was recorded. Fertilization was performed 3 or 4 h after oocyte retrieval. Embryo transfer was performed 2–3 d after oocyte retrieval. At the same time, the numbers of fertilization, cleavage, and high-quality embryos were also recorded. Progesterone was intramuscularly injected after oocyte retrieval. β–HCG was determined 14 and 18 d after embryo transfer. It was diagnosed as clinical pregnancy when B-mode ultrasound showed gestation sac, embryo bud, or fetal heart beat 35 d after embryo transfer.
Hormone determination
When the diameter of the largest follicle was more than 14 mm, the fasting blood was collected every d to determine the levels of LH, E2, and P. All intraassay and interassay variations were less than 10%.
Statistical analysis
Statistical treatment was performed with SAS9.1 software. Comparison of rates between groups was performed with the Mantel-Haenszel test. Pearson correlation coefficient was used in analysis of linear correlation between two variables. Clinical pregnancy rate-related factors underwent logistic regression analysis. The size of test was α = 0.05. According to the number of oocyte retrieval, the patients in this study were divided into poor ovarian response group (oocyte retrieval <5), intermediate ovarian response group (5≤ oocyte retrieval ≤15), and high ovarian response group (oocyte retrieval ≥16).
Logistic regression
Before hCG administration, p > 1 ng/ml was regarded as P elevation [Vankrieken Citation2000]. According to different durations of pre-hCG P elevation, these patients were divided into 5 groups: 0, 1, 2, 3, and ≥4–d groups. According to different ages of patients, these patients were divided into 5 groups: 20–24, 25–29, 30–34, 35–39, and ≥40-year groups. According to different Gn dosages, these patients were divided into 7 groups: <1000, 1000–1999, 2000–2999, 3000–3999, 4000–4999, 5000–5999, and ≥6000 IU groups. According to different E2 levels on the day of hCG administration, these patients were divided into 12 groups: <1000, 1000–1999, 2000–2999, 3000–3999, 4000–4999, 5000–5999, 6000–6999, 7000–799, 8000–8999, 9000–9999, 10000–11000, and ≥11000 IU/L groups. According to different P levels on the day of hCG administration, these patients were divided into 8 groups: <1.00, 1.00–1.25, 1.25–1.5, 1.5–1.75, 1.75–2.00, 2.00–2.25, 2.25–2.5, and ≥2.5 ng/ml groups. The parameters above were regarded as continuous variables. First, the factors including age, body weight, duration of infertility, basal FSH, Gn days, Gn dosage, E2 level on the day of hCG administration, P level on hCG, number of oocyte retrieval, fertilization rate, cleavage rate, rate of high-quality embryos, embryonic type (embryo or blastula), number of transferred embryos, endometrial thickness, endometrial type on the day of hCG administration, and duration of pre-hCG P elevation underwent univariate logistic regression analysis; and then the screened factors underwent multivariate logistic regression analysis to obtain odds ratio (OR) values and 95% confidence interval (CI).
| Abbreviations | ||
| P | = | progesterone |
| IVF-ET | = | in vitro fertilization-embryo transfer |
| ICSI | = | intracytoplasmic sperm injection |
| hCG | = | human chorionic gonadotropin |
| FSH | = | follicle-stimulating hormone |
| LH | = | luteinizing hormone |
| GnRH-α | = | gonadotropin releasing hormone agonist |
| OR | = | odds ratio |
| CI | = | confidence interval |
| BMI | = | body mass index |
Declaration of interest
The authors report no conflicts of interest. The authors alone are responsible for the content and writing of the paper.
Author contributions
Conceived and designed the study: WD, Y-pS; Performed the study: WD, Z-qB; Analyzed the data: L-lW; Wrote the manuscript: WD. All authors approved revisions and the final paper.
References
- Andersen, A.N., Devroey, P. and Arce, J.C. (2006) Clinical outcome following stimulation with highly purified hMG or recombinant FSH in patients undergoing IVF: A randomized assessor-blind controlled trial. Hum Reprod 21:3217–3227
- Barriere, P., Duclos, A.S. and Masson, D. (2007) Does serum progesterone levels on the day of human chorionic gonadotrophin administration affect IVF results? Fertil Steril 88:144–149
- Bosch, E., Escudero, E., Crespo, J., Simon, C., Remohi, J. and Pellicer, A. (2005) Serum luteinizing hormone in patients undergoing ovarian stimulation with gonadotropin-releasing hormone antagonists and recombinant follicle-stimulating hormone and its relationship with cycle outcome. Fertil Steril 84:1529–1532
- Bosch, E., Labarta, E., Crespo, J., Simón, C., Remohí, J., Jenkins, J., et al. (2010) Circulating progesterone levels and ongoing pregnancy rates in controlled ovarian stimulation cycles for in vitro fertilization: Analysis of over 4000 cycles. Hum Reprod 25:2092–2100
- Bosch, E., Valencia, I., Escudero, E., Crespo, J., Simón, C., Remohí, J. and Pellicer, A. (2003) Premature luteinization during gonadotropin-releasing hormone antagonist cycles and its relationship with in vitro fertilization outcome. Fertil Steril 80:1444–1449
- Bosch, E., Vidal, C., Labarta, E., Simon, C., Remohi, J. and Pellicer, A. (2008) Highly purified hMG versus recombinant FSH in ovarian hyperstimulation with GnRH antagonists—a randomized study. Hum Reprod 23:2346–2351
- Bourgain, C. and Devroey, P. (2003) The endometrium in stimulated cycles for IVF. Hum Reprod Update 9:515–522
- Doldi, N., Marsiglio, E., Destefani, A., Gessi, A., Merati, G. and Ferrari, A. (1999) Elevated serum progesterone on the day of HCG administration in IVF is associated with a higher pregnancy rate in polycystic ovary syndrome. Hum Reprod 14:601–605
- Elnashar, A.M. (2010) Progesterone rise on the day of hCG administration (premature luteinization) in IVF: An overdue update. J Assist Reprod Genet 27:149–55
- Fanchin, R., de Ziegler, D., Taieb, J., Hazout, A. and Frydman, R. (1993) Premature elevation of plasma progesterone alters pregnancy rates of in-vitro fertilization and embryo transfer. Fertil Steril 59:1090–1094
- Fanchin, R., Righini, C., Olivennes, F., Ferreira, A.L., de Ziegler, D. and Frydman, R. (1997) Consequences of premature progesterone elevation on the outcome of in vitro fertilization: Insights into a controversy. Fertil Steril 68:799–805
- Fatemi, H.M., Doody, K., Griesinger, G., Witjes, H. and Mannaerts, B. (2013) High ovarian response does not jeopardize ongoing pregnancy rates and increases cumulative pregnancy rates in a GnRH-antagonist protocol. Hum Reprod 28:442–452
- Fleming, R. and Jenkins, J. (2010) The source and implications of progesterone rise during the follicular phase of assisted reproduction cycles. Reprod Biomed Online 21:446–449
- Fleming, R. (2008) Progesterone elevation on the day of hCG: Methodological issues. Hum Reprod Update 14:391–392
- Griesinger, G, Mannaerts, B., Andersen, C.Y., Witjes, H., Kolibianakis, E.M. and Gordon, K. (2013) Progesterone elevation does not compromise pregnancy rates in high responders: A pooled analysis of in vitro fertilization patients treated with recombinant follicle-stimulating hormone/gonadotropin-releasing hormone antagonist in six trials. Fertil Steril 12:1622. 8.e1–3
- Huang, C.C., Lien, Y.R., Chen, H.F., Che, M.J., Shieh, C.J., Yao, Y.L., et al. (2012) The duration of pre-ovulatory serum progesterone elevation before hCG administration affects the outcome of IVF/ICSI cycles. Hum Reprod 27:2036–2045
- Kilicdag, E.B., Haydardedeoglu, B., Cok, T., Hacivelioglu, S.O. and Bagis, T. (2010) Premature progesterone elevation impairs implantation and live birth rates in GnRH-agonist IVF/ICSI cycles. Arch Gynecol Obstet 28:1747–1752
- Kolibianakis, E., Bourgain, C., Albano, C., Osmanagaoglu, K., Smitz, J., Van Steirteghem, A., et al. (2002) Effect of ovarian stimulation with recombinant follicle stimulating hormone, gonadotropin releasing hormone antagonist, and human chorionic gonadotropin on endometrial maturation on the day of oocyte pick-up. Fertil Steril 78:1025–1029
- Kolibianakis, E.M., Venetis, C.A., Bontis, J. and Tarlatzis, B.C. (2012) Significantly lower pregnancy rates in the presence of progesterone elevation in patients treated with GnRH antagonists and gonadotrophins: A systematic review and meta-analysis. Curr Pharm Biotechnol 13:464–470
- Kyrou, D., Al-Azemi, M., Papanikolaou, E.G., Donoso, P., Tziomalos, K., Devroey, P., et al. (2012) The relationship of premature progesterone rise with serum estradiol levels and number of follicles in GnRH antagonist/recombinant FSH-stimulated cycles. Eur J Obstet Gynecol Reprod Biol 162:165–168
- Kyrou, D., Kolibianakis, E.M., Fatemi, H.M., Camus, M., Tournaye, H., Tarlatzis, B.C., et al. (2011) High exposure to progesterone between the end of menstruation and the day of triggering final oocyte maturation is associated with a decreased probability of pregnancy in patients treated by in vitro fertilization and intracytoplasmic sperm injection. Fertil Steril 96:884–888
- Lahoud, R., Kwik, M., Ryan, J., Al-Jefout, M., Foley, J. and Illingworth, P. (2012) Elevated progesterone in GnRH agonist down regulated in vitro fertilisation (IVFICSI) cycles reduces live birth rates but not embryo quality. Arch Gynecol Obstet 285:535–540
- Lai, T.H., Lee, F.K., Lin, T.K., Horng, S.G., Chen, S.C., Chen, Y.H., et al. (2009) An increased serum progesterone-to-estradiol ratio on the day of human chorionic gonadotropin administration does not have a negative impact on clinical pregnancy rate in women with normal ovarian reserve treated with a long gonadotropin releasing hormone agonist protocol. Fertil Steril 92:508–514
- Lee, F.K., Lai, T.H., Lin, T.K., Horng, S.G. and Chen, S.C. (2009) Relationship of progesterone/estradiol ratio on day of hCG administration and pregnancy outcomes in high responders undergoing in vitro fertilization. Fertil Steril 92:1284–1289
- Martínez, F., Coroleu, B., Clua, E., Tur, R., Buxaderas, R., Parera, N., et al. (2004) Serum progesterone concentrations on the day of HCG administration cannot predict pregnancy in assisted reproduction cycles. Reprod Biomed Online 8:183–190
- Melo, M.A., Meseguer, M., Garrido, N., Bosch, E., Pellicer, A. and Remohi, J. (2006) The significance of premature luteinization in an oocyte-donation programme. Hum Reprod 21:1503–1507
- Miller, K.F., Behnke, E.J., Arciaga, R.L., Goldberg, J.M., Chin, N.W. and Awadalla S.G. (1996) The significance of elevated progesterone at the time of administration of human chorionic gonadotropin may be related to luteal support. J Assist Reprod Genet 13:698–701
- Roque, M., Lattes, K., Serra, S., Sola, I., Geber, S., Carreras, R., et al. (2013) Fresh embryo transfer versus frozen embryo transfer in in vitro fertilization cycles: A systematic review and meta-analysis. Fertil Steril 99:156–162
- Saleh, H.A., Omran, M.S. and Draz, M. (2009) Does subtle progesterone rise on the day of HCG affect pregnancy rate in long agonist ICSI cycles? J Assist Reprod Genet 26:239–242
- Sunkara, S.K., Rittenberg, V., Raine-Fenning, N., Bhattacharya, S., Zamora, J. and Coomarasamy, A. (2011) Association between the number of eggs and live birth in IVF treatment: An analysis of 400135 treatment cycles. Hum Reprod 26:1768–1774
- Vankrieken, L. (2000) IMMULITE Reproductive Hormone Assays: Multicenter Reference Range Data. Document No. ZB157-D. Diagnostic Products Corporation, Los Angeles, CA, USA
- Van Vaerenbergh, H.M., Fatemi, C., Blockeel, L., Van Lommel, P., In't Veld, F., Schuit, E.M., et al. (2011) Progesterone rise on hCG day in GnRH antagonist/rFSH stimulated cycles affects endometrial gene expression. Reprod Biomed Online 22:263–271
- Van Vaerenbergh, I., Van Lommel, L., Ghislain, V., In’t Veld, P., Schuit, F., Fatemi, H.M., et al. (2009) In GnRH antagonist/rec-FSH stimulated cycles, advanced endometrial maturation on the day of oocyte retrieval correlates with altered gene expression. Hum Reprod 24:1085–1091
- Venetis, C.A., Kolibianakis, E.M., Bosdou, J.K. and Tarlatzis, B.C. (2013) Progesterone elevation and probability of pregnancy after IVF: A systematic review and meta-analysis of over 60,000 cycles. Hum Reprod Update 19:433–457
- Venetis, C.A., Kolibianakis, E.M., Papanikolaou, E., Bontis, J., Devroey, P. and Tarlatzis, B.C. (2007) Is progesterone elevation on the day of human chorionic gonadotrophin administration associated with the probability of pregnancy in in vitro fertilization? A systematic review and meta-analysis. Hum Reprod Update 13:343–355
- Xu, B., Li, Z., Zhang, H., Jin, L., Li, Y., Ai, J., et al. (2012) Serum progesterone level effects on the outcome of in vitro fertilization in patients with different ovarian response: An analysis of more than 10,000 cycles. Fertil Steril 97:1321–1327
- Younis, J.S., Matilsky, M., Radin, O. and Ben-Ami, M. (2001) Increased progesterone/estradiol ratio in the late follicular phase could be related to low ovarian reserve in in vitro fertilization–embryo transfer cycles with a long gonadotropin-releasing hormone agonist. Fertil Steril 76:294–299