
Abstract
Biological rhythms are driven by endogenous biological clocks; in mammals, the master clock is located in the suprachiasmatic nucleus (SCN) of the hypothalamus. This master pacemaker can synchronize other peripheral oscillators in several tissues such as some involved in endocrine or reproductive functions. The presence of an endogenous placental clock has received little attention. In fact, there are no studies in human full-term placentas. To test the existence of an endogenous pacemaker in this tissue we have studied the expression of circadian locomoter output cycles kaput (Clock), brain and muscle arnt-like (Bmal)1, period (Per)2, and cryptochrome (Cry)1 mRNAs at 00, 04, 08, 12, 16, and 20 hours by qPCR. The four clock genes studied are expressed in full-term human placenta. The results obtained allow us to suggest that a peripheral oscillator exists in human placenta. Data were analyzed using Fourier series where only the Clock and Bmal1 expression shows a circadian rhythm.
Introduction
Biological rhythms in organisms are able to cope with fluctuations in the external environment. The rhythms are driven by endogenous biological clocks. In mammals the master clock is located in the hypothalamic suprachiasmatic nucleus (SCN) [Rusak and Zucker Citation1979]. The molecular regulation of the biological clock is based on the transcriptional/translational feedback loop of some proteins like cryptochrome (CRY), period (PER), brain and muscle arnt-like protein (BMAL), and circadian locomoter output cycles kaput (CLOCK) [Hida et al. Citation2000]. CLOCK and BMAL form a heterodimer to promote transcription of the Per, Cry, and Dec genes. After translating PER and CRY into the cytoplasm, they form heterodimeric complexes that translocate to the nucleus and inhibit their own transcription [Lowrey and Takahashi Citation2011].
Most clock genes are expressed in central and peripheral structures [Abe et al. Citation2002; Balsalobre et al. Citation1998; Yamazaki et al. Citation2000]. We have previously reported the expression and regulation of clock genes in rat pineal gland [Simonneaux et al. Citation2004]. The circadian expression of the clock genes promotes homeostasis where circadian disruption is associated with several pathologies like obesity or cancer [Filipski et al. Citation2003; Froy Citation2010].
The SCN can influence other peripheral clocks in almost every tissue that are all synchronized with the master clock. Among these tissues, there are some involved in endocrine or reproductive functions [Hastings et al. Citation2007], including placenta [Ratajczak et al. Citation2010; Wharfe et al. Citation2011]. There is enough evidence that circadian rhythmicity and reproduction are interconnected. The circadian timing system influences a wide range of physiological systems through its influence on hypothalamic-pituitary-gonadal axis. In this way, the impact of circadian rhythms on the timing of key reproductive events like ovulation and parturition is well recognized [Boden and Kennaway Citation2006]. In addition, female reproductive function is under strict circadian control at every level of the hypothalamic-pituitary-gonadal axis, and in the establishment and successful maintenance of pregnancy [Miller and Takahashi Citation2014]. Several studies indicate that pregnancy significantly impacts clock gene expression in maternal tissues [Schrader et al. Citation2010; Citation2011]. Moreover, the uterine clock has been implicated in the time of parturition in rodents [Olcese Citation2012]. There is evidence for circadian variation in the onset of labor in humans and animal models, mainly driven by circadian signals from the mother and fetus [Serón-Ferré et al. Citation1993] but a role for clock genes in linking these signals to myometrial activity seems likely.
The presence of an endogenous placental clock has received little attention particularly in humans although several reports have demonstrated the rhythmicity of gene expression and hormone production by this tissue. Thus, maternal plasma human chorionic gonadotropin levels show circadian rhythms in the first trimester of gestation when absolute levels are maximal [Díaz-Cueto et al. Citation1994]. Circadian variations were also described in relation with placental steroidogenesis in human and non-human primates [Challis et al. Citation1980; Patrick et al. Citation1980]. Glucocorticoids are also a signal conveying circadian information from the mother to the placenta and fetus. Published data [Mark et al. Citation2011] showed in placental rat zone-dependent circadian rhythmic expression of glucocorticoid receptor, also proinflammatory cytokines, particularly TNFα.
It is established that all key components of the placental clock gene machinery are present in rodent placenta. Clear circadian variation for several clock genes has been reported in mouse placenta [(Ratajczak et al. Citation2010] and later in rat placental tissue [Wharfe et al. Citation2011]. However, the conventional transcriptional-translational feedback loops appear less robust and coordinated [Ratajczak et al. Citation2010; Wharfe et al. Citation2011]. Others [Frigato et al. Citation2009] have identified the rhythmic expression of clock genes in placental cells but as far as we know, there are no reports of clock genes rhythmic expression in full-term human placenta which is addressed in this research communication.
Results
The possible rhythm of Clock, Bmal1, Cry1, and Per2 genes were analyzed in samples from human full term placenta at 00, 04, 08, 12, 16, and 20 hours following delivery. Clock expression was determined by PCR following the procedure described in the Material and Methods section (see more details in the “Real-time quantitative polymerase chain reaction” section). The existence of circadian rhythms was analyzed by fitting the data to a curve (see below “Mathematical treatment to the data” in the Material and Methods section).
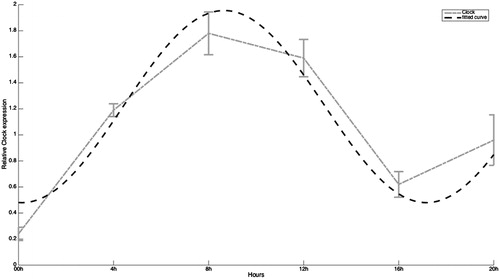
shows the analysis of mRNA Clock values using curve fitting. The model obtained is characterized (with 95% confidence bounds) by a0 = 1.218, a1 = −0.02974, b1 = −0.737, and w = 1.477. We deduce that the fitting of Clock gene is quite good since SSE is close to 0 (0.1228) and R-square is close to 1 (0.9275). Specifically, Clock mRNA is are very low at 00:00 hour, then increased to the next time point and peaked at 08:00 hours, defining acrophase. Then it slightly falls to 10.6% of the peak value at 12:00 hours. In the early afternoon, at 16:00 hours, Clock mRNA values dramatically fall to 65% of the peak value but in the late afternoon again mRNA values discreetly increase.
Figure 1. Expression of Clock mRNA in human full-term placenta at 00, 04, 08, 12, 16, and 20 hours of the day. Values are means ± SEM. Clock: circadian locomoter output cycles kaput.
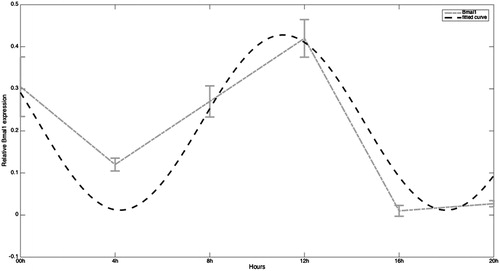
shows the same mathematical analysis for Bmal1 gene values. For this gene the coefficients of the model are: a0 = 0.2199, a1 = 0.1717, b1 = 0.118, and w = 1.825. SSE is 0.02316 and R-square is 0.8302 in this case. Thus, for Bmal1 gene the analysis shows that the fitting of Bmal1 gene is good since SSE is especially close to 0 and R-square is close to 1. Although the fit to the theoretical curve is good, the rhythm shows slight differences compared to the rhythm observed for Clock mRNA. In fact acrophase appears 4 hours later (at 12:00 hours) than the observed for the above-mentioned Clock gene (acrophase at 08:00 hours). The mRNA Bmal1 values are high at 00:00 hour, representing a percentage of almost 73% of the peak value observed at the acrophase then decrease at 04:00 hours before increasing again at 08:00 hours and peaking at 12:00 hours. Subsequently, values dramatically decrease (16:00 hours) to a very low value that represents only the 2.4% of the peak value at acrophase. Finally, they remain low at the end at the afternoon (at 20:00 hours).
Figure 2. Expression of Bmal1 mRNA in human full-term placenta at 00, 04, 08, 12, 16, and 20 hours of the day. Values are means ± SEM. Bmal: brain and muscle arnt-like.
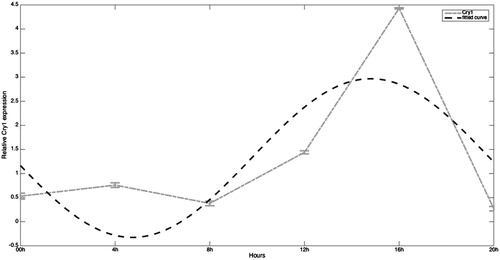
In the case of Cry1, the model generated () is defined by a0 = 1.321, a1 = 1.505, b1 = −0.6686, and w = 1.248. For Cry1 gene the SSE is very high (5.76) and R-square is not close to 1 (0.5403) so the fit is not satisfactory. However, we observe a clear maximum in the active phase of the day even though it is delayed 8 hours and 4 hours compared to Clock and Bmal1, respectively. mRNA Cry1 levels are low during the night and start increasing early in the morning (from 08:00 hours to 12:00 hours). The values at this time are 4-fold higher than at 08:00 hours. At 16:00 hours (acrophase of this rhythm) the values are strikingly high, 11-fold higher than the observed at 08:00 hours, thus the amplitude of the data through a 24-hour cycle is higher than the observed for both Clock and Bmal1 genes. In the late afternoon the values for Cry1 mRNA are again low, in fact the lowest values appear at this time (20:00 hours).
Figure 3. Expression of Cry1 mRNA in human full-term placenta at 00, 04, 08, 12, 16, and 20 hours of the day. Values are means ± SEM. Cry: cryptochrome.
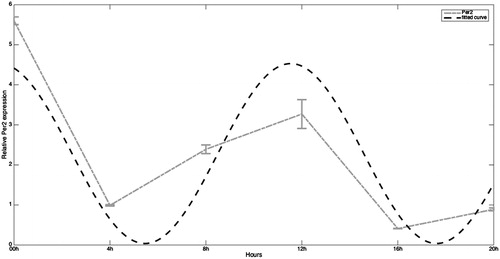
shows the mathematical analysis for Per2 (a0 = 2.284, a1 = −0.392, b1 = 2.212, and w = 2.067, SSE: 3.965 and R-square: 0.7925). SSE for Per2 is better than for Cry1 but is far from 0 and R-squared is also not close to 1, indicating that the fit for this gene is far from optimal. The rhythm appears much closer to 12-hour than to a 24-hour-cycle since values are high at 00:00 hour and also 12 hours later, at 12:00 hours. After 00:00 hour values decrease and at 04:00 hours the values are 7-fold lower. In a similar way after 12:00 hours Per2 mRNA decreases again, with values at 16:00 hours 8-fold lower than at 12:00 hours. Surprisingly, the highest values for this gene appear during night (at 00:00 hour) in contrast to that observed for the other three genes. Note that according with Shannon-Nyquist theorem [Marks Citation2009], the shortest periodicity is approximately 8 hours.
Figure 4. Expression of Per2 mRNA in human full-term placenta at 00, 04, 08, 12, 16, and 20 hours of the day. Values are means ± SEM. Per: period.
Discussion
Clock gene expression in human tissues such as liver, lung, pancreas, or in those within the reproductive system like oocytes, ovary, or uterus revealed a circadian rhythmic profile [Dibner et al. Citation2010; Kennaway et al. Citation2012]. Therefore, it stands to reason that human placenta may also be a peripheral clock. The presence of circadian rhythms for placental clock genes is not well described although there is considerable evidence of rhythmical hormone production by the placenta, of several expressed genes. In this sense, previous authors [Díaz-Cueto et al. Citation1994] showed the existence of significant circadian profiles of serum human chorionic gonadotropin levels throughout gestation. An inverse relationship between second trimester maternal cortisol and estriol has been revealed [Patrick et al. Citation1980] with a circadian pattern of labor onset and timing of parturition evident in humans [Olcese Citation2012]. For the first time we describe herein that Clock, Bmal1, Per2, and Cry1 are expressed in human full-term placenta and this expression showed a potential circadian rhythm. To our knowledge, there is only one published article related to clock gene expression in human placental tissue [Balsalobre et al. Citation1998] but the authors studied clock gene expression not in full-term placenta, but in cells derived from the trophoblast, the main component of placenta contributing to the formation of chorionic villi during the first trimester of gestation. Although they identified rhythmical Per2 and Dec1 mRNA expression in the trophoblast cell line HTR-8/SVneo, it was only after cell treatment with serum-rich medium that it is known to start clock gene oscillations in several cell types [Balsalobre et al. Citation1998]. Thus, our study is clearly the first to reveal the clock gene expression in human full-term placenta. However, this finding presents certain limitations since we cannot rule out that the expression of the clock genes may be affected by vaginal delivery having in mind that it is associated with increased stress hormones that can affect the expression of several genes.
It is important to note that in our study only two of the genes showed clear circadian variation, specifically the best fit to the theoretical curve using the Fourier model was Clock mRNA. The fit was also good for Bmal1 gene. However, Per2 and Cry1 genes did not display clear significantly circadian variation since their respective R-square were far from 0.8. Accordingly, we used a Fourier method [Marks Citation2009] to test for the presence of a clear circadian rhythm in the clock genes studied.
Previously, it has been shown [Wharfe et al. Citation2011] that the rat placenta expresses several clock genes with relatively little circadian variation but in a highly zone-specific manner, the marginal effect of the time of the day was observed for Bmal1, Per1, and Per2. Indeed, their expression patterns were broadly parallel, with the peaks in the active phase. In contrast, in humans we did not find parallelism with data previously found for rat placenta. The acrophase of both Clock and Bmal1 mRNA rhythms appears during the active phase of the day, at 08:00 hours and 12:00 hours, respectively. But we cannot say the same about Per2 mRNA values. In this case, surprisingly, the rhythm does not appear to approximate a 24-hour cycle which seems much closer to 12-hour.
Therefore, Clock and Bmal1 genes circadian profiles are both in phase in human placenta. In addition, the expression of Per2 was not at all parallel to Clock and Bmal1. As a consequence, it is possible to conclude that the regulation of the possible effective peripheral oscillator follows the well-known pattern described for the master clock in the SCN. It is known that Clock and Bmal1 genes generate the CLOCK and BMAL 1 proteins in SCN. After, they form a heterodimer and return to the nucleus to bind to a specific enhancer region in the promoters of the genes Cry1 and Per2 and drive their transcription [Gekakis et al. Citation1998; Jin et al. Citation1999; Kume et al. Citation1999].
Although the Cry1 gene is clearly expressed, the fit to the Fourier model is not as good as for Bmal1 or Clock. Previous data have shown that the cryptochrome genes (Cry1 and Cry2) are expressed in mouse placenta but the amplitude was relatively low compared to those in different tissues like liver [Ratajczak et al. Citation2010]. As presented in whole mouse placenta, the above study described time-of-day variation for Cry1 and Per2 but no variations were found for Bmal1 or Clock over the course of the day. This is quite different than those observed from human tissues and are again different from those found in placental tissue from other mammalian species since in both cases the local maxima appear in the active phase of the day. In mouse placenta the authors observed maxima at ZT 16, i.e., 4 hours after the beginning of the active phase while in our results from human placenta maximum occurs at 16:00 hours, i.e., at least 8 hours after the beginning of the active phase. For this reason, we deduce that a phase delay occurs in human full term placenta compared to mouse full-term placenta. Moreover, minima appear in mouse at ZT0 and ZT4, at the beginning of the active phase and our data showed minima values during the night, in the inactive phase.
The different circadian profile of the clock genes for two different species, rat (nocturnal) and human (diurnal) suggests a role of the placental clock genes in the timing of parturition since parturition circadian timing is species-specific [Olcese Citation2012]. Rats or golden hamsters give birth predominantly during the subjective day [Plaut et al. Citation1970]. However, human parturition has been amply reported to come about during the late night and early morning hours [Glattre and Bjerkedal Citation1983; Vatish et al. Citation2010]. Involvement of circadian clock in parturition was first pointed out by Miller et al. [Citation2004] when they reported that mutant mice (Clock Δ9) failed to enter or prolonged labor parturition. Subsequent studies from others have provided contradictory findings [Kennaway et al. Citation2004].
It is accepted that a large variety of physiological functions, including reproductive processes, metabolism, and hormone secretions, depend on the circadian clock [Miller et al. Citation2004; Urlep and Rozman Citation2013]. But circadian peripheral disruption increases disease risk. Examples are the higher incidence of cancer [Conlon et al. Citation2007], obesity, and diabetes [Arble et al. Citation2009; Horikawa et al. Citation2005], and hypertension and psychological disorders [Bildt and Michélsen Citation2002; Kivimäki et al. Citation2006]. Moreover, the maternal optimal circadian rhythmicity in the mother is important since her circadian clock, either directly or indirectly via the melatonin rhythm, programs the developing master oscillator of the fetus [Reiter et al. Citation2014]. Therefore, once the existence of a peripheral clock in full-term human placenta is observed, it will be of interest to analyze the relationship between several placenta-related pathologies like preeclampsia and the altered circadian clock gene expression.
Additional studies are necessary to increase our understanding of the human placental oscillator including the analysis of downstream genes affected by the clock network. It would also be interesting to find relationships between clock genes expression and maternal glucocorticoids or proinflammatory cytokines. Despite the limitations of the present study, the data provide new and interesting information about the endogenous oscillator in human placenta since it is the first to reveal clock gene expression in human full-term placenta.
Materials and Methods
Sample collection
Human placental tissue samples were obtained from thirty-one pregnant patients following birth by vaginal delivery (mean age: 32.95 y). These specimens were isolated at six time points: 00:00 h (n = 5), 04:00 h (n = 4), 08:00 h (n = 6), 12:00 h (n = 6), 16:00 h (n = 4), and 20:00 h (n = 6). The gestation period ranged from 36 to 40 w. Consent for clinical research was obtained from each patient. The study has complied with the Declaration of Helsinki and was approved by the institutional review board. No pregnant patient had previous pathology. The specimens were freshly harvested, immediately embedded in O.C.T. Compound (Tissue Tek, Sakura, Netherlands) and then frozen in liquid nitrogen and stored at −80°C.
RNA extraction and cDNA synthesis
Prior to RNA extraction, placental tissue was washed with PBS (Oxoid, Hampshire, England) and treated with lysing buffer (BD Biosciences, USA), to avoid erythrocyte contamination. Total RNA was isolated using the easy-BLUE kit (Prosisa, Spain) according to the manufacturer’s instructions. The quality of the RNA was assessed through absorbance measurements made using a NanoDrop ND-1000 UV–Vis Spectrophotometer (NanoDropTechnologies, Wilmington, DE, USA). All the samples used in the PCR procedures showed a 260/280 nm absorbance ratio between 1.8 and 2.2. A ratio of approximately 2 is accepted as pure for RNA. Each RNA sample was reverse transcribed using the oligo-pdT and random primers provided in the first-strand complementary DNA (cDNA) synthesis kit for RT-PCR (AMV; Roche Diagnostic, Switzerland) following the manufacturer’s instructions. The cDNA samples were then cooled at 4°C and stored at −20°C until use. To confirm the total absence of residual RNA, we performed a conventional PCR on β-actin (GenBank: E00829) (β-actin forward primer 5′-ACTACCTCATGAAGATCCTC-3′; β-actin reverse primer 5′-CGGATGTCCACGTCACACTTC-3′). The PCR protocol consisted of an initial denaturation step at 94°C for 5 min, followed by 35 amplification cycles. Each cycle involved a denaturation step of 30 s at 94°C, followed by 30 s of primer annealing at 55°C and 30 s of primer extension at 72°C, followed by a final extension of 10 min. Amplicon size was confirmed by electrophoresis using an ethidium bromide-stained 2% agarose gel in 1X TBE buffer.
Real-time quantitative polymerase chain reaction
The primers for the genes examined were designed using Beacon Designer software (Premier Biosoft International, CA, USA). provides the primer sequences. Quantitative PCR was performed using a CFX96 Real-Time System (Bio-Rad, Hercules, CA, USA). SYBR Green PCR Supermix (2X) (Bio-Rad), which detects amplification using Sybr Green as a double-stranded DNA specific fluorescent dye was used. Assays were performed in duplicate and a blank included in every assay. The reaction mixture for amplification comprised 2 µL of cDNA, 0.4 µL of each primer (forward and reverse primers; final concentration 0.1 µM), 10 µL of Sybr Green mix, and sterile water in a final volume of 20 µL. The RT-PCR protocol included an initial step of 95°C (5 min), followed by 45 cycles of 15 s at 94°C for DNA denaturation, 30 s for primer annealing at 60 °C and 1 min at 55.7°C for primer extension. Fluorescence data were acquired at 55.7°C. Melting-curve analysis to confirm product specificity was performed immediately after amplification following 1 min of denaturation at 95°C, 1 min annealing at 65°C, and 60 cycles of 0.5°C increments (30 s each) beginning at 65°C while monitoring fluorescence.
Table 1. Primers of HPRT and clock genes for RT-PCR.
Product identity was confirmed by electrophoresis with ethidium bromide-stained 2% agarose gel in 1X TBE buffer. Hypoxanthine-guanine phosphoribosyltransferase (HPRT) was used as the endogenous control.
Mathematical treatment to the data
The study of the possible rhythm for mRNA clock genes (in terms of the corresponding Relative Gen Expression (RGE)) was designed using Curve fitting using Fourier Series. Fourier Series [Marks Citation2009] decompose periodic functions into the sum of a set of simple oscillating functions (sines and cosines). They are useful to approximate periodic functions. A Fourier series of a function f(x) is defined in general as:
The coefficients a0, ak and bk (k >= 1) are called Fourier coefficients, w is the frequency. The units of these parameters are: cycles/d for w, RGE for ak and bk. In this work Fourier series are used to check the periodicity of the four clock genes. However, as the number of points available to be fitted is not high, we use Fourier series with one harmonic (that means the infinite sum is reduced to only one term in the previous formula). The periodic functions are obtained by Curve fitting toolbox provided by Matlab R2013a [Mathlab Citation2014].
The goodness of the fitted functions is measured in terms of SSE and R2 metrics. SSE stands for sum of squared error. This statistic measures the total deviation of the response values from the fit to the response values. It is defined as:
In this formula yi represents the observed data value,
is the predicted value.
A value closer to 0 indicates that the model has a smaller random error component, and that the fit will be more useful for prediction.
R2 measures how successful the fit is in explaining the variation of the data. R-square can take on any value between 0 and 1, with a value closer to 1 indicating that the model accounts for a greater proportion of variance. For example an R2 value of 0.9 means that the fit explains 90% of the total variation in the data about the average.
If the number of fitted coefficients increases, R2 will increase although the fit may not improve in a practical sense. Thus, a model with more terms may seem to have a better fit just for the fact that it has more terms. In this sense the adjusted R2 indicator, , is generally the best one to measure the fit quality because it only increases if the new term enhances the model above what would be obtained without it. In addition, in case of overfitting condition, an incorrectly high value of R2 can be obtained while this is not the case with the
. Both measures are defined as follows:
SST stands for total sum of squares about the mean. In this case
represents the mean and m is the number of variables in the model.
In this case, taking into account that the model is constructed considering just 6 points, it makes no sense to increase the number of coefficients involved in the fitting. However, to study over-fitting, was also computed, obtaining values above 0.8 for the fitted rhythm of Clock, Bmal1, Cry1, and Per2. In addition, we have also checked the fit with two harmonics, obtaining in this case lower values for
than in case of considering only one harmonic.
| Abbreviations | ||
| BMAL | = | brain and muscle arnt-like protein |
| CLOCK | = | circadian locomoter output cycles kaput |
| CRY | = | cryptochrome protein |
| Dec | = | differentiated embryo-chondrocyte |
| HPRT | = | hypoxanthine-guanine phosphoribosyltransferase |
| PER | = | period protein |
| SCN | = | suprachiasmatic nucleus |
Declaration of interest
The authors report no declarations of interest.
Author contributions
Conceived and designed the experiments: ED, CG. Performed the experiments: SP, LM, CFP. Analyzed the data: ID, LM. Contributed reagents, materials, analysis tools: JO, SP, CFP, CG, ID. Wrote the manuscript: ED, ID, SP. All authors approved revisions and the final paper.
References
- Abe, M., Herzog, E.D., Yamazaki, S., Straume, M., Tei, H., Sakaki, Y., et al. (2002) Circadian rhythms in isolated brain regions. J Neurosci 22:350–356
- Arble, D.M., Bass, J., Laposky, A.D., Vitaterna, M.H. and Turek, F.W. (2009) Circadian timing of food intake contributes to weight gain. Obesity (Silver Spring) 17:2100–2102
- Balsalobre, A., Damiola, F. and Schibler, U. (1998) A serum shock induces circadian gene expression in mammalian tissue culture cells. Cell 93:929–937
- Bildt, C. and Michélsen, H. (2002) Gender differences in the effects from working conditions on mental health: a 4-year follow-up. Int Arch Occup Environ Health 75:252–258
- Boden, M.J. and Kennaway, D.J. (2006) Circadian rhythms and reproduction. Reproduction 132:379–392
- Challis, J.R., Socol, M., Murata, Y., Manning, F.A. and Martin C.B Jr. (1980) Diurnal variations in maternal and fetal steroids in pregnant rhesus monkeys. Endocrinology 106:1283–1288
- Conlon, M., Lightfoot, N. and Kreiger, N. (2007) Rotating shift work and risk of prostate cancer. Epidemiology 18:182–183
- Díaz-Cueto, L., Méndez, J.P., Barrios-de-Tomasi, J., Lee, J.Y., Wide. L., Veldhuis, J.D., et al. (1994) Amplitude regulation of episodic release, in vitro biological to immunological ratio, and median charge of human chorionic gonadotropin in pregnancy. J Clin Endocrinol Metab 78:890–897
- Dibner, C., Schibler, U. and Albrecht, U. (2010) The mammalian circadian timing system: organization and coordination of central and peripheral clocks. Annu Rev Physiol 72:517–549
- Filipski, E., King, V.M., Li, X., Granda, T.G., Mormont, M.C., Claustrat, B., et al. (2003) Disruption of circadian coordination accelerates malignant growth in mice. Pathol Biol (Paris) 51:216–219
- Frigato, E., Lunghi, L., Ferretti, M.E., Biondi, C. and Bertolucci, C. (2009) Evidence for circadian rhythms in human trophoblast cell line that persist in hypoxia. Biochem Biophys Res Commun 378:108–111
- Froy, O. (2010) Metabolism and circadian rhythms—implications for obesity. Endocr Rev 31:1–24
- Gekakis, N., Staknis, D., Nguyen, H.B., Davis, F.C., Wilsbacher, L.D., King, D.P., et al. (1998) Role of the CLOCK protein in the mammalian circadian mechanism. Science 280:1564–1569
- Glattre, E. and Bjerkedal, T. (1983) The 24-hour rhythmicity of birth. A populational study. Acta Obstet Gynecol Scand 62:31–36
- Hastings, M., O’Neill, J.S. and Maywood, E.S. (2007) Circadian clocks: regulators of endocrine and metabolic rhythms. J Endocrinol 195:187–198
- Hida, A., Koike, N., Hirose, M., Hattori, M., Sakaki, Y. and Tei, H. (2000) The human and mouse Period1 genes: five well-conserved E-boxes additively contribute to the enhancement of mPer1 transcription. Genomics 65:224–233
- Horikawa, K., Minami, Y., Iijima, M., Akiyama, M. and Shibata, S. (2005) Rapid damping of food-entrained circadian rhythm of clock gene expression in clock-defective peripheral tissues under fasting conditions. Neuroscience 134:335–343
- Jin, X., Shearman, L.P., Weaver, D.R., Zylka, M.J., de Vries, G.J. and Reppert, S.M. (1999) A molecular mechanism regulating rhythmic output from the suprachiasmatic circadian clock. Cell 96:57–68
- Kennaway, D.J., Boden, M.J. and Varcoe, T.J. (2012) Circadian rhythms and fertility. Mol Cell Endocrinol 349:56–61
- Kennaway, D.J., Boden, M.J. and Voultsios, A. (2004) Reproductive performance in female Clock Δ19 mutant mice. Reprod Fertil Dev 1:801–810
- Kivimäki, M., Virtanen, M., Elovainio, M., Väänänen, A., Keltikangas-Järvinen, L. and Vahtera, J. (2006) Prevalent cardiovascular disease, risk factors and selection out of shift work. Scand J Work Environ Health. 32:204–208
- Kume, K., Zylka, M.J., Sriram, S., Shearman, L.P., Weaver, D.R., Jin, X., et al. (1999) mCRY1 and mCRY2 are essential components of the negative limb of the circadian clock feedback loop. Cell 98:193–205
- Lowrey, P.L. and Takahashi, J.S. (2011) Genetics of circadian rhythms in Mammalian model organisms. Adv Genet 74:175–230
- Marks, R.J. (2009) Handbook of fourier analysis and its applications. Oxford, CT: Oxford University Press
- Mark, P., Wharfe, M.D., Lewis, J.L. and Waddel, B.J. (2011) Circadian variation in placental expression of inflammatory mediators. Proc Soc Reprod Biol 42:44
- Mathlab (2014) Mathlab Documentation for Fourier Series. 1994–2015. The MathWorks, Inc. http://www.mathworks.es/es/help/curvefit/fourier.html. 26 June 2014
- Miller, B.H., Olson, S.L., Turek, F.W., Levine, J.E., Horton, T.H. and Takahashi, J.S. (2004) Circadian clock mutation disrupts estrous cyclicity and maintenance of pregnancy. Curr Biol 14:1367–1373
- Miller, B.H. and Takahashi, J.S. (2014) Central circadian control of female reproductive function. Front Endocrinol (Lausanne) 4:195
- Olcese, J. (2012) Circadian aspects of mammalian parturition: a review. Mol Cell Endocrinol 349:62–67
- Patrick, J., Challis, J., Campbell, K., Carmichael, L., Natale, R. and Richardson B. (1980) Circadian rhythms in maternal plasma cortisol and estriol concentrations at 30 to 31, 34 to 35, and 38 to 39 weeks’ gestational age. Am J Obstet Gynecol 136:325–334
- Plaut, S.M., Grota, L.J., Ader, R. and Graham, C.W. (1970) Effects of handling and the light-dark cycle on time of parturition in the rat. Lab Anim Care 20:447–453
- Ratajczak, C.K., Fay, J.C. and Muglia, L.J. (2010) Preventing preterm birth: the past limitations and new potential of animal models. Dis Model Mech 3:407–414
- Reiter, R.J., Tan, D.X., Korkmaz, A. and Rosales-Corral, S.A. (2014) Melatonin and stable circadian rhythms optimize maternal, placental and fetal physiology. Hum Reprod Update 20:293–307
- Rusak, B. and Zucker, I. (1979) Neural regulation of circadian rhythms. Physiol Rev 59:449–526
- Schrader, J.A., Nunez, A.A. and Smale, L. (2010) Changes in and dorsal to the rat suprachiasmatic nucleus during early pregnancy. Neuroscience 171:513–523
- Schrader, J.A., Nunez, A.A. and Smale, L. (2011) Site-specific changes in brain extra-SCN oscillators during early pregnancy in the rat. J Biol Rhythms 26:363–267
- Serón-Ferré, M., Ducsay, C.A. and Valenzuela, G.J. (1993) Circadian rhythms during pregnancy. Endocr Rev 14:594–609
- Simonneaux V., Poirel V.J., Garidou M.L., Nguyen D., Díaz E. and Pevet P. (2004) Daily rhythm and regulation of clock gene expression in the rat pineal gland. Mol Brain Res 120:164–172
- Urlep, Z. and Rozman, D. (2013) The Interplay between Circadian System, Cholesterol Synthesis, and Steroidogenesis Affects Various Aspects of Female Reproduction. Front Endocrinol (Lausanne) 4:111
- Vatish, M., Steer, P.J., Blanks, A.M., Hon, M. and Thornton, S. (2010) Diurnal variation is lost in preterm deliveries before 28 weeks of gestation. BJOG 117:765–767
- Wharfe, M.D., Mark, P.J. and Waddell, B.J. (2011) Circadian variation in placental and hepatic clock genes in rat pregnancy. Endocrinology 152:3552–3560
- Yamazaki, S., Numano, R., Abe, M., Hida, A., Takahashi, R., Ueda, M., et al. (2000) Resetting central and peripheral circadian oscillators in transgenis rats. Science 288:682–685