Abstract
The aim of this study is to label the cells with polymeric nanoparticles properly and efficiently. For this purpose, acridine orange (AO)-loaded poly(2-hydroxyethyl methacrylate) (PHEMA) nanoparticles were synthesized by miniemulsion polymerization. PHEMA nanoparticles were characterized by zeta sizer, zeta potential, atomic force microscopy (AFM), scanning electron microscopy (SEM), transmission electron microscopy (TEM), fluorescence microscopy, Fourier transform infrared spectrophotometer (FTIR), and elemental analysis. In addition, the toxicity of the nanoparticles were investigated by MTT [3-(4,5-dimethylthiazol-2-yl)-2,5-diphenyltetrazolium bromide] assay.
Introduction
Fluorescence imaging has many superiorities compared to other technologies such as radio isotope labeling, magnetic resonance imaging (MRI), electron spin resonance (ESR) spectroscopy and electrochemical detection. It enables highly sensitive, less-invasive and safe detection using readily available instruments (Nagano Citation2010, Hogemann and Basilion Citation2002, Pomper and Hammoud Citation2004, Vonesch et al. Citation2006, Mankoff et al. Citation2005, Massignani et al. Citation2010, Mankoff Citation2008). Fluorescent dyes can be used in different signalling, imaging and sensing processes of interest or molecular events. For this purpose, being stable in extreme environmental conditions, small enough to ensure an excellent biocompatibility with the surrounding and highly fluorescent are the properties desired from the fluorophore. However, the surrounding environment such as extreme acid/basic conditions could damage the dye causing a decrease of dye sensing or dye aggregation quenching of the fluorescence signal (López Arbeloa et al. Citation2001).
Fluorescent labels, especially fluorescing nanoparticles, show better optical properties (an enhanced photostability and a larger Stokes shift) than conventional organic fluorophores and have a better localization within a tissue or a cell compared to a molecular dissolved dye. Fluorescent labeling is used to allow the definition of nanoparticles in a cell culture or a tissue because their intracellular localization provides important information about the biological effects (Sokolova and Epple Citation2011, Wang et al. Citation2006, Verma and Stellacci Citation2010, Richardson et al. Citation2008, Panyama et al. Citation2003).
The researches focus on different applications of nano- and micron-size particles such as drug targeting (Kılıçay et al. Citation2011), gene therapy (Bellocq et al. Citation2003), disease diagnosis (Tkachenko et al. Citation2003), apoptosis (Kim et al. Citation2006), bio-imaging (Sharma et al. Citation2006), cellular interaction (Çakmak et al. 2009) and cell labeling (Bhirde et al. Citation2011). It is a crucial issue to track stem and progenitor cells in a noninvasive manner to better understand the distribution and fate of transplanted cells for a effective therapy in central nervous system-related disease (spinal cord injury, Parkinson's disease) and myocardial regeneration (Bhirde et al. Citation2011, Idris et al. Citation2009, Bulte and Kraitchman Citation2004, Marin-Garcia and Goldenthal Citation2006).
In the literature, various polymeric nanoparticles synthesized by miniemulsion process are available for cell labeling. Nanoparticles made of nondegradable polymers are based on functionalized polystyrene nanoparticles (Mailander et al. Citation2008, Lorenz et al. Citation2006), polyizoprene nanoparticles (Lorenz et al. Citation2008), poly(methyl methacrylate) (Jagielski et al. Citation2007), while nanoparticles made of biodegradable polymers are based on poly(alkylcyanoacrylate) (PACA) (Weiss et al. Citation2007), poly(ϵ-capro-lactone) (PCL), poly(D, L-lactide) (PLLA) and poly(D,L-lactide-co-glycolide) (PLGA) (Musyanovych et al. Citation2008).
Polymeric nanoparticles have the advantage of an increased colloidal stability, a better chemical resistance and an easier formation compared to other nanoparticulate systems, such as liposomes and micelles. Therefore, drugs and markers encapsulated inside nanoparticles can be efficiently protected against enzymatic and hydolytic degradation (Landfester et al. Citation2010, Chouhan and Bajpai Citation2010).
In this study, PHEMA was chosen as a polymer due to its well-known biocompatibility (Montheard et al. Citation1992), hydrophilicity and lack of toxicity (Chouhan and Bajpai Citation2010). Also, 2-hydroxyethyl methacrylate (HEMA) is a well-known vinyl monomer and one of the most suitable material for optical lens (Tranoudis and Efron Citation2004) and ocular implants (Lloyd et al. Citation2001). In addition, different applications of HEMA such as dental material (Lim et al. Citation2009), scaffold for tissue engineering (Horák et al. Citation2004), an agent to promote nerve regeneration (Belkas et al. Citation2005) and affinity purification (Doğan et al. Citation2012, Perçin et al. Citation2012) were performed.
In this paper, we present the preparation of fluorescent dye-labeled PHEMA nanoparticles. The PHEMA nanoparticles synthesized by miniemulsion polymerization are labeled with acridine orange, a fluorescent dye having anticancer, antiparasite and antibacterial properties, in order to make them visible by fluoresence microscope. Then, these nanoparticles and cells interactions are tested on L929 cell line in vitro.
Experimental
Materials
Hydroxyethyl methacrylate (HEMA, 99%), ethylene glycol dimethacrylate (EGDMA, 98%) and acridine orange were obtained from Sigma (St Louis, USA) and stored at 4°C until use. Sodium dodecyl sulfate (SDS) (98.5%), sodium bicarbonate (99.7–100.3%), sodium bisulfite (99%), ammonium persulfate (APS, 98%) and poly(vinyl alcohol) PVA (98% hydrolyzed, MW 100.000) were purchased from Aldrich (ABD). All chemicals were used directly without further purification. All water used in the experiments was purified using a Barnstead (Dubuque, IA) ROpure LP® reverse osmosis unit with a high flow cellulose acetate membrane (Barnstead D2731) followed by a Barnstead D3804 NANOpure® organic/colloid removal and ion exchange packed-bed system.
Preparation of AO-loaded PHEMA nanoparticles
Miniemulsion polymerization was carried out according to the literature procedure with minor modifications as reported elsewhere (Horák et al. Citation2004). Briefly, the stabilizer, PVA (0.375 g), SDS (57.7 mg) and sodium bicarbonate (46.9 mg) were dissolved in 20 mL of deionized (DI) water to form the first aqueous phase. PVA (0.2 g) and SDS (0.2 g) were dissolved in 400 mL of DI water to form the second equeous phase. HEMA (0.8 mL), EGDMA (4.2 mL) and Acridine Orange (5 mg) were then mixed to form the oil phase. The monomer phase was slowly added into the first aqueous solution, followed by homogenization at 24,000 rpm with a homogenizer (T25B, Ika Labortechnik, Germany) to form a miniemulsion. The miniemulsion was then added into the second aqueous phase under stirring and transferred into a 1 L three-neck round-bottomed flask. The flask was mechanically stirred (RW20, Ika Labortechnik, Germany) at 500 rpm and slowly heated. After the prepolymerization mixture had reached 40°C, the reaction vessel was prepurged with nitrogen gas for 15 min to displace the oxygen, and finally, sodium bisulfite (0.230 g), followed by APS (0.252 g), was added into the mixture for polymerization for 24 h. The polymer product was washed several times with deionized water and ethanol to remove the surfactant or any unreacted monomer and initiator. For each washing step, the solution was centrifuged (Beckman Coulter, Allegra 64R Centrifugen, U.S.A.) at 26000 rpm for 1 h to isolate the polymeric product from the washing medium.
Characterization of AO-loaded PHEMA nanoparticles
Particle size and size distribution were determined by Zeta Sizer (3000 HSA, Malvern, England). A dilute suspension (100 μg/mL) of nanoparticles was prepared in distilled water and sonicated for 30 s to measure particle size.
Zeta potential of nanoparticles in 0.1 M phosphate-buffered saline with pH of 7.0 (0.5 mg/mL) was determined using Nano Zetasizer (NanoS, Malvern Instruments, London, England).
AO-loaded PHEMA nanoparticles were characterized by using scanning electron microscope (SEM, Phillips, XL-30S FEG, Germany) to estimate their shape and level of aggregation. A drop of suspension was placed on a graphite surface and let dry at room temperature. The sample was then coated by a thin gold layer (5–10 nm) before observation.
A drop of nanoparticle suspension (1 mg/mL) was placed on carbon-coated copper grids and air dried. The sample was visualized using transmission electron microscope (FEI, Tecnai G2 F30, Oregon, USA).
AO-loaded PHEMA nanoparticles in the cells were fixed in 2.5% glutaraldehyde in Sorenson's phosphate buffer overnight, and washed in PBS and postfixed in 1% osmium tetroxide in PBS at 4°C for 2 h. Samples were dehydrated in graded series of ethanol solutions to absolute ethanol and block stained with uranyl acetate and embedded in Epon. Ultra thin sections (70 nm) were contrasted with lead citrate and observed by Geol transmission electron microscope.
AFM observations were carried out by using AFM (Nanomagnetics Instruments, Oxford, UK) in tapping mode, at room temperature. A silicon cantilever (Buggetsensor Tap300-G model) was used with a tip having radius less than 10 nm. Scanning was performed at a scan rate of 1 Hz and scan size was 2.00 μm.
To evaluate the amount of acridine orange, an elemental analysis instrument (Leco, CHNS-932, USA) was used. The amount of acridine orange on the nanoparticles was calculated from this data by considering the nitrogen and sulfur stoichiometries.
FTIR spectra of PHEMA nanopaticles, acridine orange, and AO-loaded PHEMA nanoparticles were obtained by using an FTIR spectrophotometer (FTIR 8000 Series, Shimadzu, Japan). The dry nanoparticles (about 0.1 g) were completely mixed with potassium bromide (0.1 g, IR grade, Merck, Germany) and prepared as a pellet before recording the FTIR spectrum.
Nanoparticle uptake by L929 cells: fluoresence microscopy
L929 fibroblastic cell line was seeded in 6-well plates (30,000 cells/mL) and grown in an atmosphere of 5% CO2 using Dulbecco's Modified Eagle Medium/Ham's F12 (DMEM/F12) (Biochrom AG, Germany) supplemented with 10% fetal calf serum (FCS), penicillin (100 U/mL) and streptomycin (100 μg/mL) at 37°C for 24 h.
L929 cells were incubated with AO-loaded nanoparticles (concentration; 30 μg/mL) for 24 h at 37°C, and then washed twice with PBS buffer to remove excess nanoparticles and/or free dye before fluorescence microscopy (Olympus IX70, Japan) observation. Untreated cells served as controls (n = 6).
Cell viability assay
The effect of AO-loaded PHEMA nanoparticles on cell viability was appraised by MTT assay, based on the reduction of the number of metabolically active cells, and the results were expressed as percentage of the controls. L929 fibroblast cells were seeded into a 96-well plate with a inoculation density of 10,000 cells/mL. After 24 h incubation period, the culture medium was replaced with several concentrations (10 μg/mL, 30 μg/mL, 60 μg/mL) of AO-loaded PHEMA nanoparticles, PHEMA nanoparticles and free dye sterilized with autoclave. During 3 days, MTT test was performed for quantitative analysis. In short, each day culture medium had been removed before 10% MTT solution was added to each well to dissolve formazan crystals and incubated at 37°C for 4 h. Following the incubation, 100 μL of isopropyl alcohol was added to each well and the absorbance of each was measured in a microplate reader at 570 nm. The results were expressed as percentage of the controls.
Results and discussion
Characterization of AO-loaded PHEMA nanoparticles
Miniemulsion polymerization is a process providing monodispersed, regularly shaped nanoparticles size ranged from 50 to 500 nm. The necessity of a high-shearing homogenization step and a cosurfactant differs it from conventional emulsion polymerization. In addition, this process is suitable for large-scale commercial production with excellent heat dispersion (Tan et al. Citation2008). Particle size and size distribution are one of the most important issues of nanoparticles that effect the intracellular uptake of nanoparticles. Nanoparticles of a few nanometers, may reach well inside cells, while it is not possible for larger particles (Chouhan and Bajpai Citation2010, Gaumet et al. Citation2007).
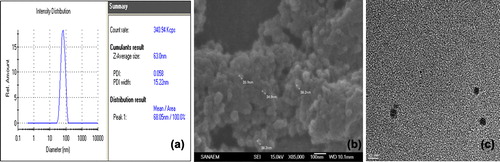
The average size of AO-loaded PHEMA nanoparticles obtained by Zeta Sizer was about 63 nm and the apparent particle size ranged from 40 to 150 nm with a polydispersity index (PDI) of 0.058 and the zeta potential of AO-loaded PHEMA nanoparticles was + 2.1 mV at pH 7.0.
SEM image revealed that AO-loaded PHEMA nanoparticles are spherical, as shown by TEM, but the size of them was not uniform. Size distribution, SEM and TEM image of AO-loaded PHEMA nanoparticles were shown in .
Figure 1. a) Size analysis, b) SEM and c) TEM images of AO-loaded nanoparticles.
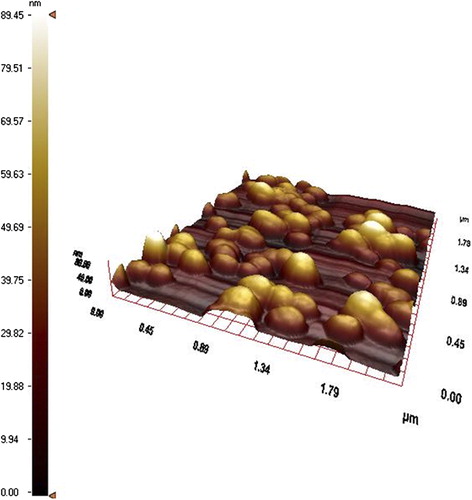
The size of the nanoparticles were also determined by AFM in . AFM image confirms that the maximum particle size is about 90 nm. The AO-loaded PHEMA nanoparticle size results reinforce each. Hydrophilic structure of PHEMA causes a larger size in aqueous medium. According to elemental analysis, the amount of dye loading was 16.4 μg/g nanoparticles.
Figure 2. AFM image of AO-loaded PHEMA nanoparticles.
FTIR spectra of PHEMA nanoparticles, acridine orange, and AO-loaded PHEMA nanoparticles are shown in a–c, severally, which clearly confirms the presence of HEMA and AO in cross-linked nanoparticles. The FTIR spectra of PHEMA nanoparticles (c) and AO-loaded nanoparticles (b) clearly mark the presence of HEMA as evident from the observed bands at 1730 cm− 1 (C = O streching), 1165 cm− 1 (O–C–C streching), 3450 cm− 1 (O–H streching), 2957 cm− 1 (asymmetric streching of methylene group) and 1455 cm− 1 (O–H bending), severally.
Figure 3. FTIR spectra of a) AO, b) AO-loaded PHEMA nanoparticles c) PHEMA nanoparticles.
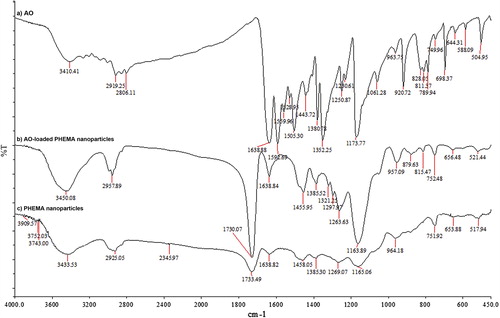
The spectra (b) mark of the dye (AO) as evident from the observed bands at 789 cm− 1, 811 cm− 1 ve 828 cm− 1 (out-of-plane deformation vibrations of C–H bonds in aromatic molecules). The peaks observed in the spectrum of AO (a) resembles the peaks showing the presence of dye in the spectrum of AO-loaded nanoparticles (b). So, the presence of dye in the loaded nanoparticles is confirmed.
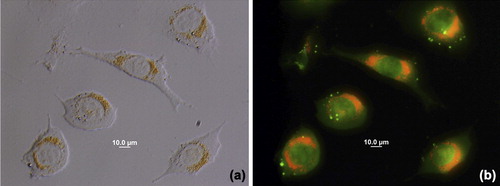
L929 fibroblast cells grew as monolayer after incubation with the AO-loaded nanoparticles for 24 h. Fluoresence microscopy indicated that cells were labelled with AO-loaded nanoparticles ().
Figure 4. Fluoresence microscopy images of L929 cells. a) Transmission and b) fluoresence after 24 h incubation at 37°C with AO-loaded PHEMA nanoparticles. Different labeling of cell membranes or compartments can be noticed indicating the release of the AO has occured from polymeric nanoparticles.
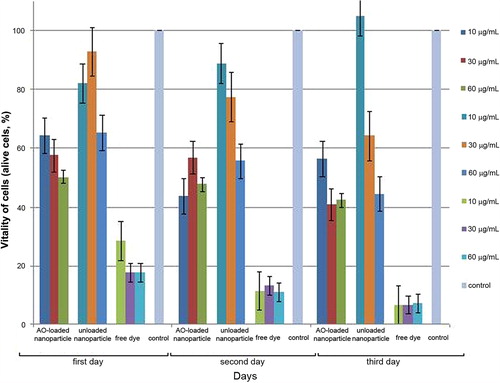
We performed the AO-loaded PHEMA nanoparticle, PHEMA nanoparticle and free dye on L929 cell line at three different concentrations (10, 30, and 60 μg/mL) and quantified the vitality of cells by MTT assay during 3 days. As it was expected, the AO-loaded PHEMA nanoparticles have a higher toxic effect on cells compared to unloaded nanoparticles because of the dye lethality. When the higher concentration of AO-loaded nanoparticle solution is treated, more cells are died. Comparatively, the cells treated with free dye have a very toxic effect at the same concentration. Also, the AO-loaded PHEMA nanoparticles do not exhibite any dark toxicity, as shown in . As evident from MTT assay, AO-loaded PHEMA nanoparticles in the concentration of 10–60 μg/mL have no adverse effect on the cell viability but alive cells decreased with increasing nanoparticle dose and incubation time.
Figure 5. The effect of AO-loaded PHEMA nanoparticle concentration on the cell viability of L929 mouse fibroblast cells.
Providing a quantitative measurement of cellular uptake with TEM method is impossible, but it can demonstrate the distribution of nanoparticles on a cellular and subcellular level.
TEM confirmed that the AO-loaded PHEMA nanoparticles localized in the cell compartments resembling nucleus (). TEM images clearly indicated the nanoparticle clusters. The most likely explanation is that proteins arising from the medium adsorbed on the nanoparticle surface causing an interaction among them.
Figure 6. TEM images of L929 cells incubated for 24 h with AO-loaded PHEMA nanoparticles showing coagulation of nanoparticles in cell compartments at an accelerating voltage of 120 kV (a, c, d). L929 cells just as control is seen in b).
Discussion
Various physical methods can be used for characterization of nanoparticles, but especially in biological systems their imaging and monitoring are primary importance. Hence, fluorescence microscopy and TEM may provide valuable information regarding interactions between nanoparticles and cells. It has been observed nanoparticles localized mainly in the nucleus of L929 cells and did not effect the cell viability for 72 h. Due to their ability to penetrate cell membrane and distribute into the cytoplasma/nucleus, they could be used as a drug delivery system. As regards acridine orange is a pH-sensitive dye, it could be easily effected from the microenvironment. Polymeric nanoparticles prevented their fluoresence emissions altering and very low degradability of polymer in cellular medium was a desired feature for long-term cell culture experiments.
Acknowledgement
I. Göktürk thanks Prof. Dr. Petek KORKUSUZ from Hacettepe University, Faculty of Medicine, Department of Histology and Embryology for her valuable experience about TEM images.
Declaration of interest
The authors report no declarations of interest. The authors alone are responsible for the content and writing of the paper.
References
- Belkas JS, Munro CA, Shoichet MS, Johnston M, Midha R. 2005. Long-term in vivo biomechanical properties and biocompatibility of poly(2-hydroxyethyl methacrylate-co-methyl methacrylate) nerve conduits. Biomaterials. 26:1741–1749.
- Bellocq NC, Pun SH, Jensen GS, Davis ME. 2003. Transferrin- containing, cyclodextrin polymer-based particles for tumor-targeted gene delivery. Bioconjugate Chem. 14:1122–1132.
- Bhirde A, Xie J, Swierczewska M, Chen X. 2011. Nanoparticles for cell labeling. Nanoscale. 3:142–153.
- Bulte JWM, Kraitchman DL. 2004. Monitoring cell therapy using iron oxide MR contrast agent. Curr Pharm Biotechnol. 5:567–584.
- Chouhan R, Bajpai AK. 2010. Release dynamics of ciprofloxacin from swellable nanocarriers of poly(2-hydroxyethyl methacrylate): an in vitro study. Nanomed-Nanotechnol. 6:453–462.
- Çakmak S, Gümüşderelioğlu M, Denizli A. 2009. Biofunctionalization of magnetic poly(glycidyl methacrylate) microspheres with protein A: characterization and cellular interactions. React Funct Polym. 69:586–593.
- Doğan A, Özkara S, Sarı MM, Uzun L, Denizli A. 2012. Evaluation of human interferon adsorption performance of Cibacron Blue F3GA attached cryogels and interferon purification by using FPLC system. J Chromatogr B. 893–894:69–76.
- Gaumet M, Gurny R, Delie F. 2007. Fluorescent biodegradable PLGA particles with narrow size distributions: preparation by means of selective centrifugation. Int J Pharm. 342:222–230.
- Hogemann D, Basilion JP. 2002. “Seeing inside the body”: MR imaging of gene expression. Eur J Nucl Med Mol Imaging. 29: 400–408.
- Horák D, Kroupová J, Šlouf M, Dvořák P. 2004. Poly(2-hydroxyethyl methacrylate)-based slabs as a mouse embryonic stem cell support. Biomaterials. 25:5249–5260.
- Idris NM, Li Z, Ye L, Sim EKW, Mahendran R, Chi-Lui Hod P, Zhang Y. 2009. Tracking transplanted cells in live animal using upconversion fluorescent nanoparticles. Biomaterials. 30:5104–5113.
- Jagielski N, Sharma S, Hombach V, Mailander V, Rasche V, Landfester K. 2007. Nanocapsules synthesized by miniemulsion technique for application as new contrast agent materials. Macromol Chem Phys. 208:2229–2241.
- Kılıçay E, Demirbilek M, Türk M, Güven E, Hazer B, Denkbas EB. 2011. Preparation and characterization of poly(3-hydroxybutyrate-co-3-hydroxyhexanoate) (PHBHHX) based nanoparticles for targeted cancer therapy. Eur J Pharm Sci. 44:310–320.
- Kim K, Lee M, Park H, Kim JH, Kim S, Chung H, . 2006. Cell- permeable and biocompatible polymeric nanoparticles for apoptosis imaging. J Am Chem Soc. 128: 3490–3491.
- Landfester K, Musyanovych A, Mailander V. 2010. From polymeric particles to multifunctional nanocapsules for biomedical applications using the miniemulsion process. J Polym Sci Part A Polym Chem. 48:493–515.
- Lim HN, Yu B, Lim JI, Ahn JS, Lee YK. 2009. Influence of 2- hydroxyethyl methacrylate content on the optical properties of experimental 2-hydroxyethyl methacrylate-added dental glass ionomer. Mater Des. 30:3996–4002.
- Lloyd AW, Faragher RGA, Denyer SP 2001. Ocular biomaterials and implants. Biomaterials. 22:269–785.
- López Arbeloa F, Arbeloa T, López Arbeloa I. 2001. Photophysical properties of laser dyes: correlations with the lasing characteristics. In: H.R. Nalwa, Ed. Handbook of Advanced Electronic and Photonic Materials and Devices, vol. 7. San Diego: Academic Press, pp. 209–246.
- Lorenz MR, Holzapfel V, Musyanovych A, Nothelfer K, Walther P, Frank H, . 2006. Uptake of functionalized, fluorescent-labeled polymeric particles in different cell lines and stem cells. Biomaterials. 27:2820–2828.
- Lorenz MR, Kohnle MV, Dass M, Walther P, Hocherl A, Ziener U, . 2008. Synthesis of fluorescent polyisoprene nanoparticles and their uptake into various cells. Macromol Biosci. 8:711–727.
- Mailander V, Lorenz MR, Holzapfel V, Musyanovych A, Fuchs K, Wiesneth M, . 2008. Mol Imaging Biol. 10:138–146.
- Mankoff AD. 2008. Molecular imaging as a tool for translating breast cancer science.Breast Cancer Research. 10(Suppl 1):S3.
- Mankoff DA, Shields AF, Krohn KA. 2005. PET imaging of cellular proliferation. Radiol Clin North Am. 43:153–167.
- Marin-Garcia J, Goldenthal MJ. 2006. Application of stem cells in cardiology: where we are and where we are going. Curr Stem Cell Res Ther. 1:1–11.
- Massignani M, Canton I, Sun T, Hearnden V, MacNeil S, Blanazs A. . 2010. Enhanced fluorescence imaging of live cells by effective cytosolic delivery of probes. PLoS ONE 5:e10459.
- Montheard JP, Chatzopoulos M, Chappard D. 1992. 2-Hydroxyethyl Methacrylate (HEMA): Chemical Properties and Applications in Biomedical Fields. J. Macromol. Sci., Polym. Rev. 32: 1–34.
- Musyanovych A, Schmitz-Wienke J, Mailander V, Walther P, Landfester K. 2008. Preparation of biodegradable polymer nanoparticles by miniemulsion technique and their cell interactions. Macromol Biosci. 8:127–139.
- Nagano T. 2010. Development of fluorescent probes for bioimaging applications. Proc Jpn Acad Ser B. 86:837–847.
- Panyama J, Sahooa SK, Prabhaa S, Bargar T, Labhasetwar V. 2003. Fluorescence and electron microscopy probes for cellular and tissue uptake of poly(d,l-lactide-co-glycolide) nanoparticles. Int J Pharm. 262:1–11.
- Perçin I, Karakoç V, Akgöl S, Aksöz E, Denizli A. 2012. Poly(hydroxyethyl methacrylate) based magnetic nanoparticles for plasmid DNA purification from Escherichia coli lysate. Mater Sci Eng C. 32: 1133–1140.
- Pomper G, Hammoud DA. 2004. Positron emission tomography in molecular imaging. IEEE Eng Med Biol Mag. 23:28–37.
- Richardson SCW, Wallom KL, Ferguson EL, Deacon SPE, Davies MW, Powell AJ, . 2008. The use of fluorescence microscopy to define polymer localisation to the late endocytic compartments in cells that are targets for drug delivery. J Control Release 127:1–11.
- Sharma P, Brown S, Walter G, Santra S, Moudgil B. 2006. Nanoparticles for bioimaging. Adv Colloid Interface Sci. 123–126:471–485.
- Sokolova V, Epple M. 2011. Synthetic pathways to make nanoparticles fluorescent. Nanoscale. 3:1957–1962.
- Tan CJ, Wangrangsimakul S, Bai R, Tong YW. 2008. Defining the interactions between proteins and surfactants for nanoparticle surface imprinting through miniemulsion polymerization. Chem Mater. 20:118–127.
- Tkachenko AG, Xie H, Coleman D, Glomm W, Ryan J, Anderson MF, . 2003. Multifunctional gold nanoparticle-peptide complexes for nuclear targeting. J Am Chem Soc. 125:4700–4701.
- Tranoudis I, Efron N. 2004. Water properties of soft contact lens materials. Cont Lens Anterior Eye. 27:193–208.
- Verma A, Stellacci F. 2010. Effect of surface properties on nanoparticle–cell interactions. Small. 6:12–21.
- Vonesch C, Aguet F, Vonesch JL, Unser M. 2006. An introduction to fluorescence microscopy. IEEE Signal Process Mag. 23:20–31.
- Wang F, Tan WB, Zhang Y, Fan XP, Wang MQ. 2006. Luminescent nanomaterials for biological labelling. Nanotechnology. 17: R1–R13.
- Weiss CK, Lorenz MR, Landfester K, Mailander V. 2007. Cellular uptake behavior of unfunctionalized and functionalized PBCA particles prepared in a miniemulsion. Macromol Biosci. 7:883–896.