
Abstract
Context: Gabapentin follows saturation kinetics for absorption because of carrier-mediated transport and narrow absorption window in stomach. There is need to develop a gastroretentive formulation to maximize the absorption without crossing the saturation threshold for absorption. Objective: The aim was to develop a gastroretentive formulation of gabapentin to increase the fraction of drug absorbed in stomach. Materials and methods: Sodium alginate and sodium carboxymethylcellulose were used to formulate the microsphere by ionotropic gelation with calcium chloride. The formulation was optimized using a three-factor, three-level Box–Behnken design. Results: The particle size varied from 559.50 to 801.10 μm, entrapment efficiency from 61.29 to 81.00% and in vitro release from 69.40 to 83.70%. The optimized formulation was found using point-prediction, and formulation OF-3 showed optimum results at 608.21 μm size, 79.65% entrapment efficiency and 82.72% drug release and 81% mucoadhesion up to 10 h. The drug release was controlled for more than 12 h. Discussion: The particle size was most influenced by sodium alginate while entrapment efficiency and drug release depended upon both polymers. The release followed Higuchi model. Conclusion: Gastroretentive formulation was successfully optimized by a three-factor, three-level Box–Behnken design and found to be useful.
Introduction
Oral drug delivery systems are the most popular drug delivery system due to ease of administration and flexibility in formulation, but these systems have some limitations such as patient incompliance due to frequent drug administration, undesirable side effects due to fluctuating plasma drug levels, inability to maintain adequate drug concentration in plasma for therapeutic effect and higher than required dose (Baumgratner et al. Citation2000, Pawar et al. Citation2012). These limitations can be overcome by modifying existing drug delivery systems (DDSs) to design a sustained release (SR) or controlled release (CR) DDS (Khan Citation2001). Since last three decades, oral CR dosage forms have been designed to act as drug reservoirs for the release of drugs over a defined period of time at a controlled rate (Hoffman Citation1998). However, this approach has not been suitable for drugs, characterized by a narrow absorption window in the stomach. This is due to the relatively short transit time of the dosage form in these anatomical segments. Thus, after only a short period of less than 2–3 h, the CR dosage form already leaves the absorption site and the drug is then released in non-absorbing distal segments of the gastrointestinal tract. This results in a short absorption phase that is often accompanied by lesser bioavailability (Hwang and Park Citation1998). It was suggested that preparing narrow absorption window drugs in gastroretentive dosage forms would enable an extended absorption phase of these drugs and a simultaneous increase in bioavailability (Hoffman and Stepensky Citation1999).
Gastroretentive drug delivery systems have been divided into four categories namely (i) floating systems, (ii) expandable systems, (iii) bioadhesive systems, and (iv) high-density systems (Pawar et al. Citation2012). Mucoadhesive systems involve the use of bioadhesive polymers which can adhere to the epithelial surface in the stomach, to localize a delivery device within the lumen to enhance the drug absorption in a site-specific manner (Tao et al. Citation2009). This approach involves the use of bioadhesive polymers functioning by different mechanisms (Gavin et al. Citation2009). Materials commonly used for mucoadhesion are poly (acrylic acid) (carbopol and polycarbophil), chitosan, cholestyramine, tragacanth, sodium alginate, HPMC, sephadex, sucralfate, polyethylene glycol, dextran, poly(alkyl cyanoacrylate), and polylactic acid (Bordonart et al. Citation2006).
Response surface methodology (RSM) is an approach to produce and process optimization work (Myers et al. Citation2004). RSM was introduced by Box and Wilson in 1951, and later popularized by Montgomery. As per the introducer of the idea, response surface methodology can be defined as an empirical statistical technique employed for multiple regression analysis using quantitative data obtained from properly designed experiments to solve multivariate equations simultaneously. The graphical representations of these equations are called response surfaces, which can be used to describe the individual and cumulative effect of the test variables on the response and to determine the mutual interactions between the test variables and their subsequent effect on the response (Mudahar et al. Citation1989). It consists of a combination of statistical experimental design fundamentals, regression modelling techniques, and optimization methods (Montgomery Citation2005, Draper and Lin Citation1996, Allen and Yu Citation2000).
RSM uses design of experiments techniques (DOE), such as Box–Behnken design (BBD), central composite design (CCD), full and fractional factorial designs, as well as regression analysis methods. DOE techniques are employed before, during and after the regression analysis to evaluate the accuracy of the model. Design of experiments (DOE) is a statistical technique that can be used for optimizing such multivariable systems. In recent years, the pharmaceutical industry has used experimental designs more for the optimization of pharmaceutical agents; however, only a few are reported in the literature for the development of dosage forms (Rotthäuser et al. Citation1998, Nazzal et al. Citation2002).
It is often desirable to use the smallest number of factor levels in an experimental design. One common class of such designs is the Box–Behnken designs. These are formed by combining two factorials with balanced incomplete block designs, which reduces the number of experiments considerably (Box and Behnken Citation1960). As an example, for a three-factor, three-level study, only 15 experiments are required with this design, whereas the full factorial design would require 27 experiments. The design consists of replicated centre points and the set of points lying at the midpoints of each edge of the multidimensional cube that defines the region of interest. Besides, Box–Behnken design is suitable for the exploration of quadratic response surfaces and construction of a second-order polynomial model (Box and Draper Citation1987).
Gabapentin is a cyclic GABA analogue used for epilepsy treatment. Gabapentin has been found effective against simple and complex partial seizures, and it is a first-line drug for diabetic neuropathy (Tripathi Citation2008). Gabapentin is absorbed through absorption window at duodenum via carrier-mediated transport pathway, but in case of conventional formulation, the gastric retention time is very short and most of the drug eliminated as such. The bioavailability of Gabapentin decreases as the dose increases so much, so that a 300-mg dose has a bioavailability of 60% and a 600-mg dose has a bioavailability of 42% due to the saturation of carrier (Barry et al. Citation1998, Barry et al. Citation2000). In the case of gastroretentive mucoadhesive multiunit system, the gastric retention time of formulation can be prolonged, and using rate-controlling polymer, release of drug can be controlled so that saturation of carrier can be protected and bioavailability of drug can be enhanced.
In the present study, we have developed a gastroretentive mucoadhesive multiunit system of antiepileptic, a narrow absorption window drug Gabapentin to increase the bioavailability, and patient compliance using process optimization software. A three-factor, three-level Box–Behnken design was applied to the formulation for designing and selecting the optimum formulation. The formulations were prepared using ionotropic gelation method, and evaluated for size, entrapment efficiency, in vitro drug release and mucoadhesion.
Materials and methods
Materials
Gabapentin was a kind gift sample from Synokem labs, Haridwar, UP (India), whereas sodium alginate, sodium carboxymethylcellulose, and calcium chloride were from CDH Chemicals, New Delhi (India). All other reagents were of analytical grade.
Preliminary trials
Microsphere formulations were prepared by varying the concentration of polymers and cross-linking agent in different ratio based on the earlier observation reported elsewhere. Lower concentration of sodium alginate resulted in less viscous gel and smaller particle size of microspheres, whereas higher concentration of calcium chloride increased the drug entrapment efficiency (Chowdary and Rao Citation2003b, Prajapati et al. Citation2008, Gonza´lez-Rodrı´guez et al. Citation2002).
Preparation of formulation
Sodium alginate and sodium carboxymethylcellulose were dispersed in purified water, and Gabapentin was added to the dispersion and stirred well to form viscous dispersion. The resulting dispersion was added to calcium chloride using a 0.45-mm-diameter needle with continuous stirring on a magnetic stirrer. The droplets were retained in solution for 20–25 min for rigidity of droplet. The microsphere were filtered, collected and dried in an oven (Chowdary and Rao Citation2003a). The formulations were prepared using Box–Behnken experimental design, and optimized formulation was generated using statistical screening. Seventeen runs of the experiment were evaluated for particle size, surface morphology, drug entrapment efficiency, in vitro drug release and in vitro mucoadhesion.
Experimental design
A three-factor, three-level design is suitable for exploring quadratic response surfaces and for constructing second-order polynomial models with Design Expert® (version7.1.3, Stat-Ease Inc., Minneapolis, Minnesota). The independent and dependent variables are listed in along with their low, medium and high levels. The polynomial equation generated by this experimental design is given as-
where Yo is the dependent variable, corresponding to either particle size (Y1) or drug entrapment efficiency (Y2) or in vitro drug release (Y3), and A, B and C are the independent variables representing sodium alginate, sodium carboxymethyl cellulose and calcium chloride concentrations, respectively. b0 is a constant; b1, b2 and b3 are the coefficients translating the linear weight of A, B and C, respectively; b12, b13 and b23 are the coefficients translating the interactions between the variables; and b11, b22 and b33 of the coefficients translating the quadratic influence of A, B and C. Linear and second-order polynomials were fitted to the experimental data to obtain the regression equations, and their observed and predicted responses are given in .
Table I. Levels of process variables used in experiments.
Table II. Experimental strategy of Box–Behnken design with coded values of process variables along with the observed value and predicted value of responses.
Surface morphology and particle size characterization
The shape and surface morphology of the microspheres were investigated using a scanning electron microscope (JEOL JSM-5800 Tokyo, Japan) at 20 kV. The sizes of the microspheres were determined using an optical microscope (Olympus, Japan) fitted with an ocular micrometer. The ocular micrometer was calibrated with a stage micrometer. A total of 100 microspheres were evaluated, and the mean diameter was reported.
Drug entrapment efficiency
The drug content of the mucoadhesive microspheres was estimated by dissolving the microspheres in a small amount of suitable solvent in a volumetric flask and by extracting the drug into 0.1N HCl by hourly shaking for 24 h. After 24 h, the solution was filtered and the filtrate was analysed using ultraviolet spectroscopy at a λmax of 242.5 nm (Shimadzu UV-1800 UV-VIS spectrophotometer, Japan) (Chowdary and Rao Citation2003a, Sultana et al. Citation2009). Percentage entrapment of Gabapentin was determined using the following equation,
In vitro mucoadhesion
The mucoadhesive property of microspheres was evaluated by the method designed by Ranga Rao and Buri using stomach mucosa isolated from mice in comparison with non-bioadhesive ethyl cellulose microspheres (Rao and Buri Citation1989). Mice were fasted for 24 h, and stomach dissected immediately after the mice were sacrificed. Stomach mucosa was fixed onto glass plate and rinsed with physiological saline. A fixed number of microspheres were scattered uniformly on the surface, and mucosa was kept at high relative humidity at room temperature for 30 min. The stomach mucosa kept at an angle of 45° and rinsed with simulated gastric fluid (0.1 N HCl, pH 1.2) for 5 min at a rate of 22 ml/min. The microspheres remaining at the surface of mucosa were counted, and the percentage of the remaining microspheres was calculated (Sultana et al. Citation2011).
In vitro drug release
Drug release study was carried out in a six-basket USP XXIV dissolution apparatus type I (model – 8000, Labindia Analytical Instruments Pvt. Ltd., Mumbai, INDIA) rotating at 100 rpm maintained at 37 ± 0.5°C; 0.1N HCl (pH 1.2) was used as dissolution medium (900 ml) to simulate gastric environment. Aliquots were withdrawn at specific time intervals up to 12 h and analysed using ultraviolet spectroscopy at a λmax of 242.5 nm (Shimadzu UV-1800 UV-VIS spectrophotometer, Japan) after suitable dilution. The withdrawn volume was replaced with an equal volume of fresh medium to maintain sink conditions. All experiments were performed in triplicate (Nagarwal et al. Citation2010, Pund et al. Citation2011, Shah et al. Citation1999).
Drug release kinetics and transport mechanism
The drug release data were fitted to zero-order (cumulative % drug release versus time), first-order (log cumulative % drug retained versus time) and Higuchi model (cumulative % drug released versus square root of time) to assess the kinetics of drug release. Further, the data were analysed using Korsmeyer-Peppas model to determine the value of release exponent, n, to define the drug release mechanism (Sultana et al. Citation2009, Sultana et al. Citation2011).
Statistical analysis
Results were determined and expressed as mean ± S.D of three determinations. Design Expert 7.1 software for Windows was used to carry out all statistical analysis. Response surface methodology (RSM) using Design of experiments technique (DOE) (Box–Behnken Design) was used to carried out statistical analysis. The components of microspheres were taken as process variables, and their effect on particle size, entrapment efficiency and drug release statistically was analysed using ANOVA. The differences were considered significant at a level of p < 0.05.
Formulation optimization through response analysis
ANOVA application was used for the validation of polynomial equation produced by optimization software. A total of seventeen runs (F1–F17) were evaluated in terms of statistically significant coefficients and R squared values. The composition of optimized formulation was found by validating the results over the entire experimental region. Three optimum formulations (OF-1, OF-2 and OF-3) were selected to validate the chosen experimental design and polynomial equations. The predicted optimum formulations were formulated and checked for various responses. The observed values were compared with predicted values, and linear regression plots between actual and predicted values of the responses were generated by optimization software.
Results and discussion
Preliminary trials
Microspheres were formulated with different proportions of polymers and cross-linking agents. Lower amount of polymers produced irregularly shaped microspheres, so the contents of sodium alginate and sodium CMC were decided to be at 300–900 mg and 150–450 mg with the medium level at 600 and 300 mg, respectively. Calcium chloride amount was decided to be at 1–5% w/v to control the level of cross-linking between bivalent cation Ca2+ and acid group of alginate as per literature reported elsewhere.
Formulation optimization
Seventeen formulations were prepared and evaluated for experimental design of three-factor, three-level set-up. The evaluated responses were particle size, entrapment efficiency and in vitro drug release. Microspheres prepared with low concentration of polymers (- level) were rough and irregular in shape due to poor molecular packing and cross-linking in comparison with microspheres prepared with medium and high concentration of polymers (+ level) which were larger and more spherical. The variation in size and morphology of the microspheres with different polymeric concentrations was due to variations in availability of reacting/binding sites for cross-linking cations. As the cross-linking agent content was increased, smooth, spherical and smaller microspheres were obtained which were well packed and discrete ().
Figure 1. SEM photomicrograph of gabapentin-loaded Mucoadhesive microsphere.
Further, we analysed the effect of polymer concentration on drug entrapment efficiency which was more intricate. The drug entrapment efficiency was being affected by both of the polymers but in a reciprocal mode. Entrapment efficiency was directly proportional to the amount of sodium alginate, while it was inversely proportional to the amount of sodium CMC. The formulation with low level of sodium alginate and higher level of sodium CMC (F3) showed minimum DEE at 61.29. Formulation with low levels of sodium alginate and sodium CMC both (F1) showed 63.30% drug entrapment, which was in way between maximum and minimum. Maximum entrapment efficiency was observed in F15 formulation (81%), which consisted all factors at zero level.
Drug release study was simulated in acidic medium since the drug has an absorption window in stomach. Minimum drug release was observed in formulation containing highest concentration of polymers (+ 1 level). The formulations containing similar amount of sodium alginate but with lower levels of sodium CMC showed better drug release at 73.62% and 74.7%. Maximum drug release was observed in formulation F11 (83.70%) containing sodium alginate and sodium CMC at 0 and − 1 level, respectively, and cross-linking agent at + 1 level. Similarly high amount of drug release was obtained in F7 containing − 1 and 0 level of sodium alginate and sodium CMC, and higher level of cross-linking agent. It could be inferred that both of the polymers were affecting drug release and were more or less compensating for each other as far as drug release was concerned.
An experimental design of seventeen runs was generated for three factors at three levels to identify the optimum levels of different independent process parameter according to Box– Behnken design. The observed responses along with the predicted values for designed formulations are shown in . The observed values for size, entrapment efficiency, and drug release range from 559.50 to 801.10 μm, 61.29 to 81.00%, and 69.40 to 83.70%, respectively. The responses were simultaneously fitted to linear, two-factor interaction (2FI), cubic and quadratic models using Design Expert® 7.1 software.
The values of R-squared, Adj-squared, Pred R-squared, SD and % CV are shown in along with the regression equation. Since the cubic model was aliased due to insufficient design points to estimate the coefficients, the quadratic model was chosen for its larger adjusted R-squared value. The ANOVA values for different responses are represented in , and all statistically significant (p < 0.05) coefficients are included in the equations.
Table III. Regression analysis for response Y1, Y2 and Y3.
Table IV. Analysis of variance of calculated model.
As per the optimization design, a positive value shows favourable optimization, whereas a negative value shows an inverse relationship between the factor and the response. It is evident that all the three independent variables, namely the concentration of sodium alginate concentration (A), sodium CMC (B), calcium chloride (C), have interactive effects on the three estimated responses, for example, particle size (Y1), drug entrapment efficiency (Y2) and drug release (Y3).
Response surface analysis
Three-dimensional (3D) surface plots were generated for all the three responses and are shown in , , and for responses Y1, Y2 and Y3, respectively.
Figure 2. The effect of independent variables on response Y1 (particle size): (a) Effect of B and A; (b) Effect of C and A; and (c) Effect of C and B.
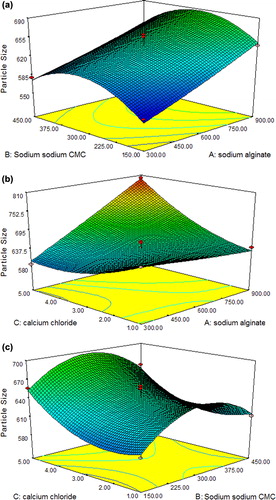
Figure 3. The effect of independent variables on response Y2 (drug entrapment efficiency): (a) Effect of B and A; (b) Effect of C and A; and (c) Effect of C and B.
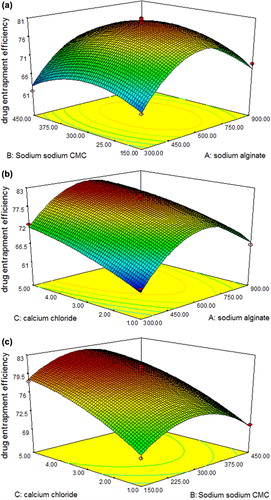
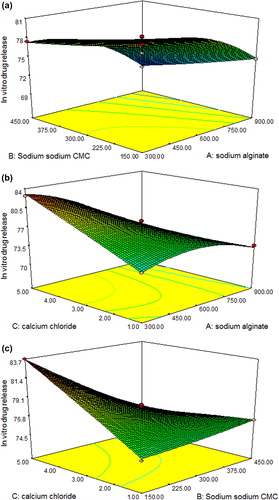
Figure 4. The effect of independent variables on response Y3 (Cumulative % in vitro drug release): (a) Effect of B and A; (b) Effect of C and A; and (c) Effect of C and B.
Response Y1: Effect on Particle size
The model proposes the following equation for particle size -
Particle Size: + 572.59750 − 0.16457A + 1.24378B − 87.47125C − 0.0215AB + 0.099721AC − 0.011008BC + 0.02065A2 − 0.09145B2 + 7.18125C2
where A is the concentration of sodium alginate; B is the concentration of sodium CMC, and C is the concentration of calcium chloride.
It was indicated by model F-value (26.25) that there is 0.01% chance that such a “Model F-Value” could occur due to noise. Model terms A, C, AC, B2 and C2 were significant, indicated by values of “Prob > F”< 0.0500(P-value = 0.0001). Factor A, that is, sodium alginate content showed more pronounced effect on particle size. The lack of fit was not significant indicated by “Lack of Fit F-value” of 0.71. The “Pred R-squared” of 0.8107 is in reasonable agreement with the “Adj R-squared” of 0.9342. “Adeq Precision” value of 23.865 shows the presence of adequate signal and model can be used to navigate the design space. is the response surface plot showing the effect of different independent variables on the particle size of microspheres. The results showed that an increase in polymers concentration resulted in an increase in the particle size of microspheres.
In our study, formulation F8 showed maximum particle size, that is, 801.1 μm (at sodium algiante (+ 1), sodim CMC (0) and calcium chloride (+ 1)). This could be due to higher concentration of sodium alginate and calcium chloride. Sodium alginate increases the droplet size, and the increase in concentration of cross-linking agent causes formation of larger mesh work.
Response Y2: Effect on drug entrapment efficiency
The model proposes the following equation for drug entrapment efficiency:
Drug Entrapment Efficiency = 5.01694 + 0.14671A + 0.12033B + 5.49988C − 0.0056AB − 0.0917AC − 0.1527BC − 0.0206A2 − 0.03688B2 − 0.35206C2
where A is the concentration of sodium alginate, B is the concentration of sodium CMC, and C is the concentration of calcium chloride.
The model was significant since the Model F-value was 28.88 (P = 0.0001). There is only 0.01% possibility of this Model F-Value due to noise. Model terms A, C, A2, and B2 are significantly indicated by values of “Prob > F” < 0.0500. The “Lack of Fit F-value” of 1.2 shows that there is 41.65% chance this “Lack of Fit F- value” could occur due to noise. The “pred R-squared” is in reasonable agreement with the “adj R-squared” (0.7796 and 0.9400, respectively). “Adeq Precision” of 14.453 indicates an adequate signal for the model to be used to navigate the design space.
is the response surface plot showing the effect of different independent variables on percentage drug entrapment. Formulation F13–F17 all showed maximum entrapment efficiency, that is, 76.97–81% (all the factors are at zero level), while F3 showed minimum entrapment efficiency (sodium algiante at − 1 level, sodium CMC at + 1 level, and calcium chloride at 0 level). This implies that at lower concentration of sodium alginate, lesser volume of cross-linked network is present which has a negative effect on entrapment efficiency.
Response Y3: Effect on in vitro drug release:
In vitro drug release: + 59.20481 + 0.035287A + 0.014623B + 6.38225C − 0.0081AB − 0.2417AC − 0.4157BC − 0.0158A2 + 0.0173B2 − 0.027563C2
where A is the concentration of sodium alginate, B is the concentration of sodium CMC, C is the concentration of calcium chloride.
The model was significantly indicated by Model F-value of 29.49 (P = 0.0001). There is only 0.01% chance that this “Model F-Value” could occur due to noise. Model terms A, B, C, AC, BC and A2 were significantly indicated by values of “Prob > F” < 0.0500. The amount of both polymer and cross-linking agent showed pronounced effect on in vitro drug release. The lack of fit was not significantly indicated by the “Lack of Fit F-value” of 0.14. There is a 92.94% chance that a “Lack of Fit F-value” (quite high) could occur due to noise. The “Pred R-squared” of 0.9241 is in reasonable agreement with the “Adj R-squared” of 0.9413. “Adeq Precision” at 20.062 indicates an adequate signal to use the model to navigate the design space.
is the response surface plot showing the effect of different independent variables on in vitro drug release. Formulations F1, F7,F11, F15, F16 and F17 showed maximum in vitro drug release, that is, 80.54%, 82.69%, 83.70%, 78.07%, 78.30% and 78.20%, respectively. This indicated that in vitro drug release was affected by concentration of both the polymer and the cross-linking agent significantly.
The linear correlation plots drawn between the predicted and the experimental values demonstrated high values of R2 for all the three responses. The R2 values for responses Y1, Y2 and Y3 were in the range 0.9692–0.9712, 0.9721–0.9738 and 0.9711–0.9743, respectively. It indicates the excellent goodness of fit at p < 0.0001. Thus, the low magnitudes of error as well as the significance of values of R2 prove the high predictive ability of the RSM in the present study.
Selection of optimized formulations using point prediction method
The optimum formulations were selected to achieve the optimum values of each response, that is, particle size (Y1), drug entrapment efficiency (Y2) and % in vitro drug release (Y3). The constraints for the response Y1, Y2 and Y3 were found to be in the range 559.50 ≤ Y1 ≥ 801.10 μm, 61.29 ≤ Y2 ≥ 81.00% and 69.40 ≤ Y3 ≥ 83.70%. Based on the prediction, three formulae were randomly selected and the responses of particle size, entrapment efficiency and % cumulative drug release were evaluated. The validation for RSM involving all the three checkpoint formulations was found to be within limits. The composition of optimum check point formulations, their predicted and observed values for all the responses and the percentage error are shown in . The percentage prediction error was found to be varying between − 4.55% and + 1.32%.
Table V. Composition of checkpoint formulations with predicted and observed values of responses.
Point prediction of the design expert software predicted the optimized responses to be 608.21 μm particle size, 79.65% drug entrapment efficiency and 82.72% cumulative in vitro drug release at polymer concentration, sodium alginate 462.16 mg, sodium carboxymethyl cellulose 158.11 mg and calcium chloride 4.95 (%w/v) as a cross-linking agent.
Mucoadhesion
The mucoadhesion test indicated that the optimized formulations showed acceptable adhesiveness. Formulation OF-3 exhibited fairly good mucoadhesive properties (81 ± 0.49%) up to 10 h as compared to non-mucoadhesive ethylcellulose microspheres.
In vitro drug release
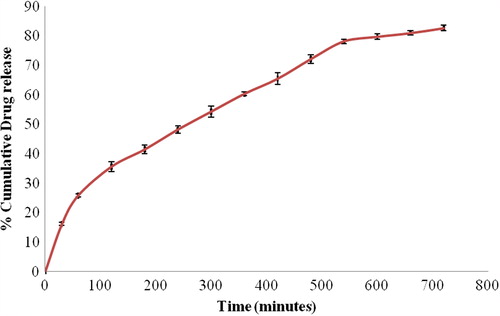
In vitro drug release study showed that the amount of drug release significantly decreased with an increase in the concentration of polymers (P < 0.05). It can be attributed to increase in the viscosity of the polymeric matrix resulting in larger microspheres. This, in turn, increases the diffusional path length for the drug [Citation22]. As the concentration of cross-linking agent increases the drug release from the microspheres was also delayed (p < 0.05). Increased concentration of cross-linking agent resulted in the formation of smaller cavities which decreases the swelling capacity of microspheres. Hence, there is a decrease in effective surface area for drug diffusion. The cumulative amount of drug released from optimized formulation, OF-3, was found to be 82.72. shows the release behaviour of OF-3.
Figure 5. In vitro release profile of optimized formulation OF-3.
Release mechanism
In vitro drug release data for OF-3 were applied to zero-order, first-order, and Higuchi models to determine the release kinetics. Further, Korsmeyer-Peppas equation was used to characterize the drug transport mechanism (). The best fit was predicted by Higuchi model (r2, 0.995) than by zero-order (r2, 0.768) and first-order (r2, 0.979) models. This clearly indicates that the release of gabapentin from the formulated mucoadhesive microspheres is diffusion controlled.
Table VI. Release kinetics and transport mechanism of optimized formulations (OF-1, OF-2 and OF-3).
The experimental data were further applied to the Korsmeyer-Peppas equation to characterize the transport mechanism. The value of release exponent (n) for the proposed model was 0.652 for optimized formulation OF-3 (0.5 < n < 1), suggesting drug release controlled by swelling and relaxation of polymer.
The selected formulation showed diffusion controlled drug release by means of swelling and relaxation of polymer. In diffusion process, critical factors are area of diffusion, diffusion path length, porosity, tortuosity, concentration gradient and diffusion coefficient. The polymers used were hydrophilic and becomes swollen when in contact with aqueous medium. Swollen polymer matrix has increased porosity and decreased path length and tortuosity promoting release, whereas decrease in concentration gradient impedes the drug release. The optimized formulation possesses an optimized balance thereby maintaining a constant input of drug in biological system for absorption.
Conclusion
The mucoadhesive microspheres of gabapentin were formulated and optimized using Box–Behnken process optimization software. The quantitative responses of particle size, entrapment efficiency and in vitro drug release for different combinations of independent variables, sodium alginate as release retarding polymer, sodium carboxymethylcellulose as mucoadhesive polymer and calcium chloride as cross-linking agent were obtained experimentally, and the results were found to fit the design model. The quantitative effect of these factors at different levels on the responses could be predicted using polynomial equations, and high linearity was observed between predicted and actual values of response variables.
The results for the present study revealed that the content of polymers and cross-linking agent affected the responses, particle size, entrapment efficiency and in vitro drug release in a significant and interactive manner.
The formulation OF-3 was found to be the optimum formulation predicted by point prediction of the design expert software. The in vitro drug release was found to be controlled for more than 12 h and followed the Higuchi model. The validations of RSM for three dependent variables were 100.09%, 99.68% and 98%. Therefore, it can be concluded that a mucoadhesive microsphere for gabapentin was developed and optimized using a three-factor, three-level Box–Behnken design.
Declaration of interest
The authors report no conflicts of interest. The authors alone are responsible for the content and writing of the paper.
Related Research Data
References
- Allen T, Yu L. 2000. Low cost response surface methods for and from simulation optimization. Simulation Conference, 2000. Proceedings. Winter 1:704–714.
- Barry GE, DeCerce J, Kruger S, Rutecki P, Pitterle M, Bockbrader HN, Ramsay RE. 1998. Gabapentin bioavailability: effect of dose and frequency of administration in adult patient with epilepsy. Epilepsy Res. 31:91–99.
- Barry GE, Rodulovic LL, Kruger S, Rutecki P, Pitterle M, Bockbrader HN. 2000. Inter and intra subject variability in Gabapentin absorption and absolute bioavailability. Epilepsy Res. 40:123–127.
- Baumgratner SK, Vrecer F, Vodoprivec P. 2000. Optimization of floating matrix tablet and evaluation of their gastric residence time. Int J Pharm. 195:125–135.
- Bordonart PL, Falvre V, Pugh WJ, Falson F. 2006. Gastroretentive dosage forms: overview and special case of H. pylori. J Control Release. 111:1–18.
- Box GEP, Behnken DW. 1960. Some new three level designs for the study of quantitative variables. Technometrics. 2: 455–75.
- Box GEP, Draper NR. 1987. Empirical Model-Building and Response Surfaces. New York: Wiley and Sons.
- Chowdary KPR, Rao YS. 2003a. Design and in vitro and in vivo evaluation of mucoadhesive microcapsule of glipizide for oral controlled release: technical note. AAPS PharmSciTech. 4:1–6.
- Chowdary KPR, Rao YS. 2003b. Preparation and evaluation of mucoadhesivemicrocapsules of indomethacin. Saudi Pharm J. 11:97–103.
- Draper NR, Lin DKJ. 1996. Response Surface Designs. In: Handbook of Statistics, eds. S Ghosh and CR Rao. Elsevier: New York. Vol 13:343–376.
- Gavin PA, Thomas PL, David SJ. 2009. Mucoadhesive polymeric platform for controlled drug delivery. Eur J Pharm Biopharm. 71:505–518.
- Gonza´lez-Rodrıguez ML, Holgado MA, Sa´nchez-Lafuente C, Rabasco AM, Fini A. 2002. Alginate/chitosan particulate systems for sodium diclofenac release. Int J Pharm. 232:225–234.
- Hoffman A. 1998. Pharmacodynamic aspect of sustain release preparation. Adv Drug Del Rev. 33:185–199.
- Hoffman A, Stepensky D. 1999. Pharmacodynamic aspect of mode of drug administration for optimization of drug therapy. Crit Rev Ther Drug Carrier Syst. 16:571–639.
- Hwang SJ, Park K. 1998. Gastric retentive drug -delivery system. Crit Rev Ther Drug Carrier Syst. 15:243–284.
- Khan GM. 2001. Control release oral dosage form: Some recent advances in matrix type drug delivery system. Asian network scientific information. 1:350.
- Montgomery DC. 2005. Design and Analysis of Experiments. New York: John Wiley.
- Mudahar GS, Toledo RT, Floros JD, Jen JJ. 1989. Optimization of carrot dehydration process using response surface methodology. J Food Sci. 54:714–719.
- Myers RH, Montgomery DC, Vining GG, Borror CM, Kowalski SM. 2004. Response surface methodology: a retrospective and literature survey. J Quality Technol. 36:53–77.
- Nagarwal RC, Ridhurkar DN, Pandit JK. 2010. In vitro release kinetics and bioavailability of gastroretentive cinnarizine hydrochloride tablet. AAPS PharmSciTech. 11:294–303.
- Nazzal S, Nutan M, Palamakula A, Shah R, Zaghloul A, Khan MA. 2002. Optimization of a self-nanoemulsified tablet dosage form of Ubiquinone using response surface methodology: effect of formulation ingredients. Int J Pharm. 240:103–114.
- Pawar VK, Kansal S, Asthana S, Chourasia MK. 2012. Industrial perspective of gastroretentive drug delivery systems: physiochemical, biopharmaceutical, technological and regulatory consideration. Expert Opin Drug Deliv. 9:551–565.
- Prajapati SK, Tripathi P, Ubaidulla U, Anand V. 2008. Design and development of gliclazide mucoadhesive microcapsules: In vitro and in vivo evaluation. AAPS PharmSciTech. 9:224–230.
- Pund S, Joshi A, Vasu K, Nivsarkar M, Shishoo C. 2011. Gastroretentive delivery of rifampicin: In vitro mucoadhesion and in vivo gamma scintigraphy. Int J Pharm. 411:106–112.
- Rao KVR, Buri P. 1989. A novel in situ method to test polymers and coated microparticles for bioadhesion. Int J Pharm. 52: 265–270.
- Rotthäuser B, Kraus G, Schmidt PC. 1998. Optimization of an effervescent tablet formulation using a central composite design optimization of an effervescent tablet formulation containing spray dried L-leucine and polyethylene glycol 6000 as lubricants using a central composite design. Eur J Pharm Biopharm. 46:85–94.
- Shah S, Qaqish R, Patel V, Amiji M. 1999. Evaluation of the factors influencing stomach-specific delivery of antibacterial agents for Helicobacter pylori infection. J Pharm Pharmacol. 51:667–672.
- Sultana S, Bhavna, Iqbal Z, Panda BP, Telegaonkar S, Bhatnagar A, Ahmad FJ. 2009. Lacipidine encapsulated gastroretentive microspheres prepared by chemical denaturation for Pylorospasm. J Microencaps. 29:385–393.
- Sultana Y, Maurya DP, Aquil M, Panda BP, Ali A. 2011. Formulation and evaluation of alkaline extracted isapghula husk microscopic reservoirs of isoniazid by Box-Behnken statistical design. J Dispersion Sci Technol. 32:424–432.
- Tao Y, Lu Y, Sun Y, Gu B, Lu W, Pan J. 2009. Development of mucoadhesive microspheres of Acyclovir with enhanced bioavailability. Int J Pharm. 378:30–36.
- Tripathi KD. 2008. Essentials of Medical Pharmacology. New Delhi: Jaypee Brothers Medical Publications (P) Ltd.