
Abstract
The selective binding of albumin on dye-affinity nanospheres was combined with magnetic properties as an alternative approach for albumin depletion from human plasma. Magnetic poly(hydroxyethyl methacrylate) (mPHEMA) nanospheres were synthesized using mini-emulsion polymerization method in the presence of magnetite powder. The specific surface area of the mPHEMA nanospheres was found to be 1302 m2/g. Subsequent to Cibacron Blue F3GA (CB) immobilization onto mPHEMA nanospheres, a serial characterization processing was implemented. The quantity of immobilized CB was calculated as 800 μmol/g. Ultimately, albumin adsorption performance of the CB-attached mPHEMA nanospheres from both aqueous dissolving medium and human plasma were explored.
Introduction
Combining nanotechnology with the impact of need for human serum albumin (HSA) depletion from human plasma effectively promotes a novel approach for proteomics. Proteomics which is known as proteome analysis covers two important issues: identification of proteins, and structural properties and clarification of protein functions (CitationAnderson and Anderson 2002). Proteins and also their quantity are capable of differentiation according to various phases of diseases. The most widely used biological fluids are blood plasma and serum, resulting as fundamental materials used for disease diagnosis. While 10 different proteins constitute 90% and 12 different proteins constitute 9% of the whole plasma proteins, substantial disease-marker proteins constitute only 1% of them. Since HSA is known to be the most abundant protein appearing in the plasma of both human beings and other mammals, it figures large both in diagnosis and therapeutics. Thus, albumin forms approximately 60% of the existing total blood proteins. In recent years, plenty of products have been developed which contribute to disease diagnosis by demonstrating the important impact of albumin depletion (CitationSilva and Arruda 2009, CitationBjörhall et al. 2005, CitationSteel et al. 2003). Since albumin and immunoglobulins mask the less-abundant special proteins, if they are not depleted before the 2D-gel electrophoresis, it almost becomes impossible to detect the gel spots belonging to the proteins with particular focus on some disease (CitationAhmed et al. 2003). Multiple techniques have been applied for the minimization of sample complexity in human plasma or serum, including both dye affinity and molecularly imprinted polymers (CitationHamrita et al. 2012, CitationZolotarjova et al. 2008, CitationUrbas et al. 2009, CitationWarder et al. 2009, CitationMahn et al. 2010, CitationAltıntaş et al. 2011, CitationBereli et al. 2010, CitationAndac et al. 2013). The advantage of dye affinity chromatography which is widely used in recent years among the chromatographic techniques is taken in this content (CitationDenizli and Piskin 2001), as dyes are able to bind most types of proteins, in some cases in a remarkably selective manner. They are commercially available, inexpensive and can easily be immobilized especially on matrices bearing hydroxyl groups (CitationTamahkar et al. 2010). Preparation and application of dyes are also described in various fields in several literature (CitationPatanarut et al. 2010, CitationLeatherbarrow and Dean 1980, CitationChen et al. 1996, CitationAltıntaş and Denizli 2006, CitationBaşar et al. 2007, CitationTüzmen et al. 2010, CitationAndac et al. 2012). Iron oxide particles such as magnetite (Fe3O4) and its oxidized form maghemite (γ-Fe2O3) are by far the most commonly employed in biomedical applications (CitationCompeán-Jasso et al. 2008). The unique feature of magnetic particles is their response to magnetic force. Several studies are published on preparation and properties of magnetic nanosized particles for biological and environmental separations (CitationHorak et al. 2007, CitationLaurent et al. 2008, CitationNishio et al. 2008, CitationYuan et al. 2010, CitationKöse and Denizli 2013). The nanospheres are the most preferred for the adsorption of biomolecules as they have extremely high “specific surface area/volume” ratio (CitationTürkmen et al. 2008, CitationKarakoç et al. 2009).
In this study, a nanotechnological approach was developed in order to deplete albumin from human plasma effectively. For this purpose, the advantage of the magnetic properties was combined with the dye-attached nanospheres considering both magnetic properties and high surface area of nanospheres.
Experimental
Materials
HSA was supplied from Fluka (Biochemika, Switzerland) and stored at 4°C. Human plasma was purchased from Sigma (St. Louis, MO, USA). The dye-ligand Cibacron Blue F3GA (CB), the monomer 2-hydroxyethyl methacrylate (HEMA) and the cross-linker ethylene glycol dimethacrylate (EGDMA) were purchased from Sigma (St. Louis, MO, USA). Sodium bicarbonate (NaHCO3), sodium bisulfite (NaHSO3) and Fe3O4 (average diameter ≈ 20–50 nm) nanopowder were also purchased from Sigma (St. Louis, MO, USA). Poly(vinyl alcohol) (PVA; MW: 16.000, 98% hydrolyzed) was obtained from Acros Organics (USA). All other chemicals used in this study were ofanalytical grade and were purchased from Merck AG (Darmstadt, Germany).
Synthesis of CB-attached magnetic poly(hydroxyethyl methacrylate) (mPHEMA) nanospheres
The miniemulsion polymerization process of HEMA monomer in the presence of Fe3O4 nanospheres contained aqueous and oil phases. Aqueous phase forming frame contains 0.4 g of PVA, 57.7 mg of SDS and 46.9 mg of NaHCO3 dissolved in 200 mL of deionized water. Oil phase forming frame contains 0.8 mL of HEMA and 4.2 mL of EGDMA resulting elsewhere as the organic phase. The final reaction medium composing of the two relevant phases was also provided, containing 0.2 g of Fe3O4, 0.2 g of NaHSO3 and 0.3 g of APS as the initiator. Miniemulsion polymerization was carried out in a fixed reaction volume of 250 mL at 40°C within a mixing rate of 500 revolutions per minute (rpm) for 24 h. Subsequently the reactor was cooled and the synthesized nanospheres were separated from the medium by centrifugation. The soluble components were removed with washing out process using ethanol and water reciprocally. The CB-attachment procedure was conveniently applied with an experimental medium of 0.1 g of mPHEMA, 4.0 g of NaOH and 1.0 mg/mL of CB in 100 mL using the following reaction condition: a constant temperature value of 80°C with 400 rpm mixing rate for 4 h. Following the incubation process, CB-attached mPHEMA (mPHEMA-CB) nanospheres were centrifuged and washed with water and ethanol several times in order to remove physically adsorbed CB molecules. To avoid microbial contamination, the magnetic nanospheres were stored in 0.02% NaN3 solution at 4°C.
Characterization studies
The size and polydispersity analysis of mPHEMA-CB nanospheres were measured by Nano Zetasizer (NanoS, Malvern Instruments, London, UK). Zeta potential is used to predict and control the stability of colloidal emulsions. Thus, surface charge measurements of the synthesized mPHEMA-CB nanospheres were elsewhere measured using Nano Zetasizer (NanoS, Malvern Instruments, London, UK). The specific surface area of mPHEMA-CB nanospheres was calculated in terms of m2/g corresponding to the following relationships (CitationBangs 1987):
Here, N, S, d and ρs denote the number of nanospheres in 1 mL of suspension, the weight of solids (%), mean diameter (nm) and density of nanosphere suspension (g/mL), respectively. N in 1 mL of suspension is calculated by the mass to volume graph of nanospheres. The specific surface area of mPHEMA-CB nanospheres was calculated by multiplying N and the surface area of one nanosphere.
The topographic images of mPHEMA-CB nanospheres were taken by atomic force microscope (Nanomagnetics Instruments, Oxford, UK). Scanning electron microscope (SEM, Philips, XL-30S FEG, Germany) was used within various magnification rates for further surface morphology clarification of mPHEMA-CB nanospheres. The content of CB was calculated from stoichiometric ratio of sulfur by performing elemental analysis (Leco, CHNS–932, USA). All the infrared (IR) spectra were collected by a Fourier transform IR (FTIR) spectrometer (Thermo Fisher Scientific, Nicolet iS10, Waltham, MA, USA) to identify the functional groups followed by the relevant wavenumber interval of 4600–400 cm–1. The existence of Fe3O4 particles inside the mPHEMA-CB nanospheres was investigated with the electron spin resonance (ESR) spectrophotometer (EL9, Varian, USA). Magnetic measurements of the mPHEMA-CB nanospheres were performed on Vibrating Sample Magnetometer (VSM, Princeton Applied Research, Model 150 A, USA) system at room temperature. Experiments were performed on a Thermal Analysis Instrument Mettler TA 3000 equipped with DSC connection item owing a TC10 TA drawer with Mettler 03 interface to determine the glass transition temperature (Tg), melting temperature (Tm) and decomposition temperature (Td) of mPHEMA-CB nanospheres. Thermal Analysis Instrument TGA 2950 was operated for the purpose of determining inorganic phase percentage (Fe3O4%) content throughout the mPHEMA-CB nanospheres.
Adsorption of HSA from aqueous solutions
HSA adsorption of mPHEMA-CB nanospheres from the aqueous solutions was investigated in a batchwise system aiming to determine the effects of the required parameters. The investigated parameters were pH, HSA concentration, salt concentration and temperature. Considering the typical adsorption experiment guideline, HSA was dissolved in 4.0 mL of buffer solution, and subsequently 1.0 mL of mPHEMA-CB nanospheres available as a suspension with a concentration of 2.34 mg/mL was added. The adsorption process was carried out with magnetic stirring (130 rpm) for 2 h at room temperature. The HSA quantity adsorbed on the nanospheres was measured using Bradford method corresponding to the equation of q = [(Co − C)V]/m. Here, q refers to the amount of HSA adsorbed onto unit mass of the nanospheres (mg/g), Co and C are the concentrations of HSA in the initial solution and the supernatant after adsorption, respectively (mg/mL), V is the volume of the aqueous phase (mL) and m is the mass of the nanospheres (g).
Selective depletion of albumin from human plasma
In vitro depletion experiments were done using human plasma at room temperature with 130 rpm mixing rate. Phosphate buffer solution (10 mM, pH 7.4) was used for dilution of human plasma. SDS-polyacrylamide gel electrophoresis (SDS-PAGE) was applied in order to control the purity of HSA adsorbed/desorbed from both the aqueous solutions and human plasma. SDS-PAGE was carried out in 12% separating gel and 5% acrylamide stacking gel, to which 20 μg/μL of protein solution was loaded. Colloidal Coomassie Blue G-250 staining protocol was used and destained in water. ImageQuant 300 (Amersham, USA) was used for monitoring the image.
Desorption and reusability
Desorption of HSA was carried out by addding 1M of NaCl to 10 mM phosphate buffer solution (pH 6.0) at room temperature. The HSA-adsorbed nanospheres were placed in the desorption medium and stirred for 1 h at a stirring rate of 130 rpm. The final HSA concentration in the desorption medium was determined by Bradford Method. In order to test the reusability of the mPHEMA-CB nanospheres, HSA adsorption and desorption processes were repeated 10 times using the same group of nanospheres.
Results and discussion
Characterization studies
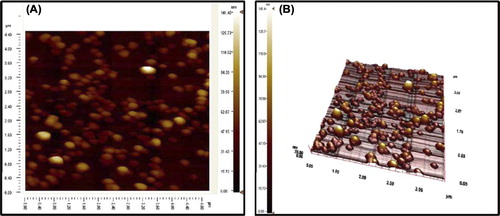
The average size of mPHEMA-CB nanospheres was assayed with Zeta sizer as 98.9 nm since polydispersity came out to be 0.156. The stability of miniemulsion polymerization was supported with the positive zeta potentials recorded as 20.7 mV at pH 4.0, 2.1 mV at pH 7.0 and 10.5 mV at pH 8.0. Important complementary information has been obtained for the characterization of mPHEMA-CB nanospheres by the Positive Zeta Potential values according to the related articles (CitationKumar et al. 2004, CitationFeng and Huang 2001, CitationBayems and Gurny 1997). The zeta potential value is an important particle characteristic as it can influence both particle stability and particle mucoadhesion (CitationKumar et al. 2004). In theory, more pronounced zeta potential values, being positive or negative, tend to stabilize particle suspension. The electrostatic repulsion between particles with the same electric charge prevents the aggregation of the spheres (CitationFeng and Huang 2001). Mucoadhesion, on the other hand, can be promoted by a positive zeta potential value. The mucus layer itself is at a neutral pH value an anionic polyelectrolyte (CitationBayems and Gurny 1997). Consequently, the presence of the positively charged groups on the particles could lead to electrical charge interactions between the mucus and the particles (CitationKumar et al. 2004). The specific surface area of mPHEMA-CB nanospheres was calculated as 1302 m2/g. On account of the fact that this calculated high surface area yields low mass transfer restrictions, prepared nanospheres may lead to extremely high HSA adsorption capacities. The maximum average size of mPHEMA-CB nanospheres was calculated as 101.5 nm by AFM which was in accordance with zeta sizer results (98.9 nm). As seen from , mPHEMA nanospheres are spherical and monodisperse supporting the repeatable adsorption processes. The narrow size distribution of mPHEMA nanospheres was one of the most important parameters affecting the adsorption dynamics.
The SEM image of mPHEMA-CB nanospheres confirms the spherical and monodisperse shape of polymers more clearly (). Average size values of nanospheres were observed around the value of 100 nm confirming the sustainability of the synthesized polymers. The quantity of sulfur determined using the elemental analysis belongs to CB triazinyl dye that was attached to the mPHEMA nanospheres, hence mPHEMA nanospheres do not involve any sulfur in their chemical structure. According to the sulfur stoichiometry, the quantity of CB attached to the mPHEMA nanospheres was calculated as 800 μmol/g. The characteristic FTIR peaks of mPHEMA, CB and mPHEMA-CB nanospheres are listed in .
Table I. Characteristic FTIR peaks of of mPHEMA nanospheres, CB and mPHEMA-CB nanospheres.
It was observed that the peak appearing at 3443–200 cm–1 frequency range characterizes most particularly the OH stretching vibration that was both contributed and not contributed to the hydrogen bonding. Nevertheless, the point that should be emphasized is that electrostatic interaction also occurs between the Fe3+ ion and OH group besides the hydrogen bonds between the OH groups themselves, which is why the spectrum taken in the presence of Fe3+ is not very broad. The PHEMA has one hydroxyl and one carbonyl group on each polymer side chain (CitationMontheard et al. 1992). These functional groups can contribute to — OH, O=C and OH-OH types of hydrogen bonds. It was estimated from the relevant study of Morita et al. that 47.3% of OH groups on the PHEMA side chain terminal are engaged in the OH-O=C type of hydrogen bonds, while the rest contributes to the OH—OH type of hydrogen bonds (CitationMorita et al. 2009). The sharp peak seen at 1732 cm− 1 represents the C=O stretching vibration of mPHEMA polymer. It was estimated that the weak peak at the 1635 ± 15 cm− 1 interval arose from the terminal C=CH2 groups of EGDMA crosslinker, while the broad peaks at 1265 and 1162 cm–1 frequency range characterize O—H stretching vibration. Moreover the peak resulting at 757 cm–1 frequency supports the magnetism of the structure indicating the Fe-O stretching vibration of Fe3O4 molecule. The N–H stretching vibration bands of this monotriazine dye appeared at 3443 ± 50 cm− 1 frequency range as multiple bands. This spectral set-up was at regular interval, hence the different amine groups of the dye could have a tendency to be free and H-bonded. Bands having moderate intensity at 1732 cm− 1, a shoulder at 1619 cm− 1 and then sharp bands at 1568 and 1506 cm− 1 were the spectral evidences that characterize the C=O, C=N and C=C stretching vibrations of the structure. The band at 1221 cm− 1 and the broad band at nearly 25 cm− 1 below and above this frequency characterize the S=O stretching vibrations. The band that can be seen obviously at 1084 cm− 1 belongs to the C-Cl stretching. At the lower wavenumber such as 1025 cm− 1 S-O stretching vibration band is also seen in the spectrum. In addition to that, it is possible to see the C-Cl stretching vibrations of the dye at different wavenumbers in the range of 500–700 cm− 1. The C=O band of mPHEMA-CB nanospheres is clear at 1728 cm− 1 as a sharp peak. It was observed that the strength of the band at 1650 cm− 1 is extremely low. The peaks at 1263 cm− 1 and 1161 cm− 1 characterized the C-O stretching vibrations. The transformation of the C-Cl stretching vibration of the CB at 1084 cm− 1 from a strong position to a weak shoulder at 1081 cm− 1 of the IR bands can be significantly justified from the relevant spectra. Furthermore, the decrease in the intensity of the same stretching vibrations of CB at 500–700 cm− 1 frequency interval contributes to this fact. The FTIR spectral peak results of the synthesized mPHEMA-CB nanospheres showed similarity with the reported article on FTIR spectrum peaks of mPHEMA-CB beads (CitationBaşar et al. 2007).
The presence of Fe3O4 nanopowder in the polymeric structure was confirmed by the ESR. The Fe3O4 peak intensity of the mPHEMA-CB nanospheres against magnetic field has a relative intensity of 50 improving the existing local magnetic field due to the presence of Fe3O4 in it. The g factor (g = hυ/βHr) was calculated as 2.3. It was considered as a quantity characteristic of the molecules in which the unpaired electrons are located. Factor g for Fe3 was 1.4–3.2 for low spin and 2.0–9.7 for high spin complexes (CitationRandolph 1972). The external magnetic field at resonance (Hr) state was found as 3050 Gauss and it was estimated to be sufficient to excite all of the dipole moments present in 1.0 g of mPHEMA-CB structure.
The magnetic property of mPHEMA-CB nanospheres was also characterized by a VSM magnetometer. A typical magnetic hysteresis curve was observed for mPHEMA-CB nanospheres. The saturated magnetization (Ms), the residual magnetization (Mr) per gram of samples, the relative saturation remanence (mr = Mr/Ms) and the coercivity (Hc) are given in . The polymeric sample shows a typical superparamagnetic behavior at room temperature without any hysteresis loop. The superparamagnetic behavior is also proved with the low Mr/Ms ratio and in the small Hc values as reported in the relevant literature (CitationZheng et al. 2005).
Table II. Magnetic Properties of mPHEMA-CB nanospheres.
The required parameters such as Tg, Tm and Td of mPHEMA-CB nanospheres were determined with the DSC graph as shown in . In the relevant literature Tg was reported as 79.2°C for PHEMA which does not involve any Fe3O4 (CitationLaurent et al. 2008, CitationFerreira et al. 2000). The increase in Tg value (83.2°C) in our research proved that the Fe3O4 in the polymer structure enhanced the thermal stability of PHEMA. The Tm was observed at 287.1°C and the Td was observed at 421.2°C and 450.9°C which confirmed the thermal stability of the polymer.
The Fe3O4 content of the dried sample was measured using thermogravimetric analysis as illustrated with a graph in . It was found to be contained at a ratio of 7.1% of inorganic Fe3O4 by mPHEMA-CB nanospheres. Based on the aforementioned article high Fe3O4 content of mPHEMA-CB nanospheres indicates that they have a strong magnetic sensitivity under an outer magnetic field, which has been found by the fact that the magnetic polymer spheres move toward the outer field very quickly and obviously can be separated completely from water in a very short time. Therefore, the magnetization properties of the magnetic polymer spheres are strong enough for magnetic separation applications (CitationZheng et al. 2005).
Adsorption of HSA from aqueous solutions
The dependence of pH and initial concentration of HSA on adsorption capacity is given in . The maximum adsorption capacity of HSA was observed at pH 5.0, which is the isoelectric point of HSA. The HSA adsorption capacity decreased by changing pH above and below 5.0. The decrease in the HSA adsorption capacity can be caused by the electrostatic repulsion between the identically charged groups. At the isoelectric point, proteins have no net charge and therefore, the maximum protein adsorption from aqueous solution is usually observed at this point. The adsorption capacity of mPHEMA-CB nanospheres was increased as the initial concentration of HSA was increased. A plateau value was achieved at a concentration of 4 mg/mL, which represents the saturation of binding sites of mPHEMA-CB nanospheres. The maximum HSA adsorption capacity of mPHEMA-CB nanospheres was found to be 2460 mg/g.
The results of ionic strength and temperature effect are indicated in . The decrease in HSA adsorption capacity with increasing ionic strength is due to the electrostatic repulsions between HSA and mPHEMA-CB nanospheres.
The enhancement in HSA adsorption capacity with increasing temperature may have resulted from cooperative effect of different interaction mechanisms such as hydrophobic, electrostatic and hydrogen bonding caused by the acidic groups and aromatic structures on CB and side chain of amino acids on HSA molecules as mentioned before while explaining the pH effect. In order to show the reusability of mPHEMA-CB nanospheres, the adsorption and desorption cycles were repeated 10 times and it was found that there was no significant change in the adsorption capacity of mPHEMA-CB nanospheres (data not shown). According to these results, the advantage of low cost, high stability, easy coupling of CB to the mPHEMA nanospheres with high density and high surface area of mPHEMA-CB nanospheres gave rise to high HSA-binding capacity (CitationDai et al. 2006, CitationMa et al. 2005). The high HSA-binding capacity of the mPHEMA-CB nanospheres (2460 mg/g) could be compared with the magnetic nanoparticles, which were prepared by Ma et al., with high HSA-binding capacity (1428.21 mg/g) (CitationMa et al. 2005).
Selective HSA depletion from human plasma
It has become clear that HSA adsorption quantity of mPHEMA-CB nanospheres from human plasma is extremely high compared with the quantity from aqueous solution as can be seen from and . This may be explained as follows; the conformational structure of HSA molecules within their native environment (i.e., human plasma) must probably be much more suitable for specific interaction with the mPHEMA-CB nanospheres.
Table III. HSA adsorption from human plasma.
Table IV. Comparison of HSA adsorption from aqueous solutions and human plasma.
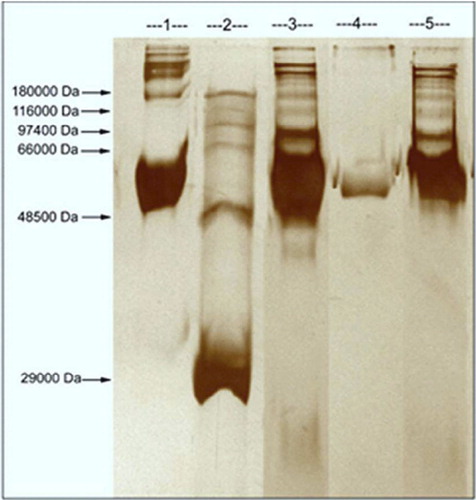
Depletion of additional abundant proteins can be beneficial in the analysis of serum proteins, and therefore it was attempted to deplete HSA from human plasma efficiently. The purity of HSA was assayed and proved by SDS-PAGE as shown in . The first line is standard HSA (1 mg/mL, Sigma), second line is wide range Sigma marker, third, fourth and fifth lines correspond to untreated human plasma, desorption and treated human plasma with mPHEMA-CB nanospheres, respectively.
Conclusions
Classic adsorption methods which relied on the use of a combination of conventional chromatographic techniques have turned out to cause extreme hindrance compared with the novel nanotechnologic approach. This current nanotechnological investigation aimed to derive alternative guidelines for selective depletion of HSA proteomics assembling nano concept, magnetic carrier technology, modified miniemulsion process, novel adsorption techniques and functional increasing effect of CB monotriazinyl dye. Magnetic carrier technology enhances the usability of magnetic processing for rapid and selective depletion. Magnetic separation has several potential advantages over the more conventional approaches (CitationOdabaşı and Denizli 2004). Based on the aformentioned articles, it can be absolutely said that magnetic polymer particles have been widely applied to various aspects in biotechnology and biomedicine fields including protein purification process corresponding to our research (CitationAltıntaş and Denizli 2006, CitationBaşar et al. 2007, CitationTüzmen et al. 2010). The results obtained in this article show that adsorption of HSA under optimum values of pH (pH 5), HSA initial concentration (4.0 mg/ml), ionic strength (0.01 M) and temperature (25°C) parameters have revealed the high capacity (598 mg/g polymer) and affinity to CB F3GA-attached mPHEMA nanospheres (average size: 100 nm and specific surface area: 1302 m2/g) for HSA depletion from both aqueous solution and human plasma. It should also be emphasized that HSA adsorption from human plasma is 42.4%, whereas it is only 19.2% from aqueous solution. In conclusion, it is possible to use the magnetic nanospheres in a HSA adsorption–desorption cycle. Finally these developed mPHEMA-CB nanospheres may definitely be promising for future preparation of novel inorganic/organic hybrid nanospheres.
Declaration of interest
The authors report no declarations of interest. The authors alone are responsible for the content and writing of the paper.
References
- Ahmed N, Barker G, Oliva K, Garfin D, Talmadge K, Georgiou H. 2003. An approach to remove albumin for the proteomic analysis of low abundance biomarkers in human serum. Proteomics. 3: 1980–1987.
- Altıntaş EB, Türkmen D, Karakoç V, Denizli A. 2011. Efficient removal of bilirubin from human serum by monosize dye affinity beads. J Biomater Sci Polym Ed. 22:957–971.
- Altıntaş EB, Denizli A. 2006. Efficient removal of albumin from human serum by monosize dye-affinity beads. J Chromatogr B. 832: 216–223.
- Andac M, Galaev IY, Denizli A. 2012. Dye attached poly(hydroxyethyl methacrylate) cryogel for albumin depletion from human serum. J Sep Sci. 35:1173–1182.
- Andac M, Galaev IY, Denizli A. 2013. Molecularly imprinted polyhydroxyethyl methacrylate based cryogel for albumin depletion from human serum. Colloids Surfaces B. 109:259–265.
- Bereli N, Şener G, Altıntaş EB, Yavuz H, Denizli A. 2010. Polyglycidyl methacrylate beads embedded cryogels for pseudo-specific affinity depletion of albumin and immunoglobulin G. Mater Sci Eng. 30:323–329.
- Anderson NL, Anderson NG. 2002. The human plasma proteome: history, character, and diagnostic prospects. Mol Cell Proteomics. 11:845–867.
- Bangs LB. 1987. Uniform Latex Particles Seradyn Inc. Seragen Diagnostics: Indianapolis, USA.
- Başar N, Uzun L, Güner A, Denizli A. 2007. Lysozyme purification with dye-affinity beads under magnetic field. Int J Biol Macromol. 41:234–242.
- Bayems V, Gurny R. 1997. Chemical and physical parameters of tears relevant for the design of ocular drug delivery formulations Pharm. Acta Helv. 72:191–202.
- Björhall K, Miliotis T, Davidsson P. 2005. Comparison of different depletion strategies for improved resolution in proteomic analysis of human serum samples. Proteomics. 5:307–317.
- Chen WY, Wu CF, Liu CC. 1996. Interactions of imidazole and proteins with immobilized Cu(II) ions: effects of structure, salt concentrations and pH in affinity and binding capacity. J Colloids Interf Sci. 180:135–143.
- Compeán-Jasso ME, Ruiz F, Martínez JR, Herrera-Gómez A. 2008. Magnetic properties of magnetite nanoparticles synthesized by forced hydrolysis. Mater Lett. 62:4248–4252.
- Dai J, Bao Z, Sun L, Hong SU, Baker GL, Bruening ML. 2006. High-capacity binding of proteins by poly(acylic acid) brushes and their derivatives. Langmuir. 22:4274–4281.
- Denizli A, Piskin E. 2001. Dye-ligand affinity systems. J Biochem Biophys Methods. 49:391–416.
- Feng S, Huang G. 2001. Effects of emulsifiers on the controlled release of paclitaxel (Taxol) from nanospheres of biodegradable polymers. J Control Release. 71:53–69.
- Ferreira L, Vidal MM, Gil MH. 2000. Evaluation of poly (-2-hydroxyethyl methacrylate) gels as drug delivery systems at different pH values. Int J Pharm. 194:169–180.
- Hamrita B, Nasr Hb, Remadi S, Chaïeb A, Chahed K. 2012. Enrichment methods for revealing lower molecular weight biomarkers in human breast plasma proteome. Afr J Biochem Res. 6:1–7.
- Horak D, Babic M, Mackova H, Benes M. 2007. Preparation and properties of magnetic nano- and microsized particles for biological and environmental separations. J Sep Sci. 30:1751–1772.
- Karakoç V, Yılmaz E, Türkmen D, Özturk N, Akgöl S, Denizli A. 2009. Selective separation of human serum albumin with Cu(II) chelated PHEMA based nanoparticles. Int J Biol Macromol. 45:188–193.
- Köse K, Denizli A. 2013. Poly(hydroxyethyl methacrylate) based magnetic nanoparticles for lysozyme purification from chicken egg white. Artif Cells Nanomed Biotechnol. 41:13–20.
- Kumar MNV, Bakowsky U, Lehr CM. 2004. Preparation and characterization of cationic PLGA nanospheres as DNA carriers. Biomater. 25:1771–1777.
- Laurent S, Forge D, Port M, Roch A, Robic C, Vander Elst L, Muller R. 2008. Magnetic iron oxide nanoparticles: Synthesis, stabilization, vectorization, physicochemical characterizations and biological applications. Chem Rev. 108:2064–2110.
- Leatherbarrow RJ, Dean PDG. 1980. Studies on the mechanism of binding of serum albumins to immobilized cibacron blue F3G A. Biochem J. 189:27–34.
- Ma ZY, Guan YP, Liu XQ, Liu HZ. 2005. Synthesis of magnetic chelator for high-capacity immobilized metal affinity adsorption of protein by cerium initiated graft polymerization. Langmuir. 21:6987–6994.
- Mahn A, Reyes A, Zamorano M, Cifuentes W, Ismail M. 2010. Potential cytokines enrichment using Albusorb™ or Albuvoid™ for albumin depletion. J Chromatogr B. 878:1038–1044.
- Montheard JP, Chatzopoulos M, Chappard DJ. 1992. 2-hydroxyethyl methacrylate (HEMA); chemical properties and applications in biomedical fields. Macromol Sci Rev Macromol Chem Phys. 32:1–34.
- Morita S, Kitagawa K, Ozaki Y. 2009. Hydrogen-bond structures in poly(2-hydroxyethyl methacrylate): infrared spectroscopy and quantum chemical calculations with model compounds. Vibrational Spectr. 51:28–33.
- Nishio K, Masaike Y, Ikeda M, Narimatsu H, Gokon N, Tsubouchi S, et al. 2008. Development of novel magnetic nano-carriers for high-performance affinity purification. Coll Surf B Biointerfaces. 64:162–169.
- Odabaşı M, Denizli A. 2004. Cibacron Blue F3GA-attached magnetic poly(2-hydroxyethyl methacrylate) beads for human serum albumin adsorption. Polym Int. 53:332–338.
- Patanarut A, Luchini A, Botterell PJ, Mohan A, Longo C, Vorster P, et al. 2010. Synthesis and characterization of hydrogel particles containing Cibacron Blue F3G-A. Coll. Surf A Physicochem Eng Asp. 362:8–19.
- Randolph ML. 1972. Biological applications of electron spin resonance. In: Swartz HM, Bolton JR, Borg DC, Eds. Quantitative considerations in electron spin resonance studies of biological materials. New York: Wiley, Chapter 3, pp. 119–155.
- Silva MAO, Arruda MAZ. 2009. An aqueous two-phase system as a strategy for serum Wave number (cm− 1) Characteristic Peak albumin depletion. Talanta. 77:985–990.
- Steel LF, Trotte MG, Nakajima PB, Mattu TS, Gonye G, Block T. 2003. Efficient and specific removal of albumin from human serum samples. Mol Cell Proteomics. 2:262–270.
- Tamahkar E, Babac C, Kutsal T, Piskin E, Denizli A. 2010. Bacterial cellulose nanofibers for albumin depletion from human serum. Process Biochem. 45:1713–1719.
- Türkmen D, Öztürk N, Elkak A, Akgöl S, Denizli A. 2008. Phenylalanine containing hydrophobic nanospheres for antibody purification. Biotechnol Prog. 24:1297–1303.
- Tüzmen N, Akdoşan F, Kalburcu T, Akgöl S, Denizli A. 2010. Development of the magnetic beads for dye ligand affinity chromatography and application to magnetically stabilized fluidized bed system. Process Biochem. 45:556–562.
- Urbas L, Brne P, Gabor B, Barut M, Strlic M, Petric TC, Strancar A. 2009. Depletion of high-abundance proteins from human plasma using a combination of an affinity and pseudo-affinity column. J Chromatogr A. 1216:2689–2694.
- Warder SE, Tucker LA, Strelitzer TJ, McKeegan EM, Meuth JL, Jung PM, et al. 2009. Reducing agent-mediated precipitation of high- abundance plasma proteins. Anal Biochem. 387:184–193.
- Yuan W, Yuan J, Zhou L, Wu S, Hong X. 2010. Fe3O4@poly(2- hydroxyethyl methacrylate)-graft-poly(ε-caprolactone) magnetic nanoparticles with branched brush polymeric shell. Polymer. 51:2540–2547.
- Zheng W, Gao F, Gu H. 2005. Magnetic polymer nanospheres with high and uniform magnetite content. J Magn Magn Mater. 288: 403–410.
- Zolotarjova N, Mrozinsk P, Chen H, Martosella J. 2008. Combination of affinity depletion of abundant proteins and reversed-phase fractionation in proteomic analysis of human plasma/serum. J Chromatogr A. 1189:332–338.