Abstract
In order to study the liver targeting of the N-galactosylated chitosan (GC) polymer in liver, we first conjugated the lactobionic acid with chitosan (CS) to obtain the carrier of GC with different degree of substitution of lactosyl group. Western blot was performed to detect the expression levels of the asialoglycoprotein receptors (ASGPR) in the cell lines of HepG2, SMMC-7721, and HL-7702. The protein level of ASGPR was lower in HepG2 compared to HL-7702 and SMMC-7721. Although all treated by CS, viabilities of HL-7702 and HepG2 did not experience any significant drop, while viability of SMMC-7721 decreased 15% on average from control. It was the first data about the inhibitory effect of GC on the liver cells. Fluorescein isothiocyanate (FITC) labeled GC (GC-FITC) was injected intravenously into mice at a dose of 0.02 μmol/mouse. GC-FITC showed maximum liver localization at 5 min and even detectable at 48 h after injection. Further, the accumulation of GC in liver was about 5.4-fold higher than that of CS. In conclusion, GC demonstrated its higher efficacy in drug liver targeting and thus could be a more promising drug or gene carrier in future therapies.
Introduction
Asialoglycoprotein receptor (ASGPR) is a transmembrane protein, and consists of two different subunits H1 and H2 (Ashell and Harford Citation1982). ASGPR mainly exists on the mammalian polygonal cell surface, and specifically recognizes the termini of galactose or N-acetylglucosamine residues of desialylated glycoprotein (Pricer and Ashwell Citation1971). Therefore, liver-targeting drug delivery may be achieved by conjugating the carriers to a ligand that can bind to ASGPR (Park et al. Citation2003, Rensen et al. Citation1997).
Chitosan (CS) is assembled with N-acetyl-glucosamine and glucosamine residues by (1, 4)-β-glycosidic bonds. Because of its biocompatibility, biodegradability as well as non-toxicity properties etc, CS has been widely used as drug carriers or gene vectors in the forms of tablets, capsules, pellets, beads, microspheres, micro, and nano-particles etc (Sandford Citation1989, Rao and Sharma Citation1997). A series of low molecular weight (Mw)-galactosylated polymers have been reported active or passive targeting the liver, in the way of being drug carriers or gene vectors (Jeong et al. Citation2005, Park et al. Citation2000).
In our previous work, we reviewed the liver targeting mediated by ASGPR (Liang et al. Citation2010), and synthesized a series of N-galactosylated chitosan (GC) with different degree of substitution (DS) of lactosyl group, the macromolecular pro-drug containing 5-fluorouracil with synthesized GC as carrier (Liang et al. Citation2011). In this study, we focused on the liver-targeting specificity of the GC derivatives containing different galactose moieties. GC with different DS of lactosyl groups was first synthesized under a variety of reaction conditions. The expression levels of ASGPR were determined in vitro by western blot. The viability of cell was also determined using 3-(4,5- Dimethylthiazol-2-yl)- 2,5-diphenyltetrazolium bromide (MTT) assay. Finally the distribution and localization of fluorescein isothiocyanate (FITC)-labeled GC (GC-FITC) in vivo were evaluated using the fluorescence measurement.
Materials
The Institute of Cancer Research (ICR) mice (male and female, 18–22 g) were provided by experimental animal center of Zhejiang Province (Hangzhou, Zhejiang, China). The human normal liver cell line HL-7702 and hepatoma cell lines SMMC-7721, HepG2 were obtained from Shanghai Cell Bank, Chinese Academy of Sciences (Shanghai, China).
CS was obtained from Qingdao Honghai Biotechnology Co., Ltd (Qingdao, Shandong, China) with 95% deacetylation degree and Mw 20 kda. Lactobionic acid (LA), FITC, and 1-ethyl-3- (3-trimethyl- amine-propyl) carbodiimide hydrochloride (EDC•HCl) were purchased from Aladdin's Corporate (Shanghai, China). Dulbecco's modified eagle medium (DMEM) and trypsin were purchased from Gibco (Grand Island, NY, USA). Fetal bovine serum was commercially obtained from Zhejiang Tianhang biological technology Co. Ltd. (Hangzhou, Zhejiang, China). MTT and dextran were obtained from Sigma-Aldrich (St. Louis, MO, USA). ASGPR1/2 (FL-291) was purchased from Santa Cruz Biotechnology (Danvers, MA, USA). Beta-Actin (β-Actin) and glyceraldehyde-3- phosphate dehydrogenase were obtained from Cell Signaling technology Co. Ltd. (Danvers, MA, USA). All other chemicals were analytical grade and purchased from Hangzhou Huipu Chemical Instrument Co. Ltd. (Hangzhou, Zhejiang, China).
Methods
Synthesis of GC
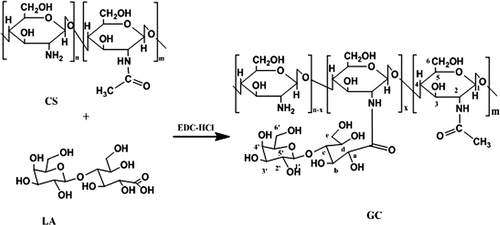
GC was synthesized based on the method in the literature (Liang et al. Citation2010). LA (1.1 –2.2 g) and EDC•HCl (1.4–2.8 g) were added to a mixture of CS (1.0 g) hydrochloric acid solution 0.5% (v/v) (40 mL). The mixture was stirred for 48–72 h at 30°C. The resulting product was purified using a dialysis tube against distilled water for 72 h, followed by lyophilization for 44 h. According to the catalyst feeding amount and reaction time differences, three samples: high level DS of lactosyl group in GC (GCH), middle level DS of lactosyl group in GC (GCM), and low level DS of lactosyl group in GC (GCL), were prepared, respectively. Their structure was confirmed by proton nuclear magnetic resonance (1H-NMR) spectra using a Bruker Avance 400 spectrometer. GCH, 1H-NMR (D2O) δ: 1.87 (3H, s), 3.38˜3.77 (16H, m), 4.06 (1H, s), and 4.38 (1H, m). 1H-NMR spectra of GCM and GCL were similar to the spectra of GCH. The synthetic scheme of GC was made using ChemDraw Ultra 7.0.
The Mw of the polymer was determined using gel permeation chromatography (GPC).GPC was performed at room temperature using a high-performance liquid chromatography pump equipped with differential refractive index detector (models 515 and 2410, respectively, both from Waters, Milford, MA, USA). Tsk-Gel G4000SWXL (7.8 × 300 mm) (Tosoh, Tohoku, Japan) was used as a column. The buffer solution containing 0.1 M sodium acetate and 0.1 M acetic acid, pH = 4.8, was used as the elution solvent at a flow of 0.8 mL/min. Dextran was used as a Mw calibration marker, and its peak Mws (MP) are 2.0 × 10⁶, 1.88 × 10⁵, 7.69 × 10⁴, 1.05 × 10⁴, and 3.2 × 10³. The values of DS of lactosyl group in GC and the Mw of GC are shown in using Microsoft Word.
Table I. The values of DS of lactosyl group in GC and the Mw of GC.
Conjugation of GCH and CS with FITC
GCH (0.5 g) was dissolved in 0.1M sodium bicarbonate buffer (50 ml, pH 9.0). Thirty-five milligram of FITC was dissolved in 50 ml acetone, and then slowly added to the solution above. The mixture was stirred at 40°C for 18 h in dark and was then purified using a dialysis tube against distilled water until no fluorescence was detected in the dialysate, followed by lyophilization, obtaining GCH labeled with FITC (GCH-FITC). The labeling efficiency of GCH-FITC was 1.34% (w/w), determined by spectrophotometry at 490 nm wavelength. CS labeled with FITC (CS-FITC) was synthesized based on the method described above, and the labeling efficiency of CS-FITC was 1.42% (w/w).
Body distribution and biodegradability of GCH-FITC in mice
After intravenous administration (i.v.) of GCH-FITC or CS-FITC in ICR mice at a dose of 0.2 mL (0.1 mM), the mice were sacrificed at 5 min, 30 min, 1 h, 8 h, 24 h, and 48 h time points, and the heart, liver, spleen, lung, and kidney were collected and accurately weighed. A 10-fold volume of phosphate-buffered saline (PBS) was added, and the mixture was homogenized on ice with a glass homogenizer. The fluorescence intensities in tissue homogenates were determined by multifunctional micro plate detection (Ex = 489 nm, Em = 520 nm). The distribution levels of GCH or CS were calculated using the standard calibration curve. Tissue distribution of GCH-FITC and CS-FITC in ICR mice is presented in a graph in using Microsoft Excel.
To preparing the standard calibration curve, the liver, spleen, lung, and kidney of normal ICR mice was, respectively, homogenized and mixed with PBS and GCH-FITC or CS-FITC separately to obtain 1, 10, and 100 μM standard solution. The fluorescence intensity of the standard solution was measured with the multifunctional enzyme immunoassay (Ex = 489 nm, Em = 520 nm).
Expression of ASGPR in human normal liver and hepatoma cell lines
The cells of HL-7702, SMMC-7721, and HepG2 were cultured at 37°C in DMEM supplement containing 10% (v/v) fetal calf serum, 100 U/L penicillin, and 100 mg/L streptomycin in 5% (v/v) CO2. For total cellular protein, cells were lysed in buffer containing 1.6 mM hexadecyl trimethyl ammonium bromide, 40 mM NaCl, 0.6 mM ethylene diamine tetraacetic acid, 3 mM Tris-HCl, and 0.02 mM phenylmethanesulfonyl fluoride (PMSF), and centrifuged (12,000 rpm) for 10 min at 4°C. After protein quantification, the extracted protein was subjected to sodium dodecyl sulfate polyacrylamide gel electrophoresis (SDS-PAGE) in a 10% (v/v) sodium dodecyl sulfate (SDS) gel, and the protein was transferred to nitrocellulose membrane. After blocking, the blots were incubated for 1 h at 25°C separately with the primary antibodies of ASGPR1/2 (FL-291) at 1:200 for 2 h, followed by incubation with secondary antibody (goat anti-rabbit IgG-HRP) at a 1:1000 dilution for 2 h. Immunoreactive bands of ASGPR1/2 (FL-291) and β-actin mark were visualized using enhanced chemiluminescence reagents. ASGPR1/2 (FL-291) and β-actin mark activities were quantified by densitometry of autorad- iographs (Bio-rad, CA, USA). ASGPR expression in the human normal liver cell line is shown graphically in using Microsoft Excel.
Cell viability assay
The cell lines of HL-7702, SMMC-7721, or HepG2 were plated out at a density of 7.5 × 10³ per well in 96-well flat-bottom plates and allowed to attach and grow for 24 h. CS, GCH, GCM, or GCL was added at the required concentration (10 − 6 M, 10 − 7 M, and 10 − 8 M). After a 72-h incubation in continuous drug exposure, MTT (100 μL, 1 g/L) was added to each well. Plates were kept in the dark at 37° C for 4 h. After removing the medium and MTT, MTT-formazan crystals were dissolved in acidified isopropanol containing 0.04 mol/L HCl (150 μL/well). The plates were kept in the dark for 30 min, and the absorbance was measured at 570 nm with multi-well plate reader (Model 680, Bio-Rad). The proliferation inhibition of CS, GCH, GCM, and GCL on the cell lines is shown graphically using Microsoft Excel. The percentage of cell viability was calculated according to the following formula:
Percentage of cell viability = (absorbance value at tested well/absorbance value at control well) × 100%.
Statistical methods and strategies
Data are expressed as mean ± SD. Statistical significance of the differences between groups was analyzed by one-way ANOVA followed by Newman–Keuls multiple comparisons tests using SPSS 10.0 for windows. *P < 0.05 (or ΔP < 0.05) was considered statistically significant.
Results and discussion
Synthesis of GC
GC was synthesized as previously reported (Liang et al. Citation2011). shows the synthetic approach. The SD of lactosyl group in GC was calculated by comparing the characteristic peak areas of LA group with original acetamide group of CS. By changing the feed ratio of LA and the reaction time, the different DS of lactosyl group in GC was obtained, namely GCH, GCM, and GCL. The values of lactosyl group in GC and the Mw of GC and CS are listed in .
Figure 1. The synthetic scheme of GC (Liang et al., Citation2011).
Body distribution of GCH-FITC in mice
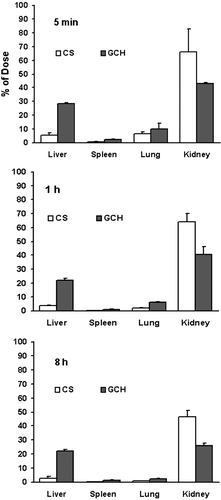
shows the percentage of GCH-FITC and CS-FITC in liver, spleen, lung, and kidney at 5 min, 1 h, and 8 h after i.v. at a dose of 0.2 mL per mouse. The amount of GCH-FITC in liver was 28.4% (w/w), 21.9% (w/w), and 22.2% (w/w) at 5 min, 1 h, and 8 h respectively, while 5.2% (w/w), 3.3% (w/w), and 2.9% (w/w) for CS-FITC. Notably, the percentage of GCH-FITC or CS-FITC in spleen and lung was very low. In kidney, GCH-FITC was gradually reduced from 43.0% to 26.2% of the dose from 5 min to 8 h, while from 66.0% (w/w) to 46.6% (w/w) for CS-FITC. Thus, from the data in it can be deduced that GCH-FITC is not combined with other organs, and will be mainly excreted through the kidney. The same results also proved that GCH group by our preparation could maintain high accumulation in mice's liver tissue.
Biodegradability of GCH-FITC in liver
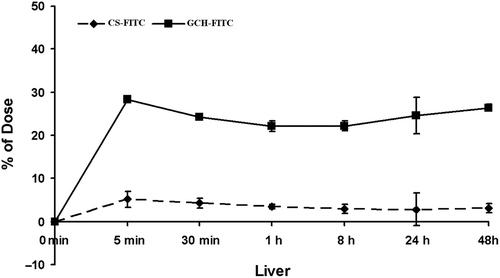
The body distribution of GCH-FITC and CS-FITC was determined in liver tissue after the treatment (intravenously) of the compounds dissolved in saline (1 × 10− 4 M) at a dose of 0.2 mL per mouse (). The concentrations of GCH-FITC and CS-FITC reached the maximum amount at 5 min and fell down slowly, especially at 30 min (*P < 0.05). Interestingly, the peak concentration of GCH-FITC in liver was 5.4 times more than that of the CS-FITC. After 30 min, however, there was no difference for GCH-FITC in liver tissue (*P > 0.05). It was proved that the lactose residues in GC could promote the aggregation of GC in the liver tissue and less biodegradation.
ASGPR expression in human normal liver and hepatoma cell line by western blot
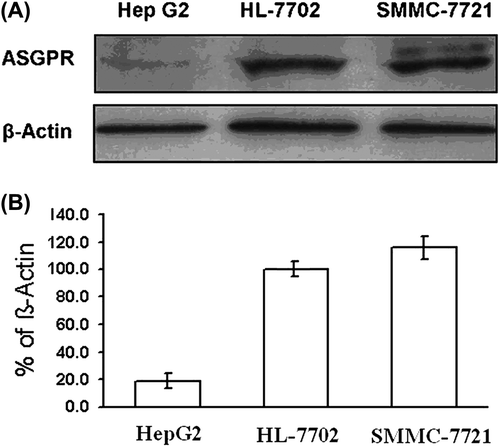
The ASGPR expression in human normal liver and hepatoma cell line is shown in . The expression levels of ASGPR in SMMC-7721 and HepG2 were 115.8% and 18.9%, respectively normalized to HL-7702 as the standard (100%). The results demonstrated that SMMC-7721 expressed more abundant ASGPR than HepG2.
Uptake of GC and CS by hepatoma cell
The experiment was divided into five groups: GCH group, GCM group, GCL group, CS group as the negative control, and the culture solution as blank. The experiment results are shown in . The concentrations of GCH, GCM, GCL, and CS were 10 −8M, 10 −7M, and 10 −6 M, respectively.
Figure 5. The proliferation inhibition of CS, GCH, GCM, and GCL on the cells of SMMC-7721 (A), HepG2 (B) determined by MTT assay. (mean ± SD, n = 8). *P < 0.05, **P < 0.01 versus control; △P < 0.05,versus CS.
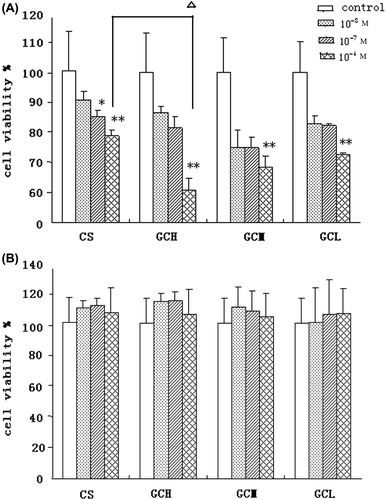
The CS is known for demonstrating antitumor effect on hepatoma cells (Suzuki et al. Citation1986). Thus the extent of CS inhibitory effect to hepatoma cell viability reflects its hepatoma cellular uptake rate. As indicated in , the inhibitory effect of GCH is stronger compared with that of CS, and all treated by CS or GCH at the concentration of 10 − 6 M, viabilities of HL-7702 and HepG2 did not experience any significant drop, while viability of SMMC-7721 decreased significantly. However, as shown in this was not the case for HepG2 cells. Such a phenomenon is intriguing and is possibly because SMMC-7721 has demonstrated more abundant ASGPR expression than HepG2 (). This higher level of ASGPR expression may lead to higher GC uptake rate, and thus lead to more resultant inhibition to SMMC-7721 than to HepG2. Together with effects of the DS of lactose residues, all these results suggested that the inhibitory effects of CS to hepatoma cell are tightly influenced by LA conjugation and ASGPR expression.
Toxicity of GC and CS in human normal liver cell line HL-7702
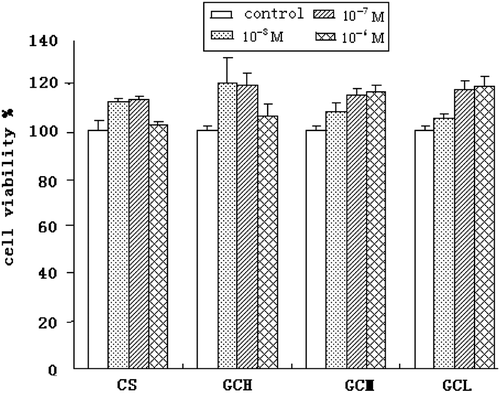
From the cytotoxicity MTT assay results in , it is evident that the viability of HL-7702, an ASGPR-expression human liver cell line, was not affected by GC and CS. This suggested that CS and GC presented non-toxicity to normal liver cells.
Conclusions
GC specifically accumulated in the liver with a long-term stability and was uptaken by hepatoma cell through the ASGPR, and has no toxicity in normal liver cells. To our knowledge, this was the first data report of GC's inhibitory effects on both normal liver and hepatoma cell lines. These results therefore provide valuable information to develop the chitosan drug conjugate systems in the future.
Declaration of interest
The authors report no declarations of interest. The authors alone are responsible for the content and writing of the paper.
This work was supported by Natural Science Foundation of Zhejiang Province (Grant No.Y207790), Health Bureau of Zhejiang Province (Grant No.XKQ-01001), and Science and Technology Department of Zhejiang Province (Grant No. 2012F10005).
References
- Ashell G, Harford J. 1982. Carbohydrate-specific receptors of the liver. Annu Reu Biochem. 51:531–554.
- Jeong YI, Seo SJ, Park IK, Lee HC, Kang IC, Akaike T, Cho CS. 2005. Cellular recognition of paclitaxel-loaded polymeric nanoparticles composed of poly(gamma-benzyl-l-glutamate) and poly(ethylene glycol) diblock copolymer endcapped with galactose moiety. Int J Pharm. 296:151–161.
- Liang MH, Ma Z, Wang ZY, Shen ZR. 2011. Synthesis and characterization of n-galactosylated-chitosan-5-fluorouracil acetic acid conjugate. Chin Pharm J. 46:1677–1680.
- Liang MH, Shen ZR, Ma Z, Wang ZY. 2010. Progress on ASGPR- mediated hepatic targeting. Chin J Mod Appl Pharm. 2:109–114.
- Park IK, Yang J, Jeong HJ, Bom HS, Harada I, Akaike T, et al. 2003. Galactosylated chitosan as a synthetic extracellular matrix for hepatocytes attachment. Biomaterials. 24:2331–2337.
- Park YK, Park YH, Shin BA, Choi ES, Park YR, Akaike T, Cho CS. 2000. Galactosylated chitosan-graft-dextran as hepatocyte-targeting DNA carrier. J Controlled Release. 69:97–108.
- Pricer WE, Ashwell G. 1971. The binding of desialylated glycoproteins by plasma membranes of liver. J Biol Chem. 246:4825–4833.
- Rao SB, Sharma CP. 1997. Use of chitosan as a biomaterial: studies on its safety and hemostatic potential. J Biomed Mater Res. 34:21–28.
- Rensen PC, Herijgers N, Netscher MH, Meskers SC, Eck M, Berkel TJ. 1997. Particle size determines the specificity of apolipoprotein e-containing triglyceride-rich emulsions for the ldl receptors versus hepatic remnant receptor in vivo. J Lipid Res. 38: 1070–1084.
- Sandford P. 1989. Chitosan: commercial uses and potential applications. Skjåkbraek G, Anthonsen T, Sandford P, Eds. Chitin and Chitosan. London, UK: Elsevier Applied Science, pp. 51–69.
- Suzuki K, Tokoro A, Okawa Y, Suzuki S, Suzuki M. 1986. Effect of N- acetylchito-oligosaccharides on activation of phagocytes. Microbiol Immunol. 30:777–787.

