
Abstract
The influence of polyethylene glycol (PEG) molar ratio on the nanoparticles (NPs) properties is described herein. Especially, a facile and nondestructive determination route has been raised to quantify the hemoglobin (Hb) amounts in NPs via an internal standard FTIR method. The subsequent results indicated that, briefly, the PEG molar ratio did negligible influence on the size distribution of NPs, however, it did have great effect on the NPs zeta potential and hydrophilicity as well as the Hb loading amount. These findings highlight that the PEG density on the surface is a key parameter affecting the NPs properties.
Introduction
A comprehensive study of the preparation of polymeric nanoparticles for the colloidal drug/protein delivery system has been undertaken. Incorporation of Hb in polymeric nanoparticles (HbPN) is an efficiency strategy for preparing the blood substitute (CitationChang 2010) which mimics the structure of the native red blood cells (RBCs) to provide the ability to bind/deliver oxygen to tissues in body (CitationChang 2006). Polymers, such as poly(D,L-lactide) (PLA) and poly(ε-caprolactone) (PCL), have been extensively used as core-materials for the nanoparticles production because of their excellent biocompatibility, biodegradability and incorporation capability for hydrophilic drugs, proteins and plasmid DNA. However, due to their hydrophobic surface and superficial negative charges, these common polymeric drug nanoparticles have affinity to serum proteins, and then are rapidly eliminated by the mononuclear phagocyte system (MPS), which makes the therapy inefficient. To address this problem, much attention has been paid on producing a nonspecific protein repelling surface by surface modification methods (CitationChen et al. 2008). In particular, the usage of polyethylene glycol (PEG) has been advocated on account of its low toxicity and biocompatibility, its high hydrophilicity and neutral charges that can, in principle, be tailored to modify the hydrophobic surface to decrease the nonspecific interaction of nanoparticles with serum components and prolong the nanoparticles half-life time in bloodstream (CitationSato et al. 2007, CitationKim et al. 2008).
Therefore, it is necessary to primarily evaluate PEG effect on the physicochemical properties of nanoparticles. Up to now, many studies have highlighted that the physicochemical characteristics of nanoparticles are influenced by PEG molecule's weight (CitationSimard et al. 2005). However, details on the effect of PEG molar ratio have never been discussed, let alone investigating the potential mechanism. In this respect, a major thrust for this research was to study the mechanism involved in the influence of the PEG molar ratio on the physicochemical properties of HbPN.
On the other hand, as one of the major physicochemical properties besides the size distribution and the zeta potential, drug loading amount mainly influences the therapy of nanoparticles. For instance, it is well learned that Hb is composed of four polypeptide chains and each of them can bind one O2 molecule via iron ion. In this respect, the Hb amount in HbPN, to a great extent, determines the oxygen delivery/carrying capacity of the nano-blood-substitute. Owing to the sensibility of proteins to strong acid and alkali (CitationMora, 1965, CitationFavilla et al. 1997) and the porous microstructure of the present HbPNs (CitationZhang et al. 2008b) allowing small molecules running in-and-out freely, the commonly used examination strategies are unavailable, which are based on the principle of the extraction or centrifugation of protein from the nanoparticles following the core- materials destroyed by strong acid or alkali (CitationKim et al. 2008, CitationMcCarron and Hall 2008, CitationLi et al. 2008, CitationPuri et al. 2008, CitationPapadimitriou et al. 2008). Therefore, it is desirable to engineer an alternative facile and precise strategy that can investigate the protein level in nanoparticles, especially for proteins.
Fourier transform infrared spectroscopy (FTIR) has been considered a powerful “in-situ” analytical tool, which allows in a short time, to quantify the concentration of several specific chemical compounds (CitationJiang et al. 2008, CitationTorrado et al. 1999, CitationZhang et al. 2008a). Moreover, in the previous investigations, the application of FTIR for qualitative analysis of structure and composition of polymeric nanoparticles (CitationAn et al. 2008, CitationHamoudeh et al. 2008, CitationGao et al. 2008) has demonstrated that the IR spectra could penetrate the polymeric nanoparticles and provide information related to the changes of specific functional groups directly. Taking these previous informations into account, it is suggested the possibility to quantify the protein in polymeric particles by FTIR. However, there is no reference available up to date. Therefore, another major objective of this work is to develop an FTIR method as an accurate strategy for quantifying Hb content in HbPN to avoid the aforementioned embarrassment. The technique involves an internal standard to compensate for the variation in sample presentation and instrumental variation between different samples, and the direct comparison of the intensities of specific IR peaks among different spectra of Hb and internal standard substance. Therefore, the Hb content is calculated subsequently (CitationDavis et al. 1999).
In this paper, the effect and the possible mechanism of PEGylation on the physicochemical characteristics of HbPN such as the size distribution, drug loading, zeta potential and hydrophilicity were studied. The HbPN was fabricated by double emulsion and solvent diffusion/evaporation method from monomethoxy-poly(ethylene glycol)-b-poly(ε-caprolactone) (mPEG-PCL) diblock copolymers with different molecular weight and different molar ratio of [CL] to [EG]. To detect the amount of the encapsulated Hb, a novel FTIR method, with polyacrylonitrile (PAN) as the internal reference standard, was developed based on the characteristic un-overlapped IR absorbances at 1540 cm−1 of Hb (amide II) and the peak at 2241 cm−1 of PAN (–C≡N). Then, an equation correlating the peak height ratio of Hb and PAN with the weight ratio of them was established. The assay evaluations including the linearity of calibration curve, precision, recovery were also performed. Based on this proposed method, the Hb loading in HbPN with different polymer composition is calculated and further discussed.
Experimental
Materials
Lyophilized bovine Hb was purchased from YuanJu Biotechnology Company (Shanghai, China). Poly(ε-caprolactone) (PCL) and monomethoxy-poly(ethylene glycol)-b-poly (ε-caprolactone) (mPEG-PCL) diblock copolymers with different PEG mole fractions were purchased from Chengdu Institute of Organic Chemistry, Chinese Academy of Science (Chengdu, China). The polymers were characterized with regard to their molecular weight by gel permeation chromatography (GPC). The following polymers were synthesized (1) PCL with Mw = 45,000, (2) PCL(9)-mPEG(1) with Mw = 68,000 and (3) PCL(7)-mPEG(3) with Mw = 40,000. The number in parenthesis following each block in the word PCL-mPEG designates the molar fraction of the respective block. The molecular weight of the mPEG used were measured by GPC to be Mw = 6000. PAN was supplied by Nitrile department of Shanghai Petrochemical Company Ltd. Span80, Tween 80 and potassium bromides (S.P.) were all obtained from Sinopharm Chemical Reagent Co., Ltd (Shanghai, China).
Preparation of the blank polymeric nanoparticles (BPN) and HbPN samples
HbPN were prepared by a multiple emulsion-solvent evaporation technique as described previously (CitationZhao et al. 2007). In brief, 0.5 ml aqueous solution of Hb (0.15 g/ml) was emulsified in the organic phase containing 10 mg polymer (oil phase) in methylene chloride with a probe sonicator (50 W for 15 s) (JYD-900, Zhixin Instrument Co., Ltd., Shanghai, China) to form a primary water-in-oil emulsion. This initial emulsion was further mixed in an emulsifier-containing aqueous solution to make a W1/O/W2 double emulsion with the homogenizer. The double emulsion was then poured into 110 ml water solution, and the system was stirred for 4 h to completely remove the solvent through evaporation.
To figure out the effect of polymer composition on the Hb loading, PCL and copolymers with different CL/EG ratios (PEG mole fraction of 10 and 30%, respectively) were applied to prepare HbPN using the identical preparation process, which were named HbPN0, HbPN10 and HbPN30, respectively. The HbPN was collected by Lab Scale TFF system (Millipore Corporation, USA) and washed three times with distilled water before lyophilization.
To establish the calibration curves for determining the Hb content in HbPN, the corresponding blank polymeric nanoparticles (BPN) were also prepared by the same multiple emulsion-solvent evaporation technique except with H2O as the inner water phase instead of bovine Hb solution.
Physicochemistry properties of polymeric nanoparticles
Approximately 100 mg HbPN were re-dispersed in 10 ml phosphate buffer saline (PBS, pH 7.4) for several minutes using an ultrasonic bath. The size distributions and the zeta potential of the HbPN suspension were determined at 25°C by Dynamic Light Scattering (DLS) using Zetasizer Nano ZS (Malvern Instruments Ltd., UK) with an angle detection of 90°. Morphology of particles was observed by a transmission electron microscope (TEM, Hitachi H-7500, Japan).
Advancing sessile drop water contact angles were measured on PEG modified and unmodified surfaces using JJC-1 static contact angle equipment (Changchun No. 5 Optical Instrument Co. Ltd.). Milli-Q water was used with a drop volume of approximately 0.02 ml. Results are presented as an average of eight measurements on at least three different surfaces.
FTIR measurement assay
The infrared absorbance spectra were recorded using NICOLET 5700 (Thermal Nicolet, USA) between 4000 and 400 cm− 1. Thirty-two scans per sample were collected in absorbance mode at a spectral resolution of 4 cm−1. All spectra were ratio against a background of potassium bromide spectrum under the same circumstance. The data were processed by omnic E.S.P software. The mixture pellets for determination were pressed on YP-2 tablet press machine (Shanyue Scientific Instrument Factory, Shanghai, China).
It is internationally recognized that validation is necessary in analytical laboratories. The use of validated methods is important for an analytical laboratory to show its qualification and competency. Therefore, a serial of validation methods is detailed as follows.
Linearity of calibration curves
To determine the Hb content in HbPN with different molar ratio of PCL/PEG, the corresponding calibration curves were separately established. The standard samples consisting of Hb, PAN and BPN prepared from PCL or mPEG-PCL (PEG mole fraction of 10 and 30%, respectively) were accurately weighed in amounts according to the weight ratio column shown in . In order to avoid the weighing error, we prepared the total weight of 2000 mg of calibration samples. The calibration curves were established over five analyte-levels in triplicate, respectively, and plotted between amounts ratio of Hb and PAN versus average response (peak height ratio of these two analytes).
Table I. The five ratio-points of calibration standards weighed carefully for the four linear regression curves.a,b,c
To maintain the same light distance of propagation, all the samples were weighed accurately as 2 mg and ground thoroughly into a fine powder with 198 mg (± 0.1 mg) potassium bromide and pressed into disks (0.5 mm in thickness) with a total amount of 200 ± 0.1 mg.
Precision
The precision of the method was evaluated by inter- and intra-day repeatability. The validation samples of each type of polymeric nanoparticles were analyzed in quintuplicate on more than three different days to determine intra- and inter-day precision with the percent relative standard deviation (R.S.D.) round the mean as the validation data of the low, medium and high Hb amount in calibration curves, respectively. The acceptable intra-day precision should be within 5% and the inter-day should be less than 15% (CitationGuidance for Drug Research Technique 2005 National Food and Drug Administration 2006 China).
Recovery
Recovery (%) was achieved in terms of comparison of the difference of concentrations of after/before spiked process. Levels of recovery were determined at three fortification levels of low, medium and high level in standard samples. The un-spiked standard samples were also analyzed as control. The recoveries of samples at each level of concentration were evaluated and calculated according to the following formula (Eq. 1).
*MC is the short of measured concentration; **UC is the short of unspiked sample concentration; ***SC is the short of spiked sample concentration.
The recoveries show the closeness of agreement between the observed value and the theoretical value after added the known amount analytes. The ideal recovery ranges should be between 95% and 105%, and the measured concentration should be in the linear range of linear regression equations.
Method applied to determine the Hb loadings in HbPN
The Hb contents in HbPN with PCL or mPEG-PCL (PEG mole fraction of 10 and 30%) diblock copolymer were determined by the proposed FTIR method. The as-prepared HbPN and standard PAN were mixed in the ratio of 1:4 (as shown in ). The mixture was grounded and homogenized thoroughly with potassium bromide into a fine powder with total amount of 200 ± 0.1 mg and pressed into disks around 0.5 mm in thickness.
Table II. The actual weights of nanoparticles and PAN of each sample with the ratio be around 1:4.
Results
Physicochemistry characteristics of the HbPN
In order to avoid the influence of particles shape and size on immune response, the particles size should be stipulated among 70–220 nm. The multiple emulsions-solvent evaporation technique was employed to prepare uniform-sized NPs. As shown in , the mean particles size of HbPN0, HbPN10 and HbPN30 was about 180 nm with a narrow size distribution. It also can be found that the PEGylation had no obvious effect on the particle size and polydispersity index. TEM image showed that all NPs exhibited a spherical shape (), indicating a potential of long-term circulation in blood stream. It was in accordance with the size distribution determination (). From the morphology of the HbNPs, it could be found that the membrane of the NPs were rather thick with uneven surface. This result is different from previous study of other PLA-PEG-based HbPN system. It has been reported that (CitationGao et al. 2013), after encapsulating the soluble complex of PolySFHb-SOD-CAT-CA, the PLA-PEG NPs become homogeneous particles with core-shell structure. This phenomenon is mainly due to the absence of the surfactant residue on the surface of the HbPNs.
Table III. Particles size and surface charge of hemoglobin-loaded polymeric nanoparticles encapsulated by four types of polymer.
On the contrary to size distribution, the surface electrical potential distribution of the HbPN varied with the mole fraction of PEG chains pronouncedly. All HbPN were negatively charged and the ζ potential of the HbPN monotonically varied with the increase of the PEG content in copolymer. The higher the PEG content, the lower the absolute value of ζ potential was achieved.
The measured contact angle exhibited by a liquid droplet contacting the surface of an examined substrate characterizes the hydrophilic/hydrophobic properties of that substrate. This angle is highly dependent on the surface energy of the substrate and the surface tension of the liquid. In the case of complete wetting, the droplet spreads out over the substrate and leads to a contact angle approaching 0°. For partial wetting, the contact angle lies in the 0–180° range, where materials with stronger hydrophobicity display larger contact angles (CitationLiu et al. 2013). As shown in , the contact angle of pure PCL was large of 120.5 ± 0.7°, indicating the hydrophobicity of such polymer. In contrast, the diblock copolymer was more prone to wet in aqueous media, especially for mPEG-PCL copolymer with PEG mole fraction of 30% which had a super-hydrophilic property with contact angle of 30.9 ± 1.8°. The contact angle results clearly suggested that the presence of a PEG segment in the polymer attributed to a reduction of contact angle greater than 100°, with the higher the PEG content in copolymer, the more hydrophilicity of the polymer.
FTIR determination of Hb content in nanoparticles
Selection of the internal standards and the characteristic peaks
Peak of the optimum compound selected as the internal standard for quantification in IR analysis would be isolated, no interference with other peaks (CitationZhang et al. 2008a). Besides, the optimum standard must be stable powder which should be inert to other compounds in the system. In this case, PAN was considered to be the most suitable internal standard for our system. The full spectra of Hb, PAN, PCL and other copolymers used in this experiment in the wavelength region from 2600 cm−1 to 1000 cm−1 are presented in .
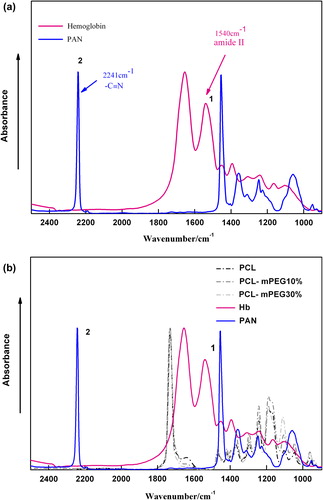
As shown in , just like other proteins, the prominent signals of Hb appear at about 1655 cm−1 and 1540 cm−1 corresponding to the stretching vibrations of –COO– (amide I) and the bending vibration of N–H (amide II) (CitationZhao et al. 2007), which can be applied as universal probes for proteins because the peptide amide bond is a basic and repetitive functional group in proteins (CitationMarcotte et al. 2007). In the case of PAN, the maximal absorbance peak exists at 2241 and 1456 cm−1 (see ), which could be attributed to the characteristic of stretching vibration of –C≡N and deformation vibration of CH2. In this proposed method, the absorbance peak at 1540 cm−1 was selected to stand for Hb and 2241 cm−1 was for PAN. The other peaks at 1655 cm−1 and 1456 cm−1 were not recommended because they were interfered with other peaks derived from the PCL and its copolymers, as shown in .
Additionally, to obtain stable and homogeneously emulsification system, many surfactants, such as Tween-80 and Span-80, were introduced in the system. Therefore, the IR spectrum of Span-80, Tween-80 and the BPN were needed to compare. As demonstrated in , Tween-80 had no absorbance around 1540 cm− 1 and 2241 cm−1. With respect to Span-80, it had a weak absorbance at 1562 cm−1 which almost disappeared after the BPN forming. It was supposed that the Span-80 maybe eluted with the ultra-pure water during the collection procedure.
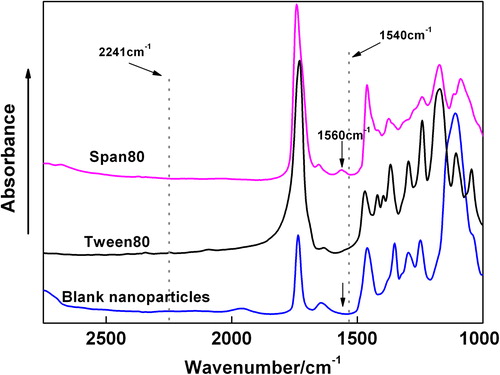
Based on these results, the selection of PAN as internal standard and the definition of specific absorbance peak are allowed to possibly quantify the hemoglobin content in nanoparticles.
The establishment of calibration curves
Owing to the samples presentation of solid state, a series of Hb-BPN-PAN physical mixtures with different composition was used to establish the calibration curves for Hb assay in HbPN. And the Hb-BPN-PAN mixtures were accurately weighed according to the weight ratios in .
On the basis of the internal standard principle for FTIR spectroscopy, the standard curve generated by plotting peak heights ratios (hHb/hi.s.) versus concentrations ratios (WHb/Wi.s) was analyzed using linear regression method:
A and B represent the slope rate and intercept of the calibration curves, which can be obtained from the calibration curves.
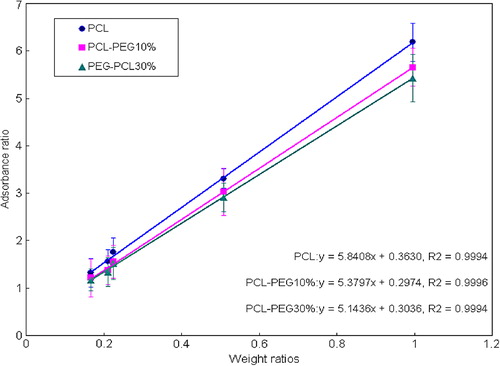
Five level ratio-points of the absorbance of Hb (at 1540 cm−1) to a baseline point of PAN (at 2241 cm−1) corresponding to different weight ratio were used to demonstrate the calibration relation (). The calibration equations showed the strong linear correlations with the coefficient R2-value > 0.9994, indicating excellent correlation and reasonable accuracy (CitationJohnson and Harach 2004). These equations would be used to predict the Hb content of the polymeric nanoparticles samples.
Assay evaluation
Linearity of the calibration curves. The calibration curves in expressed the relationship between the absorbance heights ratio at 1540 cm−1 of Hb to a baseline point at 2241 cm−1 of PAN and the corresponding weight ratio of Hb and PAN. The confidence coefficients (R2), a very important parameter of the calibration curve for verifying the reliability, were all > 0.9994, indicative of the good linear correlations with excellent reliability within a range.
Recovery investigation. The accuracy (percent recovery) of the developed method for the determination of Hb content in HbPN mixture was investigated and the results were listed in . The recoveries of samples were all less than 5%, which was in agreement with the guidance for chemical: drug analytical procedures, methods validation and controls documentation (CitationGuidance for Drug Research Technique 2005 National Food and Drug Administration 2006 China).
Table IV. Accuracy (percent recovery) of the method for the determination of Hb content in Hb-BPN mixture (n = 5).
Precision test. The average precision with percent relative standard deviation (RSD%) for each sample was calculated ().
Table V. The intra- and inter-day precision (relative standard deviation) of the method for the determination of Hb content in Hb-BPN mixture (percent of drug loading).
Obviously, the relative standard deviations of intra-day precision were all lower than 5%; in the case of the inter-day precision, the data were all lower than 15%, which were all acceptable for the FTIR assay (CitationGuidance for Drug Research Technique 2005 National Food and Drug Administration 2006 China). Considering the storage of HbPN, there were many factors which could probably affect the final assay results: for example, in spite of samples being stored in desiccator at 4°C, the loss of water would inevitably happen which could result in weight loss. Besides that, the losses in samples detection and the different circumstances in different days would also be the reasons for the high deviation of inter-day assay. The relative standard deviations of the intra-day precision were low, indicating that the sample preparation and subsequent FTIR analysis were very reproducible (CitationMayer-Helm et al. 2008).
Determination of the Hb loaded in HbPN
With respect to hemoglobin encapsulated nanoparticles, the Hb amount can be easily calculated by following Eq. (3):
where ᴪ = Wi.s./A × WNp is a constant parameter in this formula.
In the present work, the Hb loading in HbPN prepared from PCL and mPEG-PCL, (PEG mole fraction of 10 and 30%, respectively) were investigated by FTIR with PAN as the internal standards and subsequently calculated from above Eq. (3), respectively; and the results were presented in . It suggested that, when the PEG percentage in polymer increased from 0 to 10%, 10% improvement of the drug loading capacity in HbPN was observed. However, it was also found that too much PEGylation percent would conversely hamper the drug loading capacity. When PEG content was up to 30%, the Hb loading decreased sharply, indicating a typical PEG-dependent manner. These results were very interesting.
Discussion
A typical double emulsification-solvent evaporation process employed here to produce HbPN included four stepwise: (a) primary emulsification (W1/O): Hb-containing aqueous phase was emulsified into an oil phase consisting of biodegradable polymer and surfactants, (b) double emulsification (W1/O/W2): the primary emulsification was in a solution of the surfactant in water (external aqueous phase) to form a final W1/O/W2 double emulsion by high-speed mixing, (c) solidification: the organic solvent was removed by evaporation under atmospheric pressure at room temperature and then solid nanoparticles were formed, (d) purification: nanoparticles were isolated by centrifugation and purified through washing with distilled water before lyophilization. It became obvious that the basic scientific principle governing the nanoparticles formation was physical mixture without any chemical reaction. Subsequently, the freeze-drying and grind process would also not alter the components of nanoparticles. From this viewpoint, the HbPN can be considered as a mixture of Hb and BPN fabricated by the same polymer and process. Therefore, a series of Hb-BPN standard samples were produced to obtain calibration curves. Good correlations for various copolymers calibration curves have been shown on . In general, the R2 of linear regression of observed versus fitted parameters is often used as a first criterion of the predictive qualities of a model. If R2 is > 0.8, the model allows for quantitative prediction (CitationArtz et al. 2008). Our analysis of the linear regression for various HbPN indicated the models would be adequate to allow for quantification as the R2 were all above 0.9994. In the same way, the choice of the internal standard and specific absorb peaks were imposed by the establishment of calibration curves consequently.
In addition, other validation studies have also shown reasonable prediction of this model. It was observed that the values predicted by the calibration curves were in good agreement with the theoretical values. The low %RSD of recovery and precision test indicated that the method was precise and reproducible. This clearly inferred that the proposed FTIR method was proper for the determination of hemoglobin content in NPs.
As shown in , the present study demonstrated that, in the case of PEG6K, a reversal point was found, in terms of PEG surface density, resulting in maximum amount encapsulated into the PCL core. It has been reported that some potential factors, such as the affinity of the drug with the shell polymer, the volume of the inner phase, drug hydrophilic property and drug self-aggregation, have effect on the drug loading capacity of nanoparticles (CitationZhang et al. 2004). In the present work, however, the only difference among these HbPN was the molar fraction of PEG chains in copolymers, thus the PEG chains density was thought to be responsible for the alteration of Hb loading in HbPN. Unfortunately, in the previous studies, most investigators have highlighted the role of PEG molecular weight on the physic-chemistry characteristics such as encapsulation efficiency and drug loading (CitationPark and Yoo 2006, CitationHe et al. 2007), but it has received less focus on the effect of different PEG molar ratio in diblock copolymers on the loading capability. This circumstance led us to further investigate the factors which influence the loading capacity of HbPN.
CitationGref et al. (2000) have proposed a relationship between the surface area (S) of each PEG chain occupying the NPs’ surface and the nanoparticles mean diameter (d):
where MPEG is the molecular weight of the PEG chains, NA is the Avogadro number, f is the mass fraction of PEG in the copolymer, ρ is the density of the nanoparticles.
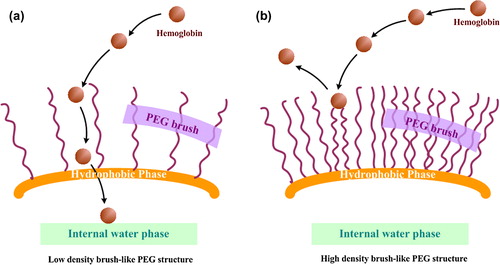
In this mathematical model, taking into account the different PEG molecular weight and molar ratio to the hydrophobic substrate, the authors suggested the optimal PEG chain length and surface density. Interestingly, a similar threshold was also found in this experiment dealing with hemoglobin loading in PEG6K-PCL nanoparticles, with the different PEG mole ratio. Using the formula (4), we found that the PEG surface (S) was monotonically decreased with the increase of PEG mole fraction. Accordingly, in present work, when PEG molar ratio was lower than 10%, the PEG chains had a large range of occupying surface which could provide enough room (that can be also called low surface coverage) for hemoglobin molecules encapsulated into PCL-core, as shown in . As a result, the Hb content in nanoparticles would be large. In contrast, when the nanoparticles were surrounded by high density PEG segments, the range of PEG chains motion would be greatly restricted and the strong steric repulsion was produced to prevent not only opsonins from adsorption but also the Hb molecules from being encapsulated into inner phase. As a result, the Hb content in HbPN decreased reversely, as shown in (CitationVonarbourg et al. 2006). This suggests that PEG chains can form as an entrance to lead Hb molecules into inner water place, or function as a water-binding hydrogel-like brush, with protein-resistant properties that were highly dependent on the flexibility and density of the PEG chains. These results indicated the potential of the proposed FTIR method to assess, in a straightforward way, the changes of Hb content in HbPN samples.
Other than the drug loading results, the surface hydrophilicity and superficial charge were observed to be varied monotonically with the increase of PEG mole fraction in copolymers. In detail, as we predicted above, when PEG chains were introduced onto the hydrophobic surface of PCL, the flexible PEG chains would create a water cloud owing to its high affinity toward water, directly resulting in the improvement of the hydrophilicity of membrane. And with the elevation of PEG fraction in copolymer, the denser water cloud was gradually achieved on the surface and the hydrophilicity of copolymers was increased subsequently. In the same pattern, with the negatively charged PCL serving as core reservoirs for drug and the neutralized PEG as the shell projecting into the aqueous environment, the PEG coating built a shift in the shear plane on the surface and occupied the negative site of PCL on the surface of nanoparticles, leading to neutralization of the apparent charge of the NPs (CitationZahr et al. 2006), with more PEG chains resulting as less negatively charged.
As a whole, the method here provided a useful and convenient tool for quantification of Hb in HbPN rapidly and accurately. Such spectroscopic analytical method presented several advantages over existing technologies such as simplified and facile procedures, shortened assay time, and reduced the consumption of samples and solvent-free. The possibility of predicting Hb concentration in HbPN was an invaluable tool because it was one of the most important parameters for the fabrication of HbPN and other oxygen carrier. In the future, this method can be extended to other protein nanoparticles system. Moreover, the data presented in this work proved that the use of PAN as an internal standard was preferable and successful.
Conclusions
An FTIR spectroscopic method with internal standard reference has been developed for determining the protein/drug content in NPs samples, which avoided the problems associated with the conventional method. This approach was based on the stand alone relationship between the absorbance peak strength or height and the concentration of the absorbing species, and the measurement of the intensity signal in windows obtained from the IR penetration signals through the samples that were typical of Hb and PAN coupled with systematic data processing. Owing to the perfect linear correlation, acceptable precisions and recoveries within linear ranges, this method was applied for quantitative investigation successfully. The consequence of drug loading determination indicated that the drug encapsulation capability had a typical PEG-dependent manner.
Moreover, PEGylation of the hydrophobic PCL membrane dramatically changed the nanoparticles hydrophilicity and superficial charges, suggesting that the PEGylation was a useful strategy to improve the surface characteristic of hydrophobic nanoparticles. Our findings should be helpful for the exploitation of polymeric nanoparticles as future long circulation blood substitutes.
Acknowledgements
We sincerely thank the Shanghai Municipal Education Commission Special Research Fund for Excellent Young College and University Teachers (Grant No. yyy10004) and Shanghai City Board of education innovation project (Grant No. 12YZ162) for support of this work. Finally, we also acknowledge the financial supports from the Starting Research Fund from the Shanghai Institute of Technology, China(Grant No. YJ2009-32).
Declaration of interest
The authors report no conflicts of interest. The authors alone are responsible for the content and writing of the paper.
This project was supported by the National Natural Science Foundation of China (Grant No. 31100673) and the Shanghai Municipal Natural Science Foundation (Grant No. 11ZR1435800).
References
- An S, Abdiryim T, Ding Y, Nurulla I. 2008. A comparative study of the microemulsion and interfacial polymerization for polyindole. Mater Lett. 62:935–938.
- Artz RRE, Chapman SJ, Robertson AHJ, Potts JM, Laggoun-Dé farge F, Gogo S, et al. 2008. FTIR spectroscopy can be used as a screening tool for organic matter quality in regenerating cutover peatlands. Soil Biol Biochem. 40:515–527.
- Chang TMS. 2006. Blood substitutes based on Nanobiotechnology. Trends Biotechnol. 24:372–377.
- Chang TMS. 2010. Blood replacement with engineered hemoglobin and hemoglobin nanocapsules. Wiley Interdisciplinary Reviews: Nanomed Nanobiotechnol. 2:418–430.
- Chen H, Hu X, Zhang Y, Li D, Wu Z, Zhang T. 2008. Effect of chain density and conformation on protein adsorption at PEG-grafted polyurethane surfaces. Colloids Surf B Biointerfaces. 61:237–243.
- Davis WM, Eriekson CL, Johnston CT, Delfino JJ, Porter JE. 1999. Quantitative Fourier Transform Infrared spectroscopic investigation humic substance functional group composition. Chemosphere. 38:2913–2928.
- Favilla R, Parisoli A, Mazzini A. 1997. Alkaline denaturation and partial refolding of pepsin investigated with DAPI as an extrinsic probe. Biophys Chem. 67:75–83.
- Gao W, Bian YZ, Chang TMS. 2013. Novel Nanodimension artificial red blood cells that act as O2 and CO2 carrier with enhanced antioxidant activity: PLA-PEG nanoencapsulated PolySFHb- superoxide dismutase-catalase-carbonic anhydrase. Artif Cells Nanomed Biotechnol. 41:232–239.
- Gao FP, Zhang HZ, Liu LR, Wang YS, Jiang Q, Yang XD, Zhang QQ. 2008. Preparation and physicochemical characteristics of self-assembled nanoparticles of deoxycholic acid modified-carboxymethyl curdlan conjugates. Carbohyd Polym. 71:606–613.
- Gref R, Lück M, Quellec P, Marchand M, Dellacherie E, Harnisch S, Blunk T, Müller RH. 2000. ‘Stealth’ corona-core nanoparticles surface modified by polyethylene glycol (PEG): influences of the corona (PEG chain length and surface density) and of the core composition on phagocytic uptake and plasma protein adsorption. Colloids Surf B Biointerfaces. 18:301–313.
- Guidance for Drug Research Technique. 2005. National Food and Drug Administration 2006, China.
- Hamoudeh M, Fessi H, Mehier H, Faraj AA, Canet-Soulas E. 2008. Dirhenium decacarbonyl-loaded PLLA nanoparticles: influence of neutron irradiation and preliminary in vivo administration by the TMT technique. Int J Pharm. 348:125–136.
- He G, Ma LL, Pan J, Venkatraman S. 2007. ABA and BAB type triblock copolymers of PEG and PLA: a comparative study of drug release properties and “stealth” particle characteristics. Int J Pharm. 334:48–55.
- Jiang H, Zheng Z, Wang Z. 2008. Kinetic study of methyltriethoxysilane (MTES) hydrolysis by FTIR spectroscopy under different temperatures and solvents. Vib Spectrosc. 46:1–7.
- Johnson PJ, Harach DJ. 2004. Quantitative multi-component analysis of copper cyanide strike solutions using partial least squares analysis of Fourier Transform-Infrared Spectra. Hydrometallurgy. 74:67–75.
- Kim HR, Andrieux K, Delomenie C, Chacun H, Appel M, Desma le D, Taran F, Georgin D, Couvreur P, Taverna M. 2008. Analysis of plasma protein adsorption onto PEGylated nanoparticles by complementary methods: 2-DE, CE and Protein Lab- on-chip® system. Electrophoresis. 28:2252–2259.
- Li FQ, Su H, Wang J, Liu JY, Zhu QG, Fei YB, Pan YH, Hu JH. 2008. Preparation and characterization of sodium ferulate entrapped bovine serum albumin nanoparticles for liver targeting. Int J Pharm. 349:274–282.
- Liu Y, Yin Y, Wang LY, Zhang WF, Chen XM, Yang XX, Xu JJ, Ma GH. 2013. Surface Hydrophobicity of Microparticles Modulates Adjuvanticity. J Mater Chem B. 1: 3888–3896.
- Marcotte L, Kegelaer G, Sandt C, Barbeau J, LaXeur M. 2007. An alternative infrared spectroscopy assay for the quantification of polysaccharides in bacterial samples. Anal Biochem. 361: 7–14.
- Mayer-Helm B, Hofbauer L, Müller J. 2008. Method development for the determination of selected pesticides on tobacco by high- performance liquid chromatography–electrospray ionisation- tandem mass spectrometry. Talanta. 74:1184–1190.
- McCarron PA, Hall M. 2008. Incorporation of novel 1-alkylcarbonyloxymethyl prodrugs of 5-fluorouracil into poly(lactide-co- glycolide) nanoparticles. Int J Pharm. 348:115–124.
- Mora PT. 1965. Acid denaturation of DNA in the presence of a polyanion. Biochim Biophys Acta (BBA) -Biophysics including Photosynthesis. 109:568–577.
- Papadimitriou S, Bikiaris D, Avgoustakis K, Karavas E, Georgarakis M. 2008. Chitosan nanoparticles loaded with dorzolamide and pramipexole. Carbohydr Polym. 73:44–54.
- Park TG, Yoo HS. 2006. Dexamethasone nano-aggregates composed of PEG–PLA–PEG triblock copolymers for anti-proliferation of smooth muscle cells. Int J Pharm. 326:169–173.
- Puri S, Kallinteri P, Higgins S, Hutcheon GA, Garnett MC. 2008. Drug incorporation and release of water soluble drugs from novel functionalised poly(glycerol adipate) nanoparticles. J Controlled Release. 125:59–67.
- Sato A, Choi SW, Hirai M, Yamayoshi A, Moriyama R, Yamano T, et al. 2007. Polymer brush-stabilized polyplex for a siRNA carrier with long circulatory half-life. J Controlled Release. 122: 209–216.
- Simard P, Hoarau D, Khalid MN, Roux E, Leroux JC. 2005. Preparation and in vivo evaluation of PEGylated spherulite formulations. Biochim Biophys Acta (BBA)-Biomembranes. 1715:37–48.
- Torrado G, García-Arieta A, de los Ríos F, Menéndez JC, Torrado S. 1999. Quantitative determination of dimethicone in commercial tablets and capsules by Fourier transform infrared spectroscopy and antifoaming activity test. J Pharm Biomed Anal. 19:285–292.
- Vonarbourg A, Passirani C, Saulnier P, Benoit JP. 2006. Parameters influencing the stealthiness of colloidal drug delivery systems. Biomaterials. 27:4356–4373.
- Zahr AS, Davis CA, Pishko MV. 2006. Macrophage uptake of core−shell nanoparticles surface modified with poly(ethylene glycol). Langmuir. 22:8178–8185.
- Zhang L, Hu Y, Jiang X, Yang C, Lu W, Yang YH. 2004. Camptothecin derivative-loaded poly(caprolactone-co-lactide)-b-PEG-b-poly(caprolactone-co-lactide) nanoparticles and their biodistribution in mice. J Controlled Release. 96:135–148.
- Zhang P, He J, Zhou X. 2008a. An FTIR standard addition method for quantification of bound styrene in its copolymers. Polym Test. 27:153–157.
- Zhang XL, Liu CS, Yuan Y, Shan XQ, Sheng Y, Xu F. 2008b. Reduction and Suppression of Methemoglobin Loaded in the Polymeric Nanoparticles Intended for Blood Substitutes. J Biomed Mater Res Part B Appl Biomater. 27:354–363.
- Zhao J, Liu CS, Yuan Y, Tao XY, Shan XQ, Sheng Y, Wu F. 2007. Preparation of hemoglobin- loaded nano-sized particles with porous structure as oxygen carriers. Biomaterials. 28:1414–1422.