
 ?Mathematical formulae have been encoded as MathML and are displayed in this HTML version using MathJax in order to improve their display. Uncheck the box to turn MathJax off. This feature requires Javascript. Click on a formula to zoom.
Abstract
A novel impedimetric biosensor utilizing a biological receptor, vascular endothelial growth factor receptor-1 (VEGF-R1), was developed for the determination of vascular endothelial growth factor (VEGF). VEGF-R1 was covalently immobilized by coupling with 11-mercaptoundecanoic acid, which formed a self-assembled monolayer on gold electrodes. Cyclic voltammetry and electrochemical impedance spectroscopy techniques were employed to characterize the immobilization process and to detect VEGF. To successfully construct the biosensor current, the experimental parameters were optimized. A Kramers–Kronig transform was performed on the experimental impedance data. The results obtained provided a linear response range from 1 to 6 ng/mL human VEGF. The applicability of the biosensor developed to determine VEGF in a spiked artificial human serum sample was tested. The important parameters related with the biosensors fabricated by using two different mercapto acids were compared in terms of the self-assembly processes, the activation conditions of –COOH ends, linear ranges obtained for VEGF, repeatabilities and reproducibilities, and cleaning procedures. The results of this study revealed that the length of the mercapto acids used for biosensor fabrication considerably affected the analytical performance and the practicability of the preparation of the biosensor.
Introduction
Vascular endothelial growth factor (VEGF) is the most potent angiogenesis factor and has been detected in many human tumors (CitationDvorak et al. 1995). VEGF has been reported to be linked closely to tumor progression and metastasis (CitationSenger et al. 1993). It is a glycosylated dimeric polypeptide which is abundantly expressed and secreted by most human tumors, and has important effects on endothelial cells (CitationSenger et al. 1983, CitationLeung et al. 1989). VEGF's normal function is to create new blood vessels during embryonic development, after injury, and in muscle following exercise, and also to bypass blocked vessels (CitationYla-Herttuala and Alitalo 2003, CitationFerrara 2004, CitationCarmeliet 2005). When VEGF is overexpressed, it can contribute to disease. Solid cancers cannot grow beyond a limited size without an adequate blood supply; cancers that can express VEGF are able to grow and metastasize. Overexpression of VEGF can cause vascular disease in the retina of the eye and other parts of the body (CitationWallace and Wu 2013, CitationZampetti et al. 2013).
Because of the importance of the direct monitoring of protein–protein interaction, like VEGF/VEGF-R1, several methods have been explored at both academic and industrial levels, for introducing alternative measurement systems to the existing methods such as ELISA-based immunoassays. Among the different types of immunosensors, impedance-based biosensors have received great attention because of their important advantages such as the low cost of electrode production and equipment, miniaturization ability, possibility of integration into multiplied-arrays, etc. (CitationKatz and Willner 2003, CitationIvnitski et al. 2000, CitationK'owino and Sadık 2005, CitationLisdat and Schafer 2008, CitationProdromidis 2010). Moreover, owing to the above mentioned advantages, impedance-based biosensors are considered as promising candidates for use at point-of-care applications. Recently, electrochemical impedance spectroscopy (EIS) has also become an efficient method for many chemical and physical processes. EIS presents analytic solutions for many processes. Besides these, identification of membranes, biosensor characterization and fabrication can also be effectively monitored by EIS. In addition, enzyme-substrate interactions after antigen-antibody, receptor-ligand, or DNA– DNA interactions, which have no catalytic reaction, can be successfully monitored by EIS (CitationBott 2001, CitationKatz and Willner 2003, CitationGuan et al. 2004). The EIS methods should be divided into two general types depending on the presence or absence of bioreceptors. The first type is based on the changing impedance resulting from the binding of target elements to the specific bioreceptors immobilized on the transducer surface. The second type works by monitoring metabolites produced by living cells as a result of growth (CitationWan et al. 2010, CitationVelusamy et al. 2010). Although EIS-based biosensors have many advantages, they have some limitations. The hundreds of publications on this subject show that the biosensors based on EIS have been succesfully applied at the academic level (CitationChang and Park 2010, CitationLisdat and Schafer 2008, CitationProdromidis 2010). However, no prototypes based on impedance have been released into the commercial markets. The most important fundamental issue with these systems is with regard to their reproducibilities. Therefore, further efforts should be devoted to expanding commercial products for routine quantitative analysis.
In the current study, human vascular endothelial growth factor receptor-1 (VEGF-R1) was used as a bio-recognition element for the first time. Recombinant human VEGF-R1 is a disulfide-linked dimeric protein with two 905 amino acid residue polypeptides, and has a predicted monomeric molecular mass of 100 kDa (CitationShibuya et al. 1990, CitationKendall and Thomas 1993, CitationNeufeld et al. 1999). The recombinant soluble VEGF-R1 binds VEGF with high affinity (CitationHe et al. 1999, CitationOlofsson et al. 1998, CitationConn et al. 1990). The object of the study was to develop an electrochemical biosensor system based on EIS, which will enable fast, sensitive, and practical determination of VEGF, which is a protein that often comes into play in the clinical field and poses a health threat to people. Mercaptoundecanoic acid (MUA) monolayers were successfully self-assembled onto gold working electrodes. Following that, VEGF-R1 was covalently immobilized on the modified gold electrodes using an EDC/NHS couple. On the basis of cyclic voltammetry (CV) and electrochemical impedance investigations, we achieved the immobilization. To analyze the EIS data, it was fitted to an equivalent circuit model. Certain important parameters such as incubation periods for MUA SAM formation, VEGF-R1 incubation, EDC/NHS concentration and VEGF-R1 amount were optimized, to obtain the best results. Artificial serum samples spiked with VEGF were analyzed by the biosensor. Finally, in the present study, the previously reported biosensors fabricated with a short chain mercaptopropionic acid (MPA) and the biosensor presented here, were compared.
Materials and methods
Materials
All reagents were obtained from Sigma-Aldrich (St. Louis, MO, USA). VEGF-R1 (human) and VEGF (human) were also obtained from Sigma-Aldrich (St. Louis, MO, USA). VEGF, VEGF-R1, and 0.1% bovine serum albumin (BSA) were prepared in a 50 mM pH 7 phosphate buffer. VEGF-R1 and VEGF solutions were stored at − 20°C until use. The synthetic serum solution was prepared by using 4.5 mM KCl, 5 mM CaCl2, 1.6 mM MgCl2, 4.7 mM D(+)-glucose, 2.5 mM urea, 0.1% human serum albumin, and 145 mM NaCl. A redox probe solution was prepared in a 50 mM pH 7 phosphate buffer which contained 0.1 M KCl, 5 mM Fe(CN)64− and 5 mM Fe(CN)63−. Gold working electrodes were obtained from BASi, Warwickshire, UK (1.6 mm2 surface area), an Ag/AgCl reference electrode and a Pt counter electrode were obtained from BASi, Warwickshire, UK. Electrochemical experiments were carried out by using a Compactstat with an integrated impedance analyzer (Ivium Technologies, Eindhoven, the Netherlands) interfaced with a PC. Also, a Gamry Potantiostat/Galvanostat, Reference 600 (Gamry Instruments, Warminster, USA) interfaced with a PC via the EChem Analyst containing physical electrochemistry, pulse voltammetry, and EIS software, was used in the experiments. All electrochemical experiments were carried out in a Faraday cage (from BASi, Warwickshire, UK) to block out external static electric fields.
Methods
VEGF-R1 immobilization procedure
Before the VEGF-R1 immobilization, the gold electrodes were first polished with 0.05 μm alumina powder and then washed with ultra-pure water. Following that, the electrodes were ultrasonically washed in absolute ethanol for 2 min to remove alumina residues. Then, the electrodes were immersed into Piranha (H2O2/H2SO4, 30/70, v/v) solution for 3 min. Following that, the electrodes were washed with ultra-pure water. The electrodes were immediately dried in an argon stream. In the next step, the electrodes were immediately immersed in an 11-mercaptoundecanoic acid solution (0.1 M, in pure ethanol) for 2 h. After this period, they were rinsed with ethanol and gently dried with an argon stream. The gold electrodes modified by 11-MUA were dipped into a glass bottle containing EDC/NHS solution (4 mM EDC, 1 mM NHS) for an hour in a dark ambience. Later, the electrodes were gently washed with ultra-pure water and were then dried in a pure argon stream again. Finally, 10 μL of VEGFR-1 solution was dropped onto the activated electrode surface and incubated for an hour in a humid environment. After washing the surface of the electrodes, 10 μL bovine serum albumin (BSA) solution (0.1%) was dropped onto the electrodes to block the active ends on the surface.
Measurement procedure
CV was used to characterize the layer-by-layer formation of the biosensors. The potential was varied between 0 and 500 mV (step size: 20 mV, scan rate: 50 mV/s) in the presence of 5 mM K3[Fe(CN)6]/K4[Fe(CN)6] (1:1) solution, which served as a redox probe containing 0.1 M KCl. For electrochemical impedance studies, an alternating wave of 10 mV amplitude was applied to the electrodes over the formal potential of the redox couple (0 V). The redox couple used for impedance studies was the same as that used in CV. Impedance spectra were collected in the frequency range between 10,000 and 0.05 Hz.
After fabrication of the biosensor based on 11-MUA, the VEGF standard solution was applied to the biosensor surface by using a micro-pipette. The volume of the applied VEGF standard solution was 5 μL for each application. The biosensor was incubated for an hour for the interaction between VEGF and VEGF-R1 immobilized onto the electrode surface, in a moist medium. At the end of 1 h, in order to remove physically adsorbed VEGF molecules to the electrode surface, the biosensor was washed with ultra-pure water by immersing it into the water ten times. Finally, the biosensor was again put into the cell containing the Fe(CN)64−/3− redox probe solution and the electrochemical measurements were made as described previously. The difference in charge transfer resistance between the biosensor's unbounded and bounded VEGF was used to prepare VEGF calibration curves.
Results and discussion
VEGF-R1 immobilization by 11-MUA and EDC/NHS couple
EIS can be used to characterize surface interfaces successfully. It is also a valuable tool for electrochemical measurement systems such as biosensors. A response in resistance was measured across the VEGF-R1-based immunosensor surface upon hybridization between the biological receptor and the VEGF. It is known that the redox couple of Fe(CN)63−/4− integrates well with a self-assembled monolayer formed on a gold surface. The Fe(CN)63−/4− redox probe helps to successfully investigate the pinhole degree or defect structure, insulating properties and the density of the adsorbed layer (CitationQingwen et al. 2001, CitationPei et al. 2001, CitationDing et al. 2005). As can be seen in , a well-defined characteristic voltammogram of the redox couple was observed at the surface of bare gold electrodes. After self-assembly of 11-MUA onto the gold electrode surface, the anodic and cathodic currents decreased dramatically. It was obvious that this was caused by the blocking effect of 11-MUA SAMs. The relatively long alkyl chain of 11-MUA showed a highly ordered monolayer on the surface due to van der Waals interactions between the R-S− units. Moreover, it is known that the thermodynamic stability of self-assembly monolayers increases with the length of the alkyl chain (CitationSmith et al. 2004). For the immobilization of VEGF-R1, the EDC/NHS couple was used, as mentioned previously. Carbodiimides react with carboxyls to form an intermediate that can stabilize by a reaction with amines, forming a peptidic bond, without spacers. The most popular carbodiimide compound is EDC. It is often used in immobilization of proteins on different solid or semi-solid substrates (CitationHoare and Koshland 1966). After the next step, the EDC/NHS activation of terminal –COOH groups of 11-MUA resulted in an increase in the peak currents compared to those obtained at an Au/11-MUA. The couple of EDC/NHS formed an intermediate active ester which was the product of condensation of terminal –COOH of 11-MUA and N-hydroxysuccinimide. The experiments revealed that this intermediate product exhibited excellent electrochemical activity towards the redox probe. Moreover, although the carboxyl groups of 11-MUA could be reacted directly with amines using EDC, the reaction was much more efficient with NHS because a stable intermediate was created. In the activation step, it was possible to make electrochemical measurements just by this relatively stable intermediate product. In the experiments we used the EDC/NHS covalent coupling system, because EDC is an easily handled solid and it is quite water-soluble. NHS was very important for the immobilization process because the intermediate undergoes hydrolysis in aqueous solutions. Consequently, EDC caused a dehydration reaction between the carboxyl and the NHS hydroxyl group, giving rise to an NHS-ester-activated molecule. With the help of NHS, the activated intermediate molecule was much more stable than that produced only with EDC activation.
Figure 1. Electrochemical characterization of the biosensor [(A) Cyclic voltammograms of VEGF-R1 immobilization on gold electrode modified with MUA, -◊-◊-:Bare Au, -+-+-: Au/MUA, -•-•-:Au/MUA/EDC-NHS, -□-□-: Au/MUA/EDC-NHS/VEGF-R1, -Δ-Δ-: Au/MUA/EDC-NHS/VEGF-R1/BSA. (B) Electrochemical impedance spectra of VEGF-R1 immobilization steps, -+-+-: Bare Au, -•-•-: Au/MUA, -□-□-: Au/MUA/EDC-NHS, -◊-◊-: Au/MUA/EDC-NHS/VEGF-R1, -Δ-Δ-: Au/MUA/EDC-NHS/VEGF-R1/].
![Figure 1. Electrochemical characterization of the biosensor [(A) Cyclic voltammograms of VEGF-R1 immobilization on gold electrode modified with MUA, -◊-◊-:Bare Au, -+-+-: Au/MUA, -•-•-:Au/MUA/EDC-NHS, -□-□-: Au/MUA/EDC-NHS/VEGF-R1, -Δ-Δ-: Au/MUA/EDC-NHS/VEGF-R1/BSA. (B) Electrochemical impedance spectra of VEGF-R1 immobilization steps, -+-+-: Bare Au, -•-•-: Au/MUA, -□-□-: Au/MUA/EDC-NHS, -◊-◊-: Au/MUA/EDC-NHS/VEGF-R1, -Δ-Δ-: Au/MUA/EDC-NHS/VEGF-R1/].](/cms/asset/c13f84a0-1f6d-41a0-8abe-318e34e253fb/ianb_a_962743_f0001_oc.jpg)
shows Nyquist plots that were obtained after modification of the biosensor. The complex impedance plot comprises a compressed semi-circle at high frequencies due to kinetically controlled processes (CitationRandles 1947). This is followed by a linear region at lower frequencies, arising from Warburg impedance, which is due to diffusion-limited mass transfer across the interface. EIS studies provided useful information on impedance changes of the electrode surface during the fabrication process and were carried out to investigate immobilization of VEGF-R1 onto the electrode. It was observed that the Rct of the bare electrode was lower than that of the self-assembled MUA electrode, revealing its increased resistance and very low electron transfer efficiency. However, the Rct of the EDC/NHS activated MUA/electrode considerably decreased compared with that before the activation process. The EDC/NHS reaction included formation of an intermediate active ester which was the product of condensation of terminal –COOH of MUA and N-hydroxysuccinimide. This intermediate product exhibited excellent electrochemical activity. The increase in Rct after binding of VEGF-R1 and BSA can be attributed to the fact that most biological molecules, including proteins, are poor electrical conductors at low frequencies and hinder electron transfer. These results also indicate the binding of VEGF-R1 and BSA onto the electrode surface.
Optimization experiments for VEGF-R1 immobilization
The immobilization of VEGF-R1 was optimized by adjusting the incubation periods for MUA SAM formation, VEGF-R1 incubation, and also the EDC/NHS concentration and VEGF-R1 amount. The details are discussed below. To reveal the effect of incubation time on the formation of SAM of MUA, the incubation periods of 1, 2, 3, and 5 h, were tested. The electrochemical impedance spectra related to these data are given in .
Figure 2. Optimum incubation period for the formation of SAM MUA [Electrochemical impedance spectra obtained for different MUA incubation periods, -•-•-: 1 h, -□-□-: 2 h, -+-+-: 3 h, -♦-♦-:5 h].
![Figure 2. Optimum incubation period for the formation of SAM MUA [Electrochemical impedance spectra obtained for different MUA incubation periods, -•-•-: 1 h, -□-□-: 2 h, -+-+-: 3 h, -♦-♦-:5 h].](/cms/asset/3bbad07b-09eb-4bc0-9d01-5a299ba96d5a/ianb_a_962743_f0002_b.gif)
The idea of using SAMs in gold–organosulfur chemical bonding was first proposed by CitationNuzzo and Allara (1983). Because of their easy preparation procedure, SAM applications have been extensively used in many studies. A self- assembled monolayer could be easily obtained on a clean gold surface by allowing the electrode to incubate for a period lasting between a few minutes to 1 day. The effective incubation period depended on the structure and the aim of the SAM formation. However, the concentration of the compound, its polarity, and the structure of the solvent were the main parameters identifying the SAM properties (CitationSchreiber 2000). It can be seen that the formation of SAM of MUA was affected by the incubation period. Electrochemical impedance studies revealed that the impedance values increased with the increase in incubation periods. MUA formed a densely packed monolayer on the gold surface in a short time. This could be attributed to the strong chain–chain interaction of MUA. Although there was a slight difference between the 2, 3, and 5-h incubations, the 2-h incubation period was optimal for efficient SAM formation. Consequently, in the following studies, for the formation of SAM, the electrode was incubated with MUA solution for 2 h.
EDC and NHS coupling is frequently performed for many immobilization procedures due to its ease of use, high coupling rates and flexibility. In this reaction the surface –COOH groups are first activated by EDC and then converted into active ester intermediates (CitationJohnsson et al. 1991, CitationSheehan and Hlavka 1956). NHS converts the intermediate of EDC into a more stable active ester. This step is very important because the EDC intermediate product should be easily hydrolyzed within seconds. As expected, the concentrations of EDC and NHS were very important parameters. To reveal the effect of EDC/NHS concentrations, four different concentrations (4/1, 0.4/0.1, 0.04/0.01, and 0.004/0.001) were used. The impedance spectra showed that the performance of immobilization of VEGF-R1 was directly dependent on the concentration ratio of the EDC/NHS couple ().
Figure 3. The effect of concentration ratio of EDC/NHS couple [Electrochemical impedance spectra obtained for different EDC/NHS ratios, -Δ-Δ-: 0.004 mM EDC/0.001 mM NHS, -□-□-: 0.04 mM EDC/0.01 mM NHS, -◊-◊-: 0.4 mM EDC/0.1 NHS, -+-+-: 4 mM EDC/1 mM NHS].
![Figure 3. The effect of concentration ratio of EDC/NHS couple [Electrochemical impedance spectra obtained for different EDC/NHS ratios, -Δ-Δ-: 0.004 mM EDC/0.001 mM NHS, -□-□-: 0.04 mM EDC/0.01 mM NHS, -◊-◊-: 0.4 mM EDC/0.1 NHS, -+-+-: 4 mM EDC/1 mM NHS].](/cms/asset/e151e2ea-25a8-4add-88f1-496075c5568e/ianb_a_962743_f0003_b.gif)
The increase in concentrations of the EDC/NHS couple caused effective immobilization. Moreover, the activation with concentrations lower than 0.04/0.01 EDC/NHS showed that the low concentration ratio was not sufficient for effective binding of VEGF-R1 to the electrode surface. Concentrations higher than 4/1 mM were not tested. Although EDC/NHS coupling is highly effective in immobilization, one should be aware that unexpected reactions such as esterification can occur when using high EDC/NHS concentrations (CitationCuatrecasas and Parikh 1972). In all experiments, the activation process of terminal –COOH groups was achieved by using 0.04 mM EDC and 0.01 mM NHS.
The incubation period for binding of VEGF-R1 was also optimized. The results indicated that the incubation period had a considerable effect on the response of the biosensor presented. The results are given in .
Figure 4. The effect of VEGF-R1 incubation period on immobilization performance [Electrochemical impedance spectra obtained for different VEGF-R1 incubation periods, -+-+-: 1 h, -◊-◊-:2 h, -Δ-Δ-: 3 h, -□-□-: 4 h].
![Figure 4. The effect of VEGF-R1 incubation period on immobilization performance [Electrochemical impedance spectra obtained for different VEGF-R1 incubation periods, -+-+-: 1 h, -◊-◊-:2 h, -Δ-Δ-: 3 h, -□-□-: 4 h].](/cms/asset/0969d6fc-ed71-4424-8261-95a1a85483fd/ianb_a_962743_f0004_b.gif)
When an incubation time higher than 1 h was used, the Ret values were considerably decreased. An increase in incubation time unfavorably affected the binding of VEGF to VEGF-R1. During long incubation periods, the VEGF-R1 solution applied to the electrode surface completely evaporated, although the electrode was incubated in a moist medium. Because of this, the immobilization performance of VEGF-R1 was probably reduced, which is why VEGF calibration graphs obtained with the biosensors prepared by using long incubation periods showed no linear characteristics. As a result, short periods seem to be favorable for an effective immobilization process.
The optimum amount of VEGF-R1 was also investigated by using different VEGF-R1 amounts in the process of immobilization. For this purpose, 65, 85, 125, and 500 μg/mL VEGF-R1 portions were applied to the electrode surfaces for construction of the biosensors. The impedance spectra related to this study can be seen in .
Figure 5. The effect of VEGF-R1 amount on immobilization performance [Electrochemical impedance spectra obtained for different VEGF-R1 amounts, -o-o-:500 μg/mL, -◊-◊-:125 μg/mL, -□-□-: 85 μg/mL, -Δ-Δ-: 65 μg/mL].
![Figure 5. The effect of VEGF-R1 amount on immobilization performance [Electrochemical impedance spectra obtained for different VEGF-R1 amounts, -o-o-:500 μg/mL, -◊-◊-:125 μg/mL, -□-□-: 85 μg/mL, -Δ-Δ-: 65 μg/mL].](/cms/asset/d3f48e4f-ca48-4922-bc9e-6a0f332a2775/ianb_a_962743_f0005_b.gif)
The binding performance of VEGF-R1 to the surface increased with an increase in the VEGF-R1 amount, as can be seen in . This result was expected because in most cases in protein science, an increase in protein amount increases the immobilization ratio. Consequently the Ret values were increased by increasing the amount of VEGF-R1. The impedance values obtained for different amounts of VEGF-R1 (65, 85, 125, and 500 μg/mL) were 1053, 1608, 2018, and 7539 ohm, respectively. Moreover, VEGF-R1 amounts higher than 500 μg/mL were not tested because when amounts higher than 500 μg/mL were used, the cost of the biosensor increased undesirably. For these reasons, the most effective amount of VEGF-R1 was determined to be 500 μg/mL.
Eventually, the optimization of the period for the interaction between VEGF-R1 and VEGF was determined based on differing periods of VEGF incubation. From , we notice that electron transfer resistances increase with time up to 1 h and after that they decrease with time. The longer the incubation time, the lower the performance of immobilization in the biosensor fabrication process.
Figure 6. Optimum incubation period for the interaction between VEGF-R1 and VEGF [-+-+-: 1 h, -◊-◊-:2 h, -□-□-: 3 h].
![Figure 6. Optimum incubation period for the interaction between VEGF-R1 and VEGF [-+-+-: 1 h, -◊-◊-:2 h, -□-□-: 3 h].](/cms/asset/a59f9c8e-7d42-43c1-94fc-9241ccc97911/ianb_a_962743_f0006_b.gif)
Similar results were obtained in the experiments for VEGF-R1 incubation period optimizations. Consequently, these experiments revealed once again that longer incubation periods for both VEGF-R1 and VEGF affected the biosensor response negatively, because, as mentioned above, VEGFR-1 or VEGF solutions applied to the electrode surface evaporated. It is likely that oxygen in the air caused damage to the surface of the biosensor, resulting in a reduction of the biosensor performance. As a consequence, the optimum period for the interaction between VEGF and the biosensor was found to be 1 h.
Characterization of VEGF-R1-based biosensor
An equivalent circuit model was implemented to calculate the electron transfer resistances related to the VEGF concentrations. The model was inserted in .
In order to prepare a calibration curve for VEGF, the variation of the absolute impedance calculated by the following equation was used:
where Ret(VEGF-R1/VEGF) is the value of the electron transfer resistance after VEGF-R1 is bound to VEGF, while Ret(VEGF-R1) is the value of the electron transfer resistance when VEGF-R1 is immobilized on the electrode. As can be seen from , an increase in the concentration of VEGF resulted in a decrease in the peak currents of cyclic voltammograms.
Figure 7. Cyclic voltammograms (A) and impedance spectra (B) obtained for different concentrations of VEGF.
Nyquist plot-related impedance measurements can be seen in for different VEGF concentrations. The results revealed that an increase in VEGF concentration caused an increase in electron transfer resistances and also in the diameter of the semi-circle in the Nyquist plots. In the experiments, low frequencies were utilized for concentration-dependent measurements.
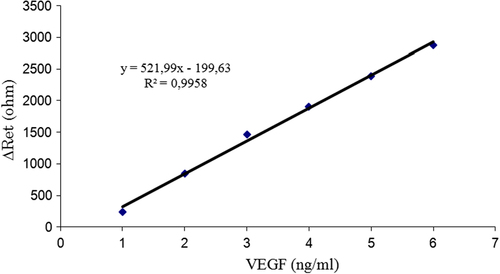
A calibration graph for VEGF was prepared with the help of the differences in electron transfer resistances after VEGF binding. As can be seen in , a linear calibration range for VEGF between 1 and 6 ng/mL was obtained.
Figure 8. VEGF calibration curve related with the proposed biosensor based MUA.
Reproducibility is an important issue for the present biosensor. For identifying the reproducibility of the biosensor, six biosensors fabricated via the same set of procedures used for VEGF analysis were investigated successfully. The results showed that the linear detection ranges of the six biosensors were between 1 and 6 ng/mL. The results are given in . The biosensor described here also provided excellent reproducibility. The results are again summarized in .
Table I. The results for Kramers–Kronig transforms, reproducibility, and the sample analysis.
The repeatability of the biosensor signals was also investigated. As is known, repeatability is defined as the degree to which a single biosensor that can be used continually for a series of measurements with the same concentration of VEGF. The electron transfer resistances of the biosensor were calculated when it was consecutively exposed to a 2 ng/mL VEGF standard solution five times. At the end of this study, the correlation coefficient, the average value and standard deviation were calculated as 5.72%, 2.08 ng/mL and ± 0.12 ng/mL, respectively.
Moreover, in order to evaluate the quality of the impedance data, a Kramers-Kronig (K–K) transform was performed on the experimental data. The Kramers–Kronig (K–K) relations demand that causal, complex plane spectral data show dependence between the magnitude and phase. The real part of a spectrum can be obtained by integration of the imaginary part and vice versa. The K–K relations will always be true for EIS data that is linear, causal, and stable. If measured real and imaginary spectral data do not comply with the K–K relations, the data must violate one of these conditions.
The K–K relations can execute the linearity, causality, and stability of impedance data obtained, by using integral equations that constrain the real and imaginary components of complex quantities for systems (CitationKramers 1929, CitationKronig 1926, CitationOrazem and Tribollet 2008). The Kramers–Kronig equations can be used to apply them to electrochemical impedance spectra for identification of the frequency-dependent error structure of impedance data and for evaluating the consistency of the data with the K–K relations. Through the use of a measurement model, experimental data can be checked for consistency with the K–K relations without explicit integration of the K–K relations; therefore, inaccuracies associated with extrapolation of an incomplete frequency spectrum are resolved. The measurement model can be used to determine whether the residual errors in the regression are due to an inadequate model, failure of data to conform to the K–K assumptions, or noise (CitationAgarwal et al. 1993).
The K–K relations were used to predict one component of the impedance if the other is known, over the frequency limits of zero to infinity. The usual way of using the Kramers–Kronig equations, therefore, was to calculate the imaginary component of impedance from the measured real component and to compare the values obtained to the experimental imaginary component. Alternatively, the real component of impedance was calculated from the measured imaginary values by using the software of the potentiostate used in the experiements. By these calculations “Goodness of fit” value was obtained. Moreover, to evaluate the relative errors (∆Z/Z) related with the real and imaginary parts of the experimental data, an overlapped plot was also drawn.
For the biosensor based on VEGF-R1, K–K transforms were performed for all steps. The plots of the K–K transforms are given in . also includes the goodness of fit values calculated for all different biosensor surfaces.
Figure 9. The plots of Kramers-Kronig transforms performed on different layers of the proposed biosensor. [The turquoise lines show Kramers-Kronig Transforms performed and fitted on the experimental data and the black lines show experimental results. -■-■-:Bare Au electrode -•-•-:Au/MUA/EDC-NHS, -♦-♦-: Au/MUA/EDC-NHS/VEGF-R1, -▲-▲-: Au/MUA/EDC-NHS/VEGF-R1/BSA, inserted plot:Au/MUA].
![Figure 9. The plots of Kramers-Kronig transforms performed on different layers of the proposed biosensor. [The turquoise lines show Kramers-Kronig Transforms performed and fitted on the experimental data and the black lines show experimental results. -■-■-:Bare Au electrode -•-•-:Au/MUA/EDC-NHS, -♦-♦-: Au/MUA/EDC-NHS/VEGF-R1, -▲-▲-: Au/MUA/EDC-NHS/VEGF-R1/BSA, inserted plot:Au/MUA].](/cms/asset/270ea64c-5d4e-4723-8e28-ab038b7a84d8/ianb_a_962743_f0009_oc.jpg)
The results revealed that the experimental data agreed with the data obtained by the transform. Consequently, it can be concluded that the impedance spectra were linear, stable, and causal circuits. More importantly, for the analysis and modeling of the experimental results, one should be certain that the impedances obtained for all different surfaces of biosensor are valid.
Finally, the proposed biosensor was applied to artificial serum samples for the analysis of VEGF. The results are shown in . The results proved that VEGF levels of the artificial serum samples analyzed by the biosensor agreed with that of the amount of it spiked in the artificial serum solutions.
Comparison of the two biosensors fabricated by 3-mercaptopropionic acid and 11-mercaptoundecanoic acid
A comparison of two mercapto acids – mercaptopropionic acid which was previously reported and 11-mercaptoundecanoic acid – is the secondary focus of this study. The comparison is discussed below. Biosensors based on the self-assembled monolayer formation on the electrode surface of MPA and MUA have three chemical entities, each of which has a key role in the self-assembly process. Both of them have a thiol group that interacts with gold, and this is the primary force pioneering to assembly on the surface. The –COOH groups of MPA and MUA identified the surface characteristics of the biosensors. Depending on the characteristics of the –COOH groups, it forced the ordering of mercapto acid molecules. For both biosensor systems it was observed that the head groups probably played a part in disordering the self-assembled layer due to the repulsive effect of the carboxyl groups. The most important constituent of the mercapto acids used in the two biosensors was the aliphatic methylene chains. The van der Waals interactions between these aliphatic methylene chains were an extremely significant force in the self-assembly process. In a self-assembly process, within a few seconds, a primary monolayer is formed. Moreover in this period, the thickness of the layer reaches 80–90% of its final value (CitationSezgintürk 2011). However, when the monolayer slowly forms, the lengths of these aliphatic methylene chains become more important because the van der Waals forces maintain the order in the mercapto acids, forming them into a highly-packaged monolayer on the electrode surface. In the previous biosensor constructed by MPA, to obtain a well-ordered monolayer it was necessary to incubate the gold electrodes for 18 h. However, in the present biosensor constructed using MUA, the optimum incubation period was only 2 h. It was obvious that the longer the chain, the more ordered the self-assembled monolayer (CitationBain et al. 1989, CitationHolmes-Farley et al. 1988). Moreover, a significant decrease in the thickness of the layer with chains shorter than eight carbons was also reported (CitationPorter et al. 1987). The results reported here completely agreed with these theoretical data. Moreover, the charge transfer resistances obtained after the self-assembly of the MPA and MUA monolayers were very different from each other. Although it was necessary to incubate gold electrodes for 18 h for MPA self-assembly, the charge transfer resistances only reached about 4 kohm. However, the self-assembled monolayer of MUA resulted in a high charge transfer resistance of about 100 kohm. The MUA formed a well-ordered insulating layer on the gold surface due to the effective van der Waals forces among the long chains of MUA.
One of the most obvious dissimilarities between the two biosensors was the concentration ratio of the EDC/NHS couple. While the optimum concentration of EDC/NHS for MPA activation was reported as 0.04/0.01 M, this value for MUA activation was 100-fold higher than that of MPA, 4/1 M. This result can probably be attributed to the tightly ordered monolayer of MUA. Therefore, activating –COOH groups located in a compact surface structure should just be possible by using EDC/NHS at high concentrations. Moreover, it is difficult to activate the head –COOH groups of MUA monolayers sterically; consequently high EDC/NHS concentrations were needed to accomplish the activation procedure. In summary, these results revealed that successful biosensor creation requires the strict control and optimization of the concentrations of EDC/NHS which react with carboxyl groups of MPA and MUA to form a peptidic bond, resulting in the immobilization of the bioreceptor, VEGF-R1, without any spacers.
When evaluating the VEGF linear ranges of both biosensors, it is useful to consider the detection limits. Although the biosensor based on MPA could detect pg/mL levels of VEGF successfully, the biosensor based on MUA could only detect ng/mL levels of VEGF. This result, however, is related to the high concentrations of EDC/NHS couple. That is, it was reported that in the reaction between EDC/NHS and protein, side reactions may take place, notably with carboxyls in a hydrophobic environment, giving N-acyl-urea (CitationGilles et al. 1990, CitationGrabarek and Gergely 1990). Accordingly, an EDC/NHS reaction caused by using high concentrations should presumably induce the occurrence of side reactions with VEGF-R1. Eventually, this should reduce the sensitivity of the biosensor to VEGF.
The repeatability and reproducibility of the two biosensors were good. The repeatability and reproducibility of the biosensors closely depended on the characteristics of the self-assembled monolayers of mercapto acids. In both biosensor systems, the experimental conditions for the fabrication of the biosensors and the measurement procedures were strictly managed and standardized. The repeatability and the reproducibility of the biosensors were acceptable for a measurement system.
Finally, the cleaning of the gold electrodes after measurements is an important parameter. For mercapto acids with flexibility like MUA or with a charged head group like MPA (also MUA), the cleanliness of the gold electrodes is extremely important. Although the biosensor prepared with MPA could be cleaned easily, to clean the other one was relatively difficult. In fact, this was an expected result for the reason mentioned above. Probably, the flexibility of MUA made it more difficult to remove contamination from the gold electrode surface. On the other hand, stabilization of the van der Waals forces among the MUA chains showed the strong driving force of the sulfur and gold interaction. Since the longer the chain, the more ordered the monolayer, it was difficult to clean the electrode surface covered by a self-assembled monolayer of MUA.
Conclusion
In this study, we demonstrated an impedimetric biosensor for rapid detection of a cancer-related biomarker – VEGF. The human VEGF-R1 was used as a bio-recognition element. VEGF-R1 was successively immobilized with the help of a long chain mercapto acid, 11-mercaptoundecanoic acid, onto gold electrodes. An EDC/NHS couple was used as a crosslinking agent. The detection mechanism was based on the measurement of electrochemical signal changes induced by receptor-ligand interactions. Using these interactions and with the help of EIS, VEGF was quantitatively detected. The obtained results showed a linear response range from 1 to 6 ng/mL human VEGF. This impedimetric biosensor can also be used in clinical analysis. Moreover, we investigated the effect of short chain and long chain mercapto acids used in biosensor fabrication in terms of the important parameters such as the self-assembly processes, the activation conditions of –COOH ends, linear ranges obtained for VEGF, repeatabilities and reproducibilities, and cleaning procedures. The results of the experiments showed that the parameters mentioned above were strictly dependent to the length of the chain of the mercapto acids used in the biosensor development.
Declaration of interest
The authors report no declarations of interest. The authors alone are responsible for the content and writing of the paper.
This work was financially supported by TÜBİTAK (The Scientific and Technological Research Council of Turkey, Project number: 113 Z 678).
References
- Agarwal P, Orazem ME, Garcia-Rubio LH. 1993. Electrochemical Impedance:Analysis and Interpretation. Philadelphia, UK: ASTM STP. pp. 1188.
- Bain CD, Evall J, Whitesides GM. 1989. Formation of monolayers by the coadsorption of thiols on gold: variation in the head group, tail group, and solvent. J Am Chem Soc 111:7155–7164.
- Bott AW. 2001. Electrochemical techniques for the characterization of redox polymers. Curr Separat. 19:71–75.
- Carmeliet P. 2005. Angiogenesis in life, disease and medicine. Nature 438:932–936.
- Chang BY, Park SM. 2010. Electrochemical impedance spectroscopy. Annu Rev Anal Chem. 3:207–229.
- Conn G, Soderman DD, Schaeffer MT, Wile M, Hatcher VB, Thomas KA. 1990. Purification of a glycoprotein vascular endothelial cell mitogen from a rat glioma-derived cell line. Proc Natl Acad Sci USA. 87:1323–1327.
- Cuatrecasas P, Parikh I. 1972. Adsorbents for affinity chromatography. Use of N-hydroxysuccinimide esters of agarose. Biochemistry 11:2291–2299.
- Ding SJ, Chang BW, Wu CC, Lai MR, Chang HC. 2005. Electrochemical evaluation of avidin–biotin interaction on self-assembled gold electrodes. Electrochim Acta 50:3660–3666.
- Dvorak HF, Brown LF, Detmar M, Dvorak AM. 1995. Vascular permeability factor/vascular endothelial growth factor, microvascular hyperpermeability, and angiogenesis. Am J Pathol. 146:1029–1039.
- Ferrara N. 2004. Vascular endothelial growth factor: basic science and clinical progress. Endocr Rev 25;581–611.
- Gilles MA, Hudson AQ, Borders CL. 1990. Stability of water soluble carbodiimides in aqueous solution. J Anal Biochem. 184:244–248.
- Grabarek Z, Gergely J. 1990. Zero-length crosslinking procedure with the use of active esters. Anal Biochem. 185:131–135.
- Guan JG, Miao YQ, Zhang QJ. 2004. Impedimetric biosensors. J Biosci Bioeng. 97:219–226.
- He Y, Smith SK, Day KA, Clark DE, Licence DR, Charnock-Jones DS. 1999. Alternative splicing of vascular endothelial growth factor (VEGF)-R1 (FLT-1) pre-mRNA is important for the regulation of VEGF activity. Mol Endocrinol 13:537–545.
- Hoare DG, Koshland DE. 1966. A procedure for the selective modification of carboxyl groups in proteins. Am Chem Soc. 88: 2057–2058.
- Holmes-Farley SR, Bain CD, Whitesides GM. 1988. Wetting of functionalized polyethylene film having ionizable organic acids and bases at the polymer-water interface. Langmuir. 4:921–937.
- Ivnitski D, Abdel-Hamid I, Atanasov P, Wilkins E, Stricker S. 2000. Application of electrochemical biosensors for detection of food pathogenic bacteria. Electroanalysis 12:317–325.
- Johnsson B, Löfas S, Lindquist G. 1991. Immobilization of proteins to a carboxymethyldextran modified gold surface for biospesific interaction analysis in surface plasmon resonance. Anal Biochem 198:268–277.
- K’Owino IO, Sadik OA. 2005. Impedance spectroscopy: a powerful tool for rapid biomolecular screening and cell culture monitoring. Electroanalysis 17:2101–2113.
- Katz E, Willner I. 2003. Probing biomolecular interactions at conductive and semiconductive surfaces by impedance spectroscopy: Routes to impedimetric immunosensors, DNA-sensors, and enzyme biosensors. Electroanalysis 15:913–947.
- Kendall RL, Thomas KA. 1993. Inhibition of vascular endothelial cell growth factor activity by an endogenously encoded soluble receptor. Proc Natl Acad Sci USA. 90:10705–10709.
- Kramers HA. 1929. Die dispersion und absorption von Röntgenstrahlen. Phys Zeits 30:522–523.
- Kronig RL. 1926. On the theory of dispersion of X-rays. J Opt Soc Am. 12:547–557.
- Leung DW, Cachianes G, Kuang WJ, Goeddel DV, Ferrara N. 1989. Vascular endothelial growth factor is a secreted angiogenic mitogen. Science. 246:1306–1309.
- Lisdat F, Schafer D. 2008. The use of electrochemical impedance spectroscopy for biosensing. Anal Bioanal Chem 391:1555–1567.
- Neufeld G, Cohen T, Gengrinovitch S, Poltorak Z. 1999. Vascular endothelial growth factor (VEGF) and its receptors. FASEB J 13:9–22.
- Nuzzo RG, Allara DL. 1983. Adsorption of bifunctional organic disulfides on gold surfaces. J Am Chem Soc 105:4481–4483.
- Olofsson B, Korpelainen E, Pepper MS, Mandriota SJ, Aase K, Kumar V, et al. 1998. Vascular endothelial growth factor B (VEGF-B) binds to VEGF receptor-1 and regulates plasminogen activator activity in endothelial cells. Proc Natl Acad Sci USA. 95:11709–11714.
- Orazem ME, Tribollet B. 2008. Electrochemical Impedance Spectroscopy. New Jersey, UK: John Wiley and Sons.
- Pei R, Cheng Z, Wang E, Yang X. 2001. Amplification of antigen- antibody interactions based on biotin labeled protein-streptavidin network complex using impedance spectroscopy. Biosens Bioelectron. 16:355–361.
- Porter MD, Bright TB, Allara DL, Chidsey CED. 1987. Spontaneously organized molecular assemblies. 4. Structural characterization of n-alkyl thiol monolayers on gold by optical ellipsometry, infrared spectroscopy, and electrochemistry. J Am Chem Soc. 109: 3559–3568.
- Prodromidis MI. 2010. Impedimetric immunosensors. Electrochim Acta 55:4227–4233.
- Qingwen L, Hong G, Yiming W, Guoan L, Jie M. 2001. Studies on self-assembly monolayers of cysteine on gold by XPS, QCM, and electrochemical techniques. Electroanalysis 13:1342–1346.
- Randles JEB. (1947). Kinetics of rapid electrode reactions. Discuss Faraday SocDiscussions of the Faraday Society, 1:11.
- Schreiber F. 2000. Structure and growth of self-assembling monolayers. Prog Surf Sci. 65:151–256.
- Senger DR, Van De Water LL, Brown L, Nagy J, Yeo KT, Yeo TK, et al. 1993. Vascular permeability factor (VPF, VEGF) in tumor biology. Cancer Metastasis 12:303–324.
- Senger DR, Galli SJ, Dvorak AM, Perruzzi CA, Harvey VS, Dvorak HF. 1983. Tumor cells secrete a vascular permeability factor that promotes accumulation of ascites fluid. Science 219:983–985.
- Sezgintürk MK. 2011. A new impedimetric biosensor utilizing vegf receptor-1 (flt-1): Early diagnosis of vascular endothelial growth factor in breast cancer. Biosens Bioelectron. 26:4032–4039.
- Sheehan JC, Hlavka JJ. 1956. The use of water-soluble and basic carbodiimides in peptide synthesis. J Org Chem. 21:439–441.
- Shibuya M, Yamaguchi S, Yamane A, Ikeda T, Tojo A, Matsushime H, Sato M. 1990. Nucleotide sequence and expression of a novel human receptor-type tyrosine kinase gene (flt) closely related to the fms family. Oncogene 5:519–24.
- Smith RK, Lewis PA, Weiss PS. 2004. Patterning self-assembled monolayers. Prog Sur Sci. 75:1–68.
- Velusamy V, Arshak K, Korostynska O, Oliwa K, Adley C. 2010. An overview of foodborne pathogen detection: in the perspective of biosensors. Biotechnol Adv. 28:232–254.
- Wallace DK, Wu KY. (2013). Current and future trends in treatment of severe of retinopathy prematurity. Clin. Perinatol. 40:297–310.
- Wan Y, Zhang D, Wang Y, Hou B. 2010. A 3D-impedimetric immunosensor based on foam Ni for detection of sulfate-reducing bacteria. Electrochem Commun. 12:288–291.
- Yla-Herttuala S, Alitalo K. 2003. Gene transfer as a tool to induce therapeutic vascular growth. Nat Med. 9:694–701.
- Zampetti A, Gnarra M, Borsini W, Giurdanella F, Antuzzi D, Piras A, et al. (2013).Vascular endothelial growth factor (VEGF-a) in fabry disease: Association with cutaneous and systemic manifestations with vascular involvement. Cytokine. 61:933–939.