
Abstract
In this study, we followed a DNA vector-based RNAi approach to silence the signal transducer and activator of transcription 3 (STAT3) expression in Bel-7402 cells, to explore how the Janus kinase (JAK)/STAT3 signaling pathway influences the apoptosis of hepatocarcinoma cells. According to GenBank's STAT3 cDNA, the plasmid pGCsi.U6/neoRFP STAT3, which was designed for expression of STAT3 small interfering RNA (siRNA), was constructed and synthesized, and then transfected into Bel-7402 cells using Lipofectamine 2000. Cells with or without siRNA transfection were treated in wells. The apoptotic rate was detected by flow cytometry (FCM) and by staining with the Annexin V/propidium iodide (PI) apoptosis detection kit. Simultaneously, the mitochondrial membrane potential (ΔΨm) was visualized by JC-1 fluorescence staining and observed using the inverted fluorescence microscope. Furthermore, the expression of caspase-3 protein was analyzed by Western blotting. The results showed that treatment with STAT3 siRNA displayed effects in the Bel-7402 cells, causing a significantly increased apoptotic ratio (P < 0.05). The mitochondrial membrane potential of the STAT3 siRNA group, observed by the JC-1 fluorescence staining, decreased significantly. The protein expression of active caspase-3 increased with STAT3 siRNA treatment, and was significantly higher than that of the control group (P < 0.05). STAT3 gene-silencing significantly improves the apoptotic effect against Bel-7402 cells.
Introduction
In biological systems, cells communicate through intertwined regulatory signaling networks. Increasing evidence demonstrates that abnormalities in the Janus kinase/signal transducer and activator of transcription 3 (JAK/STAT3) signaling pathway are associated with the pathogenesis of hepatocellular carcinoma (HCC) (CitationLlovet 2005, CitationBeerenwinkel et al. 2007).
STAT3 mediates signal transduction from the extracellular environment to the nucleus (CitationCheng and Lin 2005). STAT3 also regulates the expression of target genes involved in cell-cycle progression and the regulation of apoptosis, and promotes cellular transformation and abnormal cell proliferation (CitationLi et al. 2006, CitationGao et al. 2005). The deregulation and constitutive activation of STAT3 has been frequently found in a large number of primary tumors and cancer-derived cells, including hematologic malignancies, breast cancer, prostate cancer, and HCC (CitationMashimo and Ohno 2006).
RNA interference (RNAi) is an evolutionarily conserved genetic surveillance mechanism that permits the sequence-specific post-transcriptional downregulation of target genes, and RNAi technologies have been applied to study gene function and validate drug targets (CitationNiu et al. 2002).
To explore how the JAK/STAT3 signaling pathway influences HCC cell apoptosis, in this study, we use the DNA vector-based RNAi approach to silence STAT3 expression in Bel-7402 cells. The study may enable us to develop a potential therapeutic target for gene therapy in HCC.
Materials and methods
Cell culture and reagents
The Bel-7402 cells were propagated in Dulbecco's Modified Eagle's Medium (DMEM, HyClone, Logan, USA) supplemented with 10% fetal bovine serum (Gemini Bio-Products, West Sacramento, CA, USA), 100 units/ml penicillin, and 100 units/ml streptomycin (Invitrogen). All cell lines were maintained in a humidified cell culture incubator at 37°C in a humidified atmosphere of 5% CO2, with a change of media every 3–4 days. Cells were collected by trypsinization at 70–80% confluence. β-Actin was purchased from Santa Cruz (Santa Cruz, CA, USA). Caspase-3 was purchased from Cell Signaling (Beverly, MA).
Plasmid construction
The human STAT3 mRNA sequence was obtained from GenBank (Accession number NM_0003150 mRNA2144-216). BLAST was used to identify whether they were exclusive to STAT3. The target sequences (CitationHuang et al. 2014) were, forward: 5’-GCAGCAGCT GAACAACATGTTCAAGAGACATGTTGTTCAGCTGCTGCTTTTTT-3’, Reverse: 5’-CCGGCGTCGTCGACTTGTTGTACAAGTTCTCTGTACAACAAGTCGACGACGAAAAAATTAA-3’. A short hairpin RNA (shRNA) was designed for use in RNA interference (RNAi). The TTCAAGAGA sequence is part of the “loop” motif in the shRNA, and the transcription terminator is TTTTT. Restriction endonuclease sites were incorporated into the shRNA sequence, along with a sense and antisense sequence for each cDNA. Single-stranded oligonucleotide DNAs were synthesized by the Shanghai Sangon Biological Engineering Technology and Service Company (Shanghai, China). The respective cDNAs were composed of a DNA double strand and a conjunct with the pGCsi.U6/neoRFP plasmid. The plasmids were transformed into colonies of E.coli JM109. The plasmids were purified using the Plasmid Minipreps Purification System B (BioDev, Beijing, China), then verified by restriction analysis and sequencing.
Cell transfections and treatments
For the RNA interference study, we synthetized small interfering RNAs (siRNA) (scramble siRNA and STAT3 siRNA). The cellular delivery of siRNA was carried out using Lipofectamine 2000 (Invitrogen, Carlsbad, CA, USA) following the manufacturer's instructions, and optimized with various doses and post-transfection times. Cells were plated in tissue culture dishes and allowed to incubate for 12–16 h prior to transfection. The Lipofectamine 2000/DNA complexes were incubated at room temperature for 20 min prior to transfection. Transfections were allowed to proceed for 4 h, after which the transfection medium was replaced with growth medium. Cells were treated as indicated, for 24 h after transfection. Transfection efficiencies for fluorescent reporters were determined visually using an Olympus IX inverted microscope with a fluorescence attachment. Cells with or without transfected siRNA were treated in wells at 37°C in a humidified atmosphere of 5% CO2 for 48 h. The control wells had the same volume of the cell culture medium.
Flow cytometry (FCM) to detect apoptotic ratio (Annexin-V/PI staining)
After the cells were treated, 1 × 10⁶ cells/0.1 ml were collected and washed twice with PBS. The cells were resuspended in 500 μL of binding buffer and stained with 5 μL of FITC-labeled Annexin-V, according to the manufacturer's instructions. Next, 5 μL of propidium iodide (PI) was added to the samples after they were stained with Annexin-V. Following 10 min of incubation at room temperature in the dark, the cells were subjected to FCM analysis using the flow cytometer BD FACSCalibur (Becton Dickinson, San Jose, CA), within 1 h of staining. The results were analyzed via CellQuest data acquisition and analysis software.
Assay of mitochondrial membrane potential (ΔΨm) using fluorescence microscopy
To monitor mitochondrial membrane depolarization in cells following treatment, JC-1 dye (5,5′5,5 treatment, JC-1 dye membrane depolarization in cells folloal iodide, from Invitrogen, Burlington, ON, CA, USA) was used to measure the mitochondrial membrane potential ΔΨm of the Bel-7402 cells. JC-1 forms aggregates in healthy mitochondria, and shows red fluorescence. In apoptotic and necrotic cells, JC-1 does not aggregate, and the monomeric form (green fluorescence) indicates loss of mitochondrial membrane potential (CitationSethi et al. 2014). The Bel-7402 cells were incubated with 2 μl/ml JC-1 dye for 20 min at 37°C and 5% CO2. After dye incubation, the dye was aspirated from the plates and the plates were washed three times with 1 × JC-1 buffer, and examined with a fluorescent microscope. For visual verification, plates were also subjected to fluorescence microscopy (Leica DMI 4000, Germany). Fluorescence was measured first at excitation/emission 485/580 nm (red) and then at excitation/emission 485/530 nm (green). The data are expressed as the percentage of red fluorescent counts out of both red and green fluorescent counts.
Protein extraction and western blotting
The cells were rinsed once with ice-cold PBS and then lysed in ice-cold cell lysis buffer (Walterson, London, UK) containing a complete protease inhibitor cocktail (Sigma-Aldrich, Germany). The protein concentration was determined using the BCA protein assay kit and compared with a c-globulin standard curve.
Each fraction, in 7.5–12% sodium dodecyl sulfate polyacrylamide (SDS-PAGE) gel, was electrophoresed and transferred to a PVDF membrane. Membranes were blocked with 5% fat-free milk powder, in Tris-buffered saline-Tween 20 (TBS-T) (10 mM Tris-HCl, 150 mM NaCl, 0.25% Tween 20, pH 7.5) at room temperature for 2 h. The PVDF membranes were incubated with the appropriate primary antibody in TBS (TBS, pH 7.5) and 5% skimmed milk overnight at 4°C. After rinsing membranes in TBS-T, the filter was incubated with the secondary antibody in TBS-T buffer for 2 h, followed by three washes with TBS-T. Protein bands were visualized using the enhanced chemiluminescence ECL substrate. The gray values were determined by Launch VisionWorks LS software (UVP, USA).
Statistical analysis
The results were expressed as mean ± standard deviation (SD) for three independent experiments. Statistical analyses of the differences between groups were performed using the SigmaStat statistical software package (SPSS Inc., Chicago, IL, USA). The criterion for statistical significance was P < 0.05.
Results
STAT3 siRNA specifically knocks down the STAT3 protein level in Bel-7402 cells
Previous studies provided strong evidence that siRNA specific to the STAT3 gene can significantly suppress STAT3 protein expression (CitationWang et al. 2014, CitationKong et al. 2014). We transfected Bel-7402 cells with pGC-siRNA. As a control, pGC-siRNA-scramble plasmid was transfected. Compared to the non-transfected cells, scramble siRNA cells showed no reduction in STAT3 level, while STAT3 siRNA cells exhibited approximately 50% reduction in STAT3 level (P < 0.05, ).
Figure 1. STAT3 siRNA specifically knocks down the level of STAT3 in Bel-7402 cells.
Cells were transfected with either pGC-siRNA-STAT3 or pGC-siRNA-scramble. The expression level of STAT3 was determined by Western blotting. Compared to the non-transfected cells, scramble siRNA cells showed no reduction in the STAT3 level, while STAT3 siRNA cells exhibited approximately 50% reduction in the STAT3 level. *P < 0.05, as compared to control cells. 1: Control group 2: STAT3 siRNA group 3: Scramble siRNA group
Flow cytometry (FCM) for detection of apoptotic ratio
Cells with or without siRNA transfection were harvested and then stained by PI and Annexin V, and cell apoptosis was detected by FCM. The percentage of apoptotic cells were (9.22 ± 0.38) % (control), (16.47 ± 1.04) % (scramble siRNA), and (38.82 ± 0.88) % (STAT3 siRNA), respectively. The results indicated that the apoptotic rate of the STAT3 siRNA transfection group was significantly higher than that of other groups (P < 0.05) ().
Figure 2. Apoptotic rate of different groups, detected by FCM.
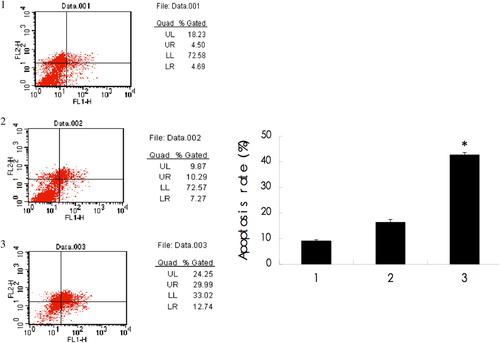
The apoptotic rate was detected by forward light scatter (FSC). The results displayed that the apoptotic rate of STAT3 siRNA was (38.82 ± 0.88) %, significantly higher than that of other groups (P < 0.05). *P < 0.05, as compared to control cells and siRNA-scramble cells. 1: Control group; 2: siRNA-scramble group; 3: STAT3 siRNA group.
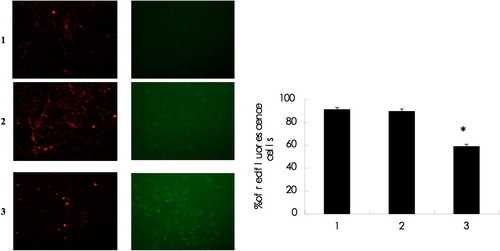
Evaluation of mitochondrial membrane potential (ΔΨm) using fluorescence microscopy
As shown in , targeting STAT3 significantly reduced the percentage of cells emitting red fluorescence (59.06 ± 1.89% for siRNA-STAT3), as compared to non-treated control or scramble siRNA-transfected cells (91.33 ± 1.78% and 89.90 ± 1.92%, P < 0.05), suggesting that disruption of mitochondria is, at least partially, responsible for the apoptotic effects induced by targeting STAT3.
Figure 3. STAT3 siRNA degrades mitochondrial membrane potential in Bel-7402 cells 1: Control group 2: siRNA-scramble group 3: STAT3 siRNA group. The mitochondrial membrane potential with STAT3 siRNA observed by the JC-1 fluorescence staining was significantly decreased when observed under the fluorescence microscope (× 200).
Expression of caspase-3 by Western blot in Bel-7402 cells
The highest level of cleaved caspase-3 (17, 19 kDa) was detected in the targeted cells, followed by those targeted at the STAT3 molecule, and the lowest level was observed in non-treated control (control) or scramble siRNA-transfected (siRNA-scramble) cells. There was no difference between groups in protein abundance of the full-length (35 kDa) caspase-3 ().
Figure 4. Targeting STAT3 increases cleaved caspase-3 levels in Bel-7402 Cells.
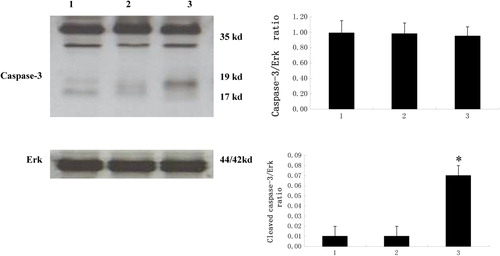
The expression of caspase-3 was determined by Western blotting, with the representative gel image shown. Western signal intensity of caspase-3 was quantified using the VisionWorks LS software, standardized to the intensity of Erk. The highest level of cleaved caspase-3 (17, 19 kDa) was detected in targeted cells, followed by those targeted for the STAT3 molecule, and the lowest level was observed in control or siRNA-scramble cells. There was no difference between groups for protein abundance of the full-length (35 kDa) caspase-3. *P < 0.05, as compared to control and siRNA-scramble groups.
Discussion
The greatest bulk of evidence implicates that STAT3 plays a crucial role in oncogenesis, carrying that signal to the nucleus and binding to specific DNA response elements that regulate gene transcription. After ligand binding with a receptor, JAK is activated, and then phosphorylates STAT3 (CitationChiablaem et al. 2014, CitationRedell and Tweardy 2005, CitationPoma et al. 2012, CitationSubramaniam et al. 2013, CitationYam et al. 2010). Dimerized STAT3 translocates to the nucleus and controls the transcription of many genes, such as Cyclin D, myc, Bcl-xl and Mcl-1 (CitationBromberg and Wang 2009, CitationAlison et al. 2005, CitationZhao et al. 2008). It is well known that STAT3 is strongly involved in the proliferation and anti-apoptosis of cancer cells.
Much effort has been made at therapeutically inactivating specific transcription factors in cancer cells (CitationWu et al. 2006, CitationLi et al. 2003), both in vitro and in vivo. Inhibition of STAT3 activity may occur at the level of activation, translocation, or DNA binding. RNA interference (RNAi) is a sequence-specific post transcriptional gene-silencing mechanism, which is triggered by double-stranded RNA (dsRNA) and causes degradation of mRNAs homologous in sequence to the dsRNA.
Apoptosis, or programmed cell death, which is a complex, genetically-determined process involved in the development and maintenance of homeostasis in multicellular organisms, has proven to be critical for the development and sustained growth of many, and perhaps all cancers, and induction of apoptosis has now been considered as an important method for antitumor therapy (CitationFarnebo et al. 2010, CitationSteder et al. 2013). In this study, we found that treatment of cells with STAT3 siRNA displayed effects in the Bel-7402 cells, causing significantly increased apoptotic ratio, as observed by FCM (the apoptotic ratios were 9.22 ± 0.38%, 16.47 ± 1.04%, and 38.82 ± 0.88%, respectively (P < 0.05).
This study observed that the cells of STAT3 siRNA caused a decrease of mitochondrial membrane potential as indicated by the decrease in aggregates (red) and increase in monomers (green), and treatment of cells with STAT3 siRNA caused a complete collapse of mitochondrial membrane potential. Apoptosis of the Bel-7402 cells induced by STAT3 gene-silencing may be mainly through the mitochondrial-caspase-mediated apoptosis pathway (CitationPerugorria et al. 2009, CitationEmeagi et al. 2013). The ΔΨm depolarization would trigger the release of cytochrome c that activates caspases in the cytosol and subsequently initiates the apoptotic cascade. Western blot showed that the expression of cleaved caspase-3 by treatment with STAT3 siRNA is upregulated, significantly higher than that in the other groups.
In conclusion, the present work demonstrates that treatment by silencing the STAT3 gene blocks the JAK/STAT3 pathway and significantly promotes apoptosis in Bel-7402 cells. The research on signaling pathway networks associated with apoptosis may lay a foundation for adjuvant therapy in cases of human hepatocellular carcinoma.
Acknowledgement
One of the authors wishes to thank the members of Central Laboratory, Liaoning Medical University, for their insight and technical support.
Declaration of interest
The author reports no declarations of interest. The author alone is responsible for the content and writing of the paper.
References
- Alison M, Adrian F, Nicola E, Suzanne NL, Douglas MT, Mark AB-M, Nick JR. 2005. The antipsoriatic drug anthralin accumulates in keratinocyte mitochondria, dissipates mitochondrial membrane potential, induces apoptosis through a pathway dependent on respiratory competent mitochondria. FASEB J. 19:1012–1014.
- Beerenwinkel N, Antal T, Dingli D, Traulsen A, Kinzler KW, Velculescu VE, et al. 2007. Genetic progression and the waiting time to cancer. PLoS Comput Biol. 3:e225.
- Bromberg J, Wang TC. 2009. Inflammation and cancer: IL-6 and STAT3 complete the link. Cancer Cell 15:79–80.
- Cheng G, Lin J. 2005. Evaluation of potential Stat3-regulated genes in human breast cancer. Biochem Biophys Res Commun. 335:292–299.
- Chiablaem K, Lirdprapamongkol K, Keeratichamroen S, Surarit R, Svasti J. 2014. Curcumin suppresses vasculogenic mimicry capacity of hepatocellular carcinoma cells through STAT3 and PI3K/AKT inhibition. Anticancer Res. 34:1857–1864.
- Emeagi PU, Maenhout S, Dang N, Heirman C, Thielemans K, Breckpot K. 2013. Downregulation of Stat3 in melanoma: reprogramming the immune microenvironment as an anticancer therapeutic strategy. Gene Ther. 20:1085–92.
- Farnebo M, Bykov VJ, Wiman KG. 2010. The p53 tumor suppressor: a master regulator of diverse cellular processes and therapeutic target in cancer. Biochem Biophys Res Commun. 396:85–89.
- Gao L, Zhang L, Hu J, Li F, Shao Y, Zhao D, et al. 2005. Down-Regulation of signal transducer and activator of transcription 3 expression using vector-based small interfering rnas suppresses growth of human prostate tumor in vivo. Clin Cancer Res. 11:6333–6341.
- Huang CY, Tai WT, Hsieh CY, Hsu WM, Lai YJ, Chen L, et al. 2014. A sorafenib derivative and novel SHP-1 agonist, SC-59, acts synergistically with radiotherapy in hepatocellular carcinoma cells through inhibition of STAT3. Cancer Lett. 349:136–143.
- Kong J, Kong F, Gao J, Zhang Q, Dong S, Gu F, et al. 2014. YC-1 enhances the anti-tumor activity of sorafenib through inhibition of signal transducer and activator of transcription 3 (STAT3) in hepatocellular carcinoma. Mol Cancer. 13:7.
- Li K, Lin SY, Brunicardi FC, Seu P. 2003. Use of RNA interference to target cyclin E-overexpressing hepatocellular carcinoma. Cancer Res. 63:3593–7.
- Li WC, Ye SL, Sun RX, Liu YK, Tang ZY, Kim Y, et al. 2006. Inhibition of growth and metastasis of human hepatocellular carcinoma by antisense oligonucleotide targeting signal transducer and activator of transcription3. Clin Cancer Res. 12:7140–7148.
- Llovet JM. 2005. Updated treatment approach to hepatocellular carcinoma. J Gastroenterol. 40:225–235.
- Mashimo K, Ohno Y. 2006. Ethanol hyperpolarizes mitochondrial membrane potential and increases mitochondrial fraction in cultured mouse myocardial cells. Arch Toxicol. 80:421–428.
- Niu G, Bowman T, Huang M, Shivers S, Reintgen D, Daud A, et al. 2002. Roles of activated Src and Stat3 signaling in melanoma tumor cell growth. Oncogene. 21:7001–7110.
- Perugorria MJ, Castillo J, Latasa MU, Goñi S, Segura V, Sangro B, et al. 2009. Wilms’ tumor 1 gene expression in hepatocellular carcinoma promotes cell dedifferentiation and resistance to chemotherapy. Cancer Res. 69:1358–67.
- Poma P, Labbozzetta M, Vivona N, Porcasi R, D’Alessandro N, Notarbartolo M. 2012. Analysis of possible mechanisms accounting for raf-1 kinase inhibitor protein downregulation in hepatocellular carcinoma. OMICS. 16:579–588.
- Redell MS, Tweardy DJ. 2005. Targeting transcription factors for cancer therapy. Curr Pharm Des. 11:2873–2887.
- Sethi G, Chatterjee S, Rajendran P, Li F, Shanmugam MK, Wong KF, et al. 2014. Inhibition of STAT3 dimerization and acetylation by garcinol suppresses the growth of human hepatocellular carcinoma in vitro and in vivo. Mol Cancer. 13:66.
- Steder M, Alla V, Meier C, Spitschak A, Pahnke J, Fürst K, et al. 2013. DNp73 exerts function in metastasis initiation by disconnecting the inhibitory role of EPLIN on IGF1R-AKT/STAT3 signaling. Cancer Cell. 24:512–527.
- Subramaniam A, Shanmugam MK, Ong TH, Li F, Perumal E, Chen L, et al. 2013. Emodin inhibits growth and induces apoptosis in an orthotopic hepatocellular carcinoma model by blocking activation of STAT3. Br J Pharmacol. 170:807–821.
- Wang P, Xue Y, Han Y, Lin L, Wu C, Xu S, et al. 2014. The STAT3-binding long noncoding RNA lnc-DC controls human dendritic cell differentiation. Science. 344:310–333.
- Wu XJ, Stahl T, Hu Y, Kassie F, Mersch-Sundermann V. 2006. The production of reactive oxygen species and the mitochondrial membrane potential are modulated during onion oil-induced cell cycle arrest and apoptosis. J Nutr. 136:608–613.
- Yam JW, Wong CM, Ng IO. 2010. Molecular and functional genetics of hepatocellular carcinoma. Front Biosci (Schol Ed). 2:117–134.
- Zhao J, Dong L, Lu B, Wu G, Xu D, Chen J, et al. 2008. Down-regulation of osteopontin suppresses growth and metastasis of hepatocellular carcinoma via induction of apoptosis. Gastroenterology. 135:956–968.