
Abstract
The investigators had previously shown that the risk of AIDS/HIV-related illness and transmission reduced (by 96%) with early antiretroviral treatment. Nanomaterials could be applied in early diagnosis of HIV by improving the ability to detect serum biomarkers of the blood-borne infectious diseases, with low sample volume, rapidity, and more sensitivity than currently available FDA-approved methods such as ELISA, particle agglutination assay, and Western Blotting assay. We have demonstrated several experimental studies for optical HIV diagnosis based on nanomaterials in three categories (e.g., the fluorescence-, the SPR-, and the SERS- based biosensors), and have explained each assay.
Keywords::
| Abbreviations | ||
| Ab | = | antibody |
| AgNP | = | Silver Nanoparticle |
| AgNPs | = | Silver Nanoparticles |
| AgNR | = | Silver Nanorod |
| AgNRs | = | Silver Nanorods |
| AIDS | = | Acquired Immunodeficiency Syndrome |
| aM | = | Attomolar, 10 − 18 mol/dm3 |
| AuNPs | = | Gold Nanoparticles |
| AuNRs | = | Gold Nanorods |
| BCA | = | biobarcode amplification |
| ELISA | = | Enzyme-Linked Immunosorbent Assay |
| FNBs | = | fluorescent nanosized polymeric beads |
| FRET | = | fluorescence resonance energy transfer |
| gp120MAbs | = | gp120 monoclonal antibody |
| HIV | = | Human Immunodeficiency Virus |
| HIV-1 PR | = | HIV-1 protease |
| HIV-1 RT | = | HIV-1 reverse transcriptase |
| HQ | = | o-hydroxyl phenol |
| HRS | = | Hyper-Rayleigh Scattering |
| MBs | = | magnetic beads |
| MNPs | = | Magnetite nanoparticles (Fe3O4 NPs) |
| MPs | = | microparticles |
| NNI | = | National Nanotechnology Initiative |
| NPs | = | Nanoparticles |
| PRLS | = | plasmon resonance light scattering |
| PSA | = | prostate-specific antigen |
| QD | = | Quantum Dot |
| QdotBs | = | QD barcodes |
| QDs | = | Quantum Dots |
| Rh6G | = | Rhodamine 6G |
| SERS | = | surface-enhanced Raman scattering |
| SPR | = | Surface Plasmon Resonance |
| WB | = | Western Blotting (assay) |
| zM | = | Zeptomolar, 10 −21 mol/dm3 |
Introduction
Nanotechnology is science, engineering, and technology conducted at the nanoscale, which is about 1–100 nanometers (NNI definition of nanotechnology), and nanomaterials are materials with nanoscale dimensions (at least in one dimension). Nanomaterials are prepared and synthesized by various methods (CitationValizadeh and Farkhani 2014, CitationValizadeh et al. 2014, CitationFarkhani and Valizadeh 2014), and used for various applications (CitationAjayan and Zhou 2001, CitationValizadeh et al. 2012, CitationSohrabi et al. 2014, CitationBadrzadeh et al. 2014, CitationFarkhani et al. 2014). Today, some of the nanomaterials are applied for the detection and diagnosis of different targets, such as macromolecules (e.g., protein (CitationCourty et al. 2006, CitationBoeneman et al. 2010), RNA and DNA (CitationCao et al. 2002)), viruses (e.g., HIV (CitationKim et al. 2009), hepatitis B (CitationWang et al. 2010), influenza A (CitationCui et al. 2011)), bacteria (e.g., E.coli (CitationHirschey et al. 2006), Salmonella Typhimurium (CitationYang and Li 2006), Staphylococcus aureus (CitationXue et al. 2009)), eukaryotic cells (e.g., human mesenchymal stem cells (CitationSeleverstov et al. 2006), cancer cells (CitationEl-Sayed et al. 2005)), and so on.
Acquired immunodeficiency syndrome (AIDS) is a global pandemic disease that results from infection by the human immunodeficiency virus (HIV). HIV is a lentivirus of the retroviridae family, mostly known as being the causative agent of AIDS (CitationLevy 2007). The rate of HIV-1 infection has reached pandemic levels, with an estimated 34.2 million people infected in 2011, and 2.5 million people newly infected with HIV in 2012–2013 (CitationUNAIDS 2012, CitationFayaz 2012). The HIV virus (with a diameter of about 120 nm) is one of the most variable viruses, which is due to its high nucleotide substitution rate. HIV can be seen as a biological nanostructure (around 100–150 nm). This virus is composed of a host-derived membrane, a nucleocapsid, and genetic material in the form of RNA containing 9 genes that encode 19 proteins. Three of these genes (gag, pol, and env) contain information needed to make the structural proteins for new virus particles, and the six other genes (tat, rev, nef, vif, vpu (or vpx for HIV-2), and vpr) are regulatory genes for proteins that control the ability of HIV to infect cells, produce new copies of virus (replicate), or cause disease (CitationKuiken et al. 2009).
Researchers had previously shown that the risk of AIDS/HIV-related illness and transmission reduced (by 96%) with early antiretroviral treatment (CitationCohen et al. 2011). Therefore, early diagnosis of infection with HIV is very important for treatment and therapy. Nanomaterials could be applied in early diagnosis of HIV by improving the ability to detect serum biomarkers of blood-borne infectious diseases with low sample volume, rapidity, and more sensitivity than currently available FDA-approved methods such as the enzyme-linked immunosorbent assay (ELISA), particle agglutination assay, and Western Blotting (WB) assay (CitationKlostranec et al. 2007). RNA, capsid proteins (Tat, JCV, and p24 antigen), and anti-HIV antibodies are the major viral markers of HIV-1 that have been used for detecting HIV-1 infection, screening blood donors, monitoring disease progression, and evaluating HIV-1 therapy (CitationFiebig et al. 2003, CitationPetersen et al. 1994, CitationTang et al. 2007). Here, we review several methods that apply nanomaterials for improving the sensitivity of optical detection in 3 categories: 1) The fluorescence-based biosensor, 2) the surface plasmon resonance (SPR)-based biosensor, and 3) the surface-enhanced Raman scattering (SERS)-based biosensor.
Optical detection
Optical detection is one of the methods that use a sensor or biosensor for detection, quantization, and sizing analytes or cells in in vitro or in vivo studies. Compared to the electrochemical biosensor array, the method using an optical biosensor array has many advantages such as being non-invasive, having the ability to detect multiple targets, enabling live tracking of analytes or cells in vitro/in vivo, and so on. In this paper, we have divided optical detection into three different categories:
The fluorescence-based biosensor
The SPR-based biosensor
The SERS- based biosensor
In the fluorescence-based biosensor, biosensors apply fluorescent labels (e.g., quantum dots (QDs), gold nanoparticles (AuNPs), or nanorods (NRs)) that emit light at a lower frequency than excitation light. In the case of the SPR, this technique is applied to attach NPs to target surfaces, and then analyze change of SPR using SPR microscopy. The SERS-based biosensor applies enhanced Raman scattering by molecules adsorbed on rough metal surfaces (e.g., Au or Ag NPs) or by nanostructures (e.g., gold nanostructures or nanorods).
The fluorescence-based biosensor
An ultrasensitive NP-based assay, called the biobarcode amplification (BCA) assay, uses oligonucleotides (the bio-barcodes), NP probes, and a silver amplification process for signal enhancement and optical readout (CitationTang et al. 2007). The assay, in certain settings, allows one to detect proteins such as prostate-specific antigen (PSA) with a limit of detection of 30 attomolar (aM, 10 − 18 mol/dm3) or nucleic acid targets at the level of 500 zeptomolar (zM, 10 − 21 mol/dm3). This ultrasensitive NP-based testing system could provide a more sensitive alternative to the ELISA-based systems for HIV-1 p24. Tang and coworkers have modified a NP-based BCA assay for detection of HIV-1 capsid (p24) antigen using anti-p24 antibody-coated microplates to capture viral antigen (p24) (CitationTang et al. 2007). Thus, a streptavidin-coated NP-based bio-barcode DNA is used for signal amplification, followed by detection using a chip-based scanometric method (). This assay is 150-fold more sensitive, and detects HIV-1 p24 antigen 3 days earlier than the conventional ELISA. This assay could be completed within 2–3 h (CitationTang et al. 2007). The statistical analyses were performed with GraphPad Prism software (Version 4.0, GraphPad Software, San Diego, CA).
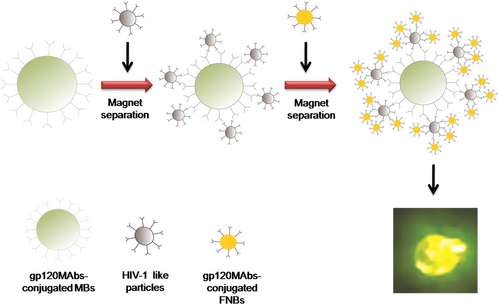
Kim and coworkers reported the direct detection of HIV using broadly neutralizing HIV-1 gp120 monoclonal antibody (gp120MAbs)-conjugated magnetic beads (MBs) and fluorescent nanosized polymeric beads (FNBs) () (CitationKim et al. 2009). MBs conjugated to gp120MAbs (gp120MAbs–MBs) were applied to isolate HIV-1 particles, whereas FNBs conjugated to gp120MAbs (gp120MAbs–FNBs) were used to generate fluorescent signals. The addition of gp120MAbs–FNBs and gp120MAbs–MBs in the presence of HIV-1 particles leads to the formation of a MBs–HIV-1 particles–FNB complex, which can be easily isolated and concentrated by common magnetic separation. The results showed that broadly neutralizing HIV-1-antibody-conjugated beads can be employed for the specific, quantitative, and rapid (less than 1.5 h) detection of HIV-1 particles with low sample volume (less than 100 μL) and without any pretreatment of samples (CitationKim et al. 2009).
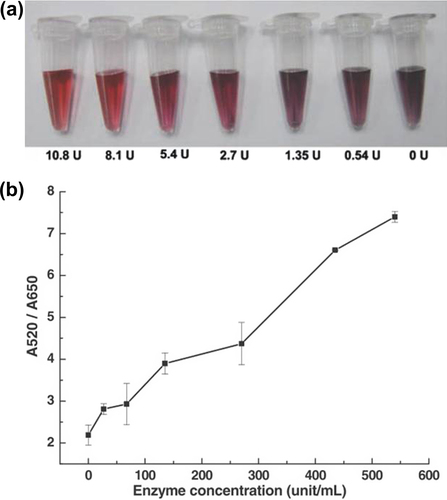
Xie et al., demonstrated the colorimetric detection of HIV-1 RNase H activity through use of unmodified AuNPs (∼14 nm) (CitationXie et al. 2011). HIV-1 RNase H effectively cleaves the RNA in the RNA–DNA duplex substrate into fragments, resulting in the dissociation of a single-stranded DNA (ssDNA) and a single-stranded RNA (ssRNA) probe (). Thus, negatively charged ssDNA sequences can effectively stabilize AuNPs against salt-induced aggregation, providing a convenient route for colorimetric assays without surface biomodification of AuNPs (no change in absorbance of AUNPs in the reaction containing a RNA–DNA duplex and the RNase H enzyme). In contrast to conventional methods, this approach offers significant advantages in terms of non-premodified RNA and fast assay response with a low concentrate detection of 27 units/mL (CitationXie et al. 2011).
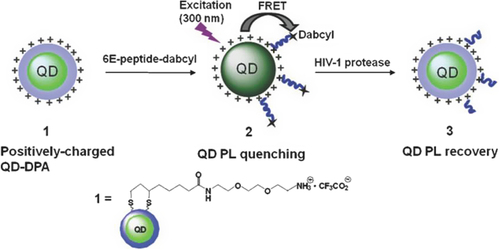
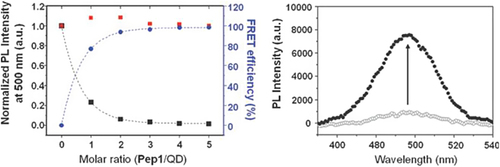
Darbha et al., showed that the second-order nonlinear optical properties of gold nanorods (AuNRs) can be used for screening HIV-1 viral DNA sequences without any modification, with good sensitivity (100 picomolar) and selectivity (single base-pair mismatch) (CitationDarbha et al. 2008). The fluorescence resonance energy transfer (FRET) is a method based on transferring of fluorescence resonance energy between two light-sensitive molecules through non-radiative energy, where one plays the role of donor and the other plays the role of acceptor. Quantum dots (QDs), a new class of fluorescent NPs, have also been employed as efficient FRET donors, which can be conjugated to acceptor dyes or AuNP-labelled peptidic substrates for sensing various targets and enzyme activities (CitationBoeneman et al. 2009, CitationChoi et al. 2010). When QDs are conjugated with ligands, they enable specific target recognition and allow tracking of dynamic functional processes with a great sensitivity for extended periods of time (CitationMahajan et al. 2012). In the recent years, the semiconductor QDs have been emerging as good candidates for single-molecule and single-particle tracking in living cells and organisms, and are often described as ‘artificial atoms’(CitationValizadeh et al. 2012). The enzyme’s ability to target the specific substrate in complex milieu is necessary for understanding most biological functions with fidelity. Due to their ability to regulate the physiological functions of many proteins by initiating irreversible hydrolysis at the post-translational level, proteases have been of increasing interest in major human diseases such as cancer, AIDS, inflammation, and neurodegenerative diseases (CitationPuente et al. 2003, CitationOverall et al. 2004). An acid-stable QD–peptide complex probe for sensing HIV-1 protease (PR) activity through the fluorescence recovery of FRET-quenched QD (prepared by electrostatic assembly with peptidic substrate) was demonstrated by Choi and colleagues () (CitationChoi et al. 2010). The peptide sequence quenched the fluorescence of QDs, and thus, by cleavage of the peptide sequence attached to the QDs by HIV-1 PR, the fluorescence of QD could be recovered. As a result, this assay allows determination of the inhibition concentration at 50% (IC 50) values for pepstatin A and saquinavir, which are employed as known protease inhibitors. To test the fluorogenic properties of the QD-based probe in the presence of HIV-1 PR, the QD–peptide complex (0.18 μM) was incubated with HIV-1 PR (0.35 μg) for 1 h at 37˚C in an acidic buffer condition (pH 4.5), resulting in an ∼8-fold increase of QD photoluminescence (PL) () (CitationChoi et al. 2010). In another study similar to the previous work, Biswas and coworkers presented a quantitative QD-based FRET assay using QDs and a unique cysteine residue (quencher) for detecting HIV-1 PR activity inside living cells (CitationBiswas et al. 2011). Recently, Suzuki and colleagues developed a single-molecule tracking assay for TatP labeled with QDs to examine the kinetics of entry of TatP into living cells (CitationSuzuki et al. 2013).
The SPR-based biosensor
The surface plasmon resonance (SPR) technique is an optical method for measuring the refractive index of very thin layers of material adsorbed on a metal (the metal/dielectric or metal/vacuum interface). The SPR-based optical biosensors are now being used extensively to:
| (1) | Define the kinetics of a wide variety of macromolecular interactions, (2) Define high- and low-affinity small molecule interactions, | ||||
| (2) | Analysis of biomolecular interaction in real time without labeling requirements (e.g., antibody–antigen, ligand–receptor, DNA–DNA, DNA–protein, lipid–protein, and complex biomolecules) (CitationPattnaik 2005). | ||||
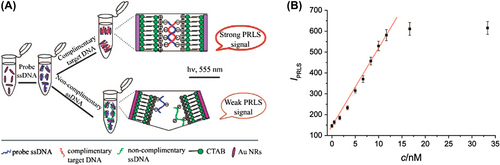
AuNPs (∼2 nm) coated with multiple copies of an amphiphilic sulfate-ended ligand are capable of binding HIV-1 gp120 as measured by SPR. They can inhibit in vitro the HIV infection of T-cells at nM concentrations. Di Gianvincenzo and coworkers demonstrated that a 50% density of sulfated ligands on ∼2 nm NPs is enough to achieve high anti-HIV activities (CitationDi Gianvincenzo et al. 2010). Zybin et al., provided optical real-time detection of single NPs on surfaces using SPR microscopy (CitationZybin et al. 2010). The technique exploits the locally altered reflections from a SPR surface caused by bound NPs and single HIV virus-like particles (having diameters of ∼100 nm). A signal-to-noise ratio of ∼4 was measured with 40 nm polystyrol particles (CitationZybin et al. 2010). In another study, He and colleagues developed a label-free optical genosensing method by employing anisotropic positively charged AuNRs and a label-free probe DNA in high ionic strength buffer for the detection of sequence-specific HIV DNA () (CitationHe et al. 2008). When target DNA is added, AuNRs aggregated, causing a color change from red to light purple, resulting in strong plasmon resonance light scattering (PRLS) signals at 555 nm. The signals are linearly enhanced and increased with increasing target DNA concentration (). In this method, a detection limit of 80pM has been achieved for HIV-1 U5 LTR segment and detection can be completed in less than 5 min (CitationHe et al. 2008).
The SERS- based biosensor
Raman spectroscopy is a powerful analytical technique for chemical and biological analysis that provides abundant information on molecular structures, surface processes, and interface reactions. Raman spectroscopy has an advantage over fluorescence spectroscopy. Fluorescence spectra are relatively broad (typically 50–100 nm, the half-widths) and lead easily to spectral overlap when multiple probes are used simultaneously, whereas Raman spectra of the same dye are much narrower (< 1 nm, the half-widths) and provide unique structural information of a molecule. Raman labels are an ideal tool for molecular genotyping due to their spectral selectivity associated with the narrow emission lines and the molecule-specific vibrational bands (CitationLigler and Taitt 2002). However, the Raman cross section is inherently weak and prevents the possibility of achieving low detection limits with normal Raman spectroscopy (CitationWabuyele and Vo-Dinh 2005). Hence, a surface-enhanced Raman scattering (SERS) technique was first observed by Fleischmann and colleagues in 1974 (CitationFleischmann et al. 1974), which enhances Raman scattering for molecules adsorbed on special metallic nanostructured surfaces and NPs (CitationJeanmaire and Van Duyne 1977, CitationAlbrecht and Creighton 1977). Recent results and reports have cited SERS enhancements from 1013 to 1015, yielding sensitivity comparable to fluorescence (CitationWabuyele and Vo-Dinh 2005). The speed, specificity, and relative ease of implementation of the SERS technique make it a very important alternative to current viral diagnostic tools and methodologies (CitationShanmukh et al. 2006). Wabuyele and coworkers demonstrated the plasmonics-based gene probe to detect nucleic acid sequences of the HIV-1 gag gene (CitationWabuyele and Vo-Dinh 2005). This assay involves a plasmonics-based nanoprobe consisting of a DNA hairpin loop having a Raman label molecule at one end and an Ag NP at the other end. SERS signal is observed when the MS (molecular sentinel) probe is in the hairpin conformation (closed state), whereas in the open state, the signal is diminished (). This assay utilized Ag colloids with a diameter of ∼35–50 nm and absorption maximum at 390 nm, and estimated that the SERS quenching efficiency was to be 75% upon hybridization of the plasmonics MS nanoprobe to the HIV-1 DNA target sequence (CitationWabuyele and Vo-Dinh 2005).
Liang et al., developed a method combining the biocompatible Ag/SiO2 NP-based Raman tags functionalized with:
| (1) | Oligonucleotides as the detection probe, | ||||
| (2) | The amino group-functionalized silica-coated magnetic NPs with capture strands as the immobilization matrix, and | ||||
| (3) | A separation tool for detection of HIV-related DNA sequences (CitationLiang et al. 2007). Ag/SiO2 nanoparticle-based Raman tags exhibit strong intensity of SERS, and the silica shells around the silver cores allow Raman tags to exhibit extraordinary and easy functionalization (it was observed that the 23 ± 1 nm silver cores are encapsulated in 12 ± 1 nm of silica shell). The magnetic NPs possess advantages including the easy separation and signal amplification. The magnetic separation not only decreases the sample loss and nonspecific reaction to the greatest extent during the washing, but also concentrates the final hybridization product, leading to enhanced Raman signal. The optimal hybridization time is 60 min (CitationLiang et al. 2007). shows the specificity of this method. | ||||
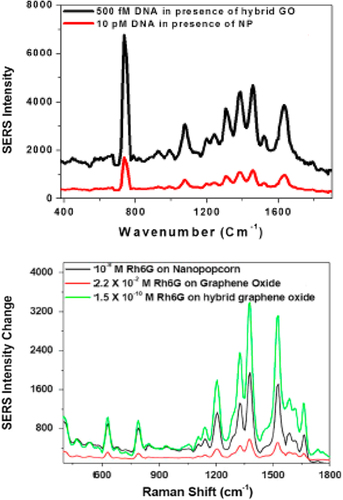
A dual-mode molecular beacon on a multiplexed substrate has been developed by Sha and coworkers that could be used for detection of human viral RNA (CitationSha et al. 2007). This assay is based on a combined SERS and fluorescent molecular beacon assay that is assembled on nanobarcode particles 300 nm wide and 6–9 μm in length. The SERS quenching efficiency was about 72%, and about 20 nM of the target with a 50 μl reaction volume was needed to completely eliminate the SERS signal (CitationSha et al. 2007). Shanmukh et al. developed SERS-based biosensors to rapidly, accurately, and cost-effectively detect extremely low levels of viruses that applied the optimal AgNR arrays generated by the oblique angle deposition, and SERS to rapidly (30–50 s) detect real-time human viruses in small specimen volumes (CitationShanmukh et al. 2006). This method can differentiate between respiratory viruses, virus strains, and viruses containing gene deletions, without manipulating the virus. The AgNR substrate properties included: overall length of 868 ± 95 nm, diameter of 99 ± 29 nm, and a density calculated to be 13.3 ± 0.5 rods μm− 2 with an average tilt angle of 71.3°± 4.0°(CitationShanmukh et al. 2006). A novel graphene oxide-based SERS probe attached to popcorn-shaped AuNPs was synthesized by Fan and colleagues (CitationFan et al. 2013). In this study, a hybrid graphene oxide-based SERS probe with ultrasensitive label-free biosensing capability (the fM level) was developed. The result demonstrated that by using a hybrid probe, Raman signals can be amplified by 11 orders of magnitude for Rhodamine 6G (Rh6G), by tuning both the electromagnetic and chemical effects simultaneously. This assay utilized 670 nm as an excitation light source, and 2 mW of laser power for the entire experiment () (CitationFan et al. 2013).
Darbha et al., reported extremely high second-order nonlinear optical properties (NLO) of AuNRs that have been monitored using the hyper-Rayleigh scattering (HRS) technique (CitationDarbha et al. 2008). This assay is used for detection of single-strand gag gene of HIV DNA with excellent sensitivity (100 pM) and selectivity (single base-pair mismatch). When a label-free 145-mer was hybridized with 100 pM target DNA, a clear colorimetric change is observed due to the aggregation (absorption maximum changes from 697 to 950 nm), and HRS intensity increases 45 times (CitationDarbha et al. 2008). In another study, a subattomolar HIV-1 DNA detection assay based on multilayer metal–molecule–metal nanojunctions (NJs) has been developed using SERS by Hu and colleagues (CitationHu et al. 2010). In this work, an easy and time saving detection platform was developed with a detection limitation at 1 × 10− 19 M (∼10 − 23 mol), a value close to that obtained via a PCR technique (). In this study, AuNPs with a diameter of 14 nm and weak SERS activity were applied (CitationHu et al. 2010).
Conclusion
In this paper, we demonstrated various nanotechnology-based methods of optical diagnosis for HIV detection, including the fluorescence-, the SRP-, and the SERS-based biosensors. In each method, several examples were listed and explained, and their advantages, disadvantages, and detection limit were noted. The optical biosensor array has many advantages, such as being a non-invasive method, enabling multiple target detection and live tracking of analytes or cells in vitro/in vivo, and so on. Thus, in this paper, we have tried to cover most experiments in this field.
Future prospects
In the future, with the development of new devices and materials that nanotechnology offers, there will be a new revolution in the detection of incurable diseases such as HIV/AIDS. These developments based on nanotechnology are:
The availability of sensitive and specific detection methods to identify HIV-1 using nanobiosensors
Prevention of sexual transmission of HIV by early diagnosis of infection, with improved sensitivity of methods
Creating and improving novel chip-detection systems
Acknowledgments
The authors are grateful for the financial support from the Department of Medical Nanotechnology, Faculty of Advanced Medical Sciences, Tabriz University of Medical Sciences, Tabriz, Iran.
Declaration of interest
The authors report no declarations of interest. The authors alone are responsible for the content and writing of the paper.
References
- Ajayan P, Zhou O. 2001. Applications of Carbon Nanotubes, in Carbon Nanotubes. In: Dresselhaus M, Dresselhaus G, Avouris P, Eds. Berlin Heidelberg: Springer. pp. 391–425.
- Albrecht MG, Creighton JA. 1977. Anomalously intense Raman spectra of pyridine at a silver electrode. J Am Chem Soc. 99:5215–5217.
- Badrzadeh F, Rahmati-Yamchi M, Badrzadeh K, Valizadeh A, Zarghami N, Farkhani SM, Akbarzadeh A. 2014. Drug delivery and nanodetection in lung cancer. Artif Cells Nanomed Biotechnol. 1–17.
- Biswas P, Cella LN, Kang SH, Mulchandani A, Yates MV, Chen W. 2011. A quantum-dot based protein module for in vivo monitoring of protease activity through fluorescence resonance energy transfer. Chem Commun (Camb). 47:5259–5261.
- Boeneman K, Delehanty JB, Susumu K, Stewart MH, Medintz IL. 2010. Intracellular bioconjugation of targeted proteins with semiconductor quantum dots. J Am Chem Soc. 132:5975–5977.
- Boeneman K, Mei BC, Dennis AM, Bao G, Deschamps JR, Mattoussi H, Medintz IL. 2009. Sensing caspase 3 activity with quantum dot− fluorescent protein assemblies. J Am Chem Soc. 131:3828–3829.
- Cao YC, Jin R, Mirkin CA. 2002. Nanoparticles with Raman spectroscopic fingerprints for DNA and RNA detection. Science. 297: 1536–1540.
- Choi Y, Lee J, Kim K, Kim H, Sommer P, Song R. 2010. Fluorogenic assay and live cell imaging of HIV-1 protease activity using acid-stable quantum dot–peptide complex. Chem Commun (Camb). 46:9146–9148.
- Cohen MS, Chen YQ, McCauley M, Gamble T, Hosseinipour MC, Kumarasamy N, et al. 2011. Prevention of HIV-1 infection with early antiretroviral therapy. N Engl J Med. 365:493–505.
- Courty S, Luccardini C, Bellaiche Y, Cappello G, Dahan M. 2006. Tracking individual kinesin motors in living cells using single quantum-dot imaging. Nano Lett. 6:1491–1495.
- Cui Z-Q, Ren Q, Wei HP, Chen Z, Deng JY, Zhang ZP, Zhang XE. 2011. Quantum dot–aptamer nanoprobes for recognizing and labeling influenza A virus particles. Nanoscale. 3:2454–2457.
- Darbha GK, Rai US, Singh AK, Ray PC. 2008. Gold-Nanorod-Based Sensing of Sequence Specific HIV-1 Virus DNA by Using Hyper-Rayleigh Scattering Spectroscopy. Chemistry. 14:3896–3903.
- Di Gianvincenzo P, Marradi M, Martínez-Avila OM, Bedoya LM, Alcamí J, Penadés S. 2010. Gold nanoparticles capped with sulfate-ended ligands as anti-HIV agents. Bioorg Med Chem Lett. 20: 2718–2721.
- El-Sayed IH, Huang X, El-Sayed MA. 2005. Surface plasmon resonance scattering and absorption of anti-EGFR antibody conjugated gold nanoparticles in cancer diagnostics: applications in oral cancer. Nano Lett. 5:829–834.
- Fan Z, Kanchanapally R, Ray PC. 2013. Hybrid Graphene Oxide Based Ultrasensitive SERS Probe for Label-Free Biosensing. J Phys Chem Lett. 4:3813–3818.
- Farkhani SM, Valizadeh A, Karami H, Mohammadi S, Sohrabi N, Badrzadeh F. 2014. Cell penetrating peptides: Efficient vectors for delivery of nanoparticles, nanocarriers, therapeutic and diagnostic molecules. Peptides. 57:78–94.
- Farkhani SM, Valizadeh A. 2014. Review: three synthesis methods of CdX (X = Se, S or Te) quantum dots. IET Nanobiotechnol. 8:59–76.
- Fayaz AM. 2012. Inactivation of microbial infectiousness by silver nanoparticles-coated condom: a new approach to inhibit HIV-and HSV-transmitted infection. Int J Nanomed. 7:5007–5018.
- Fiebig EW, Wright DJ, Rawal BD, Garrett PE, Schumacher RT, Peddada L, et al. 2003. Dynamics of HIV viremia and antibody seroconversion in plasma donors: implications for diagnosis and staging of primary HIV infection. AIDS. 17:1871–1879.
- Fleischmann M, Hendra PJ, McQuillan AJ. Raman spectra of pyridine adsorbed at a silver electrode. Chem Phys Lett. 1974. 26:163–166.
- He W, Huang CZ, Li YF, Xie JP, Yang RG, Zhou PF, Wang J. 2008. One-step label-free optical genosensing system for sequence-specific DNA related to the human immunodeficiency virus based on the measurements of light scattering signals of gold nanorods. Anal Chem. 80:8424–8430.
- Hirschey MD, Han YJ, Stucky GD, Butler A. 2006. Imaging Escherichia coli using functionalized core/shell CdSe/CdS quantum dots. J Biol Inorg Chem. 11:663–669.
- Hu J, Zheng PC, Jiang JH, Shen GL, Yu RQ, Liu GK. 2010. Sub-attomolar HIV-1 DNA detection using surface-enhanced Raman spectroscopy. Analyst. 135:1084–1089.
- Jeanmaire DL, Van Duyne RP. 1977. Surface Raman spectroelectrochemistry: Part I. Heterocyclic, aromatic, and aliphatic amines adsorbed on the anodized silver electrode. J Electroanal Chem Interfacial Electrochem. 84:1–20.
- Kim BC, Ju MK, Dan-Chin-Yu A, Sommer P. 2009. Quantitative detection of HIV-1 particles using HIV-1 neutralizing antibody-conjugated beads. Anal Chem. 81:2388–2393.
- Kim YG, Moon S, Kuritzkes DR, Demirci U. 2009. Quantum dot-based HIV capture and imaging in a microfluidic channel. Biosens Bioelectron. 25:253–258.
- Klostranec JM, Xiang Q, Farcas GA, Lee JA, Rhee A, Lafferty EI, et al. 2007. Convergence of quantum dot barcodes with microfluidics and signal processing for multiplexed high-throughput infectious disease diagnostics. Nano Lett. 7:2812–2818.
- Kuiken C, Leitner T, Foley B, Hahn B, Marx P, McCutchan F, et al. Eds. 2009. HIV Sequence Compendium. Published by Theoretical Biology and Biophysics Group, Los Alamos National Laboratory, NM, LA-UR 09-03280.
- Levy JA. 2007. HIV and the Pathogenesis of AIDS. Washington, DC: ASM Press.
- Liang Y, Gong JL, Huang Y, Zheng Y, Jiang JH, Shen GL, Yu RQ. 2007. Biocompatible core-shell nanoparticle-based surface-enhanced Raman scattering probes for detection of DNA related to HIV gene using silica-coated magnetic nanoparticles as separation tools. Talanta. 72:443–449.
- Ligler FS, Taitt CAR. 2002. Optical biosensors: present and future. Gulf Professional Publishing: Elsevier (now an imprint of Elsevier). ISBN: 0444509747, 9780444509741.
- Mahajan SD, Aalinkee R, Law W-C, Reynolds JL, Nair BB, Sykes DE, et al. 2012. Anti-HIV-1 nanotherapeutics: promises and challenges for the future. Int J Nanomed. 7:5301.
- Overall CM, Tam EM, Kappelhoff R, Connor A, Ewart T, Morrison CJ, et al. 2004. Protease degradomics: mass spectrometry discovery of protease substrates and the CLIP-CHIP, a dedicated DNA microarray of all human proteases and inhibitors. Biol Chem. 385:493–504.
- Pattnaik P. 2005. Surface plasmon resonance. Appl Biochem Biotechnol. 126:79–92.
- Petersen L, Satten GA, Dodd R, Busch M, Kleinman S, Grindon A, Lenes B. 1994. Duration of time from onset of human immunodeficiency virus type 1 infectiousness to development of detectable antibody. Transfusion. 34:283–289.
- Puente XS, Sánchez LM, Overall CM, López-Otín C. 2003. Human and mouse proteases: a comparative genomic approach. Nat Rev Genet. 4:544–558.
- Seleverstov O, Zabirnyk O, Zscharnack M, Bulavina L, Nowicki M, Heinrich JM, et al. 2006. Quantum dots for human mesenchymal stem cells labeling. A size-dependent autophagy activation. Nano Lett. 6:2826–2832.
- Sha MY, Penn S, Freeman G, Doering WE. 2007. Detection of human viral RNA via a combined fluorescence and SERS molecular beacon assay. NanoBiotechnology. 3:23–30.
- Shanmukh S, Jones L, Driskell J, Zhao Y, Dluhy R, Tripp RA. 2006. Rapid and sensitive detection of respiratory virus molecular signatures using a silver nanorod array SERS substrate. Nano Lett. 6:2630–2636.
- Sohrabi N, Valizadeh A, Farkhani SM, Akbarzadeh A. 2014. Basics of DNA biosensors and cancer diagnosis. Artif Cells Nanomed Biotechnol. 1–10.
- Suzuki Y, Roy CN, Promjunyakul W, Hatakeyama H, Gonda K, Imamura J, et al. 2013. Single quantum dot tracking reveals that an individual multivalent HIV-1 Tat-protein transduction domain can activate machinery for lateral transport and endocytosis. Mol Cellular Biol. 33:3036–3049.
- Tang S, Zhao J, Storhoff JJ, Norris PJ, Little RF, Yarchoan R, et al. 2007. Nanoparticle-based biobarcode amplification assay (BCA) for sensitive and early detection of human immunodeficiency type 1 capsid (p24) antigen. J Acquir Immune Defic Syndr. 46:231–237.
- UNAIDS. More than 80 countries increase their domestic investments for AIDS by over 50% between 2006 and 2011. 18 July 2012. [cited 15 November 2012]. http://www.unaids.org/en/resources/presscentre/pressreleaseandstatementarchive/2012/july/20120718prunaidsreport/.
- Valizadeh A, Bakhtiary M, Akbarzadeh A, Salehi R, Frakhani SM, Ebrahimi O. 2014. Preparation and characterization of novel electrospun poly (ε-caprolactone)-based nanofibrous scaffolds. Artif Cells Nanomed Biotechnol. 1–6.
- Valizadeh A, Farkhani SM. 2014. Electrospinning and electrospun nanofibres. IET Nanobiotechnol. 8:83–92.
- Valizadeh A, Mikaeili H, Samiei M, Farkhani SM, Zarghami N, Kouhi M, et al. 2012. Quantum dots: synthesis, bioapplications, and toxicity. Nanoscale Res Lett. 7:480.
- Wabuyele MB, Vo-Dinh T. 2005. Detection of human immunodeficiency virus type 1 DNA sequence using plasmonics nanoprobes. Analytical Chem. 77:7810–7815.
- Wang X, Lou X, Wang Y, Guo Q, Fang Z, Zhong X, et al. 2010. QDs-DNA nanosensor for the detection of hepatitis B virus DNA and the single-base mutants. Biosens Bioelectron. 25: 1934–1940.
- Xie X, Xu W, Li T, Liu X. 2011. Colorimetric Detection of HIV-1 Ribonuclease H Activity by Gold Nanoparticles. Small. 7:1393–1396.
- Xue X, Pan J, Xie H, Wang J, Zhang S. 2009. Fluorescence detection of total count of Escherichia coli and Staphylococcus aureus on water-soluble CdSe quantum dots coupled with bacteria. Talanta. 77:1808–1813.
- Yang L, Li Y. 2006. Simultaneous detection of Escherichia coli O157-H7 and Salmonella Typhimurium using quantum dots as fluorescence labels. Analyst. 131:394–401.
- Zybin A, Kuritsyn YA, Gurevich EL, Temchura VV, Überla K, Niemax K. 2010. Real-time detection of single immobilized nanoparticles by surface plasmon resonance imaging. Plasmonics. 5:31–35.