
 ?Mathematical formulae have been encoded as MathML and are displayed in this HTML version using MathJax in order to improve their display. Uncheck the box to turn MathJax off. This feature requires Javascript. Click on a formula to zoom.
Abstract
Gliclazide (G) is used to treat type 2 diabetes (T2D), and also has anti-platelet, anti-radical, and anti-inflammatory effects. G has poor water solubility and high inter-individual variations in absorption, limiting its application in type 1 diabetes (T1D). The bile acid, chenodeoxycholic acid (CDCA), has permeation-enhancing effects. Sodium alginate (SA) was used to microencapsulate G and CDCA to produce control (G-SA) and test (G-CDCA-SA) microcapsules. Both microcapsules showed uniform structure, morphology, and good stability profiles. CDCA reduced G-release at pH 7.8, while G-release was negligible at lower pH values in both microcapsules. CDCA incorporation resulted in less swelling and stronger microcapsules, suggesting improved stability.
Introduction
Gliclazide (G) is a second-generation sulfonyl urea and one of the commonly prescribed drugs for the treatment of type 2 diabetes (T2D) (CitationAl-Kassas et al. 2007). It works in T2D mainly by stimulating the release of insulin from pancreatic β-cells. However, G has many extra-pancreatic effects which include anti-platelet aggregation, anti-inflammatory, and anti-radical effects. These effects are particularly desirable in type 1 diabetes (T1D), and previous work has shown that G stimulates glucose uptake independent of insulin (CitationTormo et al. 1989). However, current G formulations have many limitations including poor oral absorption and high inter-individual variation in the pharmacokinetic and pharmacodynamic properties, which limit potential applications of G in T1D (CitationCampbellt et al. 1991). Accordingly, in order to optimize G absorption and efficacy in T1D, there is a need to incorporate a permeation-enhancing agent, preferably one with anti-diabetic or anti-inflammatory effects. The incorporation and encapsulation of such an agent can be done using the artificial cell microencapsulation (ACM) technology.
Bile acids (BA) are normally produced as a catabolic product of cholesterol metabolism and are found in the liver (CitationHylemon et al. 2009). BAs are present in the small intestine in the form of bile salts. They act as amphipathic steroid molecules, forming a better platform for permeation enhancement through biological membranes (CitationKuhajda et al. 2006, CitationHouten et al. 2006, CitationMikov et al. 2006). A good example of a permeation-enhancing agent with anti-inflammatory effects is the BA chenodeoxycholic acid (CDCA). CDCA has shown permeation-enhancing effects (CitationTsutsumi et al. 2008) similar to many other BAs (CitationYang et al. 2012). CDCA has also shown anti-inflammatory effects (CitationYasukawa et al. 2009, CitationChen et al. 2000, CitationGoyal et al. 2015). ACM can be used to encapsulate G with CDCA to produce a targeted oral delivery system using a biodegradable and biocompatible polymer, such as sodium alginate (SA) (CitationMooranian et al. 2014a, CitationNegrulj et al. 2015). Such a system should be able to deliver G orally into the lower intestine, where it is maximally absorbed (CitationAl-Salami et al. 2008d).
Thus, this study aimed to develop and characterize G-CDCA-SA microcapsules for the targeted oral delivery of G into the lower intestine, where its absorption will be further optimized by CDCA. The study also aimed to investigate the effects of incorporating CDCA on the microcapsules’ morphology, stability, and release profile at various pH and temperature values.
Materials and Method
Materials
Gliclazide (99.0% pure) and Chenodeoxycholic acid (≥ 95.0%) were purchased from Sigma Chemical Co, USA. Sodium alginate was obtained from Acros Organics, USA, and Calcium chloride anhydrous was purchased from Scharlab S.L, Australia. All the chemical reagents and solvents used were supplied by Merck, Australia.
Drug stock preparation
Drug stock suspensions of gliclazide (5 mg/mL) and chenodeoxycholic acid (40 mg/ml) were prepared by mixing the above two drug samples with 10% Ultra water-soluble gel. The 2.0%w/v calcium chloride stock solution was prepared by adding CaCl2 to HPLC water. All solutions were thoroughly mixed for 4 h and used within 48 h of preparation.
Fabrication of microcapsules
The microencapsulation of G was performed by mixing sodium alginate (SA), the BA CDCA, and G using our Büchi microencapsulator (BÜCHI Labortechnik, Switzerland). Polymer solutions containing the admixture of G and SA with or without CDCA were made up to a final concentration in a ratio of 1/3/30 respectively (CitationAl-Salami et al. 2009, CitationAl-Salami et al. 2008b). The formulated microcapsules were collected in 2% calcium chloride solution. The microcapsules were then decanted and washed repeatedly several times with deionized water. Finally, the collected beads were dried in a hot air oven between 30° and 40° C for 5 min and stored in the refrigerator for up to 24 h (CitationNayak et al. 2010).
Optical microscopy
Light microscopy is one of the convenient tools used to measure the particle size diameter as well as for structural analysis (size and shape). The Nikon YS2-H with ToupTek photonics FMA050 fixed calibrated microscope adaptor (Japan) was used. Further, to read the images, the optical microscopy (OM) software (ToupTek Digital, Japan) was utilized.
Scanning electron microscopy (SEM) and energy dispersive X-ray (EDR) spectroscopy studies
In addition to the above OM method, SEM (TESCAN MIRA3 XMU VP-FESEM, USA) was used in characterizing the surface structure of the microcapsules. EDS (Oxford Instruments, INCA X-Act, USA) was used to analyze the elemental distribution of the atoms on the microcapsules, as we have previously reported (CitationMooranian et al. 2014b). The electron micrographs of G-SA and G-CDCA-SA microcapsules were collected and analyzed.
Rheological measurements
Rheological measurements (G-SA and G-CDCA-SA) were performed at room temperature using the Visco-88 viscometer (Bohlin Visco 88, USA).
Differential scanning calorimetric analysis
Measurements were performed using a PerkinElmer DSC 8000 instrument (USA) equipped with a thermal analyzer. A sample weight of about 5.00 mg was used (CitationBiswal et al. 2009).
Fourier transform infrared (FTIR) spectral studies
FTIR spectrometer-TWO (PerkinElmer, USA) was used for determining the functional group of the prepared microcapsules and powder mixtures. The frequency range of 650–4000 cm− 1 was used as the transmission scanning range for all the samples.
Drug content and stability studies
A total of 10 g of microcapsules were weighed, dissolved in 10 ml of phosphate buffer, and stirred for 6 h. 2 ml was transferred to a 100 ml volumetric flask and the volume was made up with phosphate buffer. The drug concentration was determined spectrophotometrically at 229 nm (CitationTakka and Cali, 2012, CitationPrajapati et al. 2013, CitationPrajapati et al. 2008) using the UV spectrophotometer (Shimadzu UV–Vis Spectrophotometer 1240, Japan). A calibration curve was plotted using the drug concentration against time. The drug contents (Equation 1), production yield (Equation 2), and microencapsulation efficiency (Equation 3) were calculated from the following equations (CitationBarakat et al. 2013):
The stability testing studies of the G-SA and G-CDCA-SA microcapsules were carried out by placing them onto sterile petri dishes (10 in each) and storing in thermostatically controlled ovens at − 15°C, 5°C, 25°C, and 40°C with relative humidity set at 35%, for 72 h, using the Angelantoni Environmental and Climatic Test Chamber, Italy. The microcapsules were analyzed for appearance and drug contents. The zeta potential was examined using the Zetasizer 3000HS (Malvern Instruments, Malvern, UK) at 25°C.
Targeted drug delivery, microcapsule dissociation, and release studies
In vitro dissolution studies were carried out to examine G release profile at temperatures of 25°C and 37°C, and pH levels of 1.5, 3.0, 6.0, and 7.8. 2 g of G-SA and G-CDCA-SA microcapsules were weighed and suspended in 50 ml of phosphate buffer solution at pH values of 1.5, 3.0, 6.0 and 7.8 for 6 h at 25°C and 37°C. The dissolution medium was maintained at a speed of 200 rpm with a flow rate of 30 mL/min. The UV absorbance of the solution was measured every 200 s using Perkin Elmer Time-Controlled UV spectrometer. All analyses were carried out in triplicate (n = 3), and average values were calculated.
Swelling and mechanical resistance studies
To determine the swelling properties of the microcapsules, 100 mg of dry microcapsules were weighed and placed in 10 ml of buffer at 4 pH values (1.5, 3.0, 6.0, and 7.8) and 2 temperatures (25°C and 37°C) for 48 h. The percentage of swelling of the microcapsules was calculated from the following formula (CitationBarakat et al. 2013):
The parameter of mechanical resistance provides information about the mechanical stiffness and rigidity of microcapsules (CitationRokstad et al. 2014). The mechanical testing was carried out using a Boeco Multishaker PSU 20 (Boeco Company, Germany), as described elsewhere (CitationRokstad et al. 2014). The broken microcapsules were removed at periodically predetermined intervals. The average values were calculated from n = 3. At certain time intervals, the number of fractured or damaged microcapsules was analyzed. The mechanical strength of the microcapsules was calculated using the following formula (CitationWang, 2000):
Statistical analysis
All the statistical analyses of the experiments carried out were expressed in average/mean ± SD. The Student's t-test was used to calculate the drug content, microencapsulation efficiency, and production yield. Comparisons of statistical data between G concentrations in different microencapsulated formulations were expressed in terms of repeated measures analysis of variance (ANOVA) using each of the individual formulation excipients as fixed terms. The two-way ANOVA tool was used in assessing the swelling studies, to study the impact of pH over the microcapsules formulated and their cross-linking interaction. The Tukey HSD post-hoc comparison of means was done only when the associated main effect or interaction was statistically significant. The best line-of-fit model was obtained using GraphPad Prism software (V6; GraphPad Software, Inc. USA). The statistical significance was set at p < 0.05, and for all statistical data analysis, the program SPSS (IBM SPSS, Version 20, USA) was used.
Results and discussion
Light microscopy
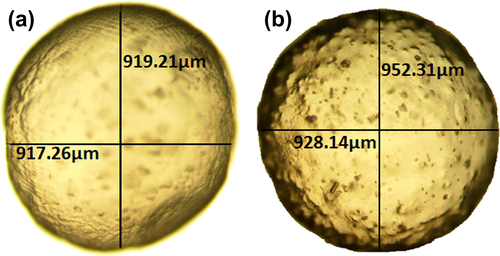
Microscopic imaging of control (G-SA) and test (G-CDCA-SA) microcapsules revealed a spherical and uniform shape. This suggests that the incorporation of CDCA did not alter the size or shape of the microcapsules ().
Figure 1. Light microscope images of (a) G-SA microcapsule (b) G-CDCA-SA microcapsule.
Scanning electron microscopy and Energy dispersive X-ray spectroscopy
The structural analysis of the surface of G-SA and G-CDCA-SA microcapsules was performed using SEM, whereas an EDXR spectrum was used to analyze the surface composition and elemental constituents. and show the SEM analysis, while and show the EDXR analysis of G-SA and G-CDCA-SA microcapsules, respectively. The microcapsules were selected from three different randomly selected batches. The results show that that the spherical shape of the microcapsules was consistent and uniform in both, and was maintained throughout the process of microencapsulation. The size of the microcapsules showed no significant changes in structure and shape ( and ). Large deposits of crystal salts were widespread throughout the surface of the microcapsules, especially the G-SA microcapsules (), which suggests sodium chloride depositions. This was further confirmed in , which shows the presence of Cl atoms on the surface of the G-SA microcapsules. Interestingly, on addition of the BA CDCA ( and ), it is clear that that the morphology and size of the crystal salts are different, and G atoms (e.g., sulfur) are now seen in the elemental analysis of the surface (), suggesting that CDCA molecules caused displacement of some G molecules to the surface of the microcapsules.
Figure 2. Scanning electron micrographs of the G-SA microcapsule (a) surface morphology at 100 μm scale (b) surface morphology at 50 μm scale (c) surface morphology at 10 μm scale (d) surface morphology at 2 μm scale.
Figure 3. Scanning electron micrographs of G-CDCA-SA microcapsule (a) surface morphology at 100 μm scale (b) surface morphology at 50 μm scale (c) surface morphology at 10 μm scale (d) surface morphology at 2 μm scale.
Figure 4. Energy dispersive X-ray spectra of G-SA microcapsules at four locations, with the corresponding analyses (1, 2, 3, and 4) respectively.
Figure 5. Energy dispersive X-ray spectra of G-CDCA-SA microcapsules at four locations, with the corresponding analyses (1, 2, 3, and 4) respectively.
Viscosity of the microencapsulated formulation
A stress-controlled Visco-88 viscometer (Bohlin-Visco 88, USA) was used, and the results are presented in . The results include viscosities, shear rate, torque force, and shear stress for both the microencapsulated formulations (control and test). shows that both formulations behaved as non-Newtonian fluids under shear stress conditions (CitationBerger et al.,. 2004), and the addition of the BA CDCA did not affect the rheological behaviour of the G-SA formulation, nor did it significantly affect the magnitude of deformation under varying stress conditions. In addition, the viscosity in both formulations decreased as the stress increased, suggesting thixotropic–pseudoplastic behavior. This is in line with our previous studies that showed minimum effect of BA incorporation on the rheological properties of anti-diabetic formulations (CitationMooranian et al.,. 2014c) .
Table I. Rheological parameters of G-SA and G-CDCA-SA (n = 3). Values are expressed as mean ± SD. UD: undetected.
Melting point analysis
Differential scanning calorimetry (DSC) can be used to represent the thermal behaviour of drugs relevant to their structure, hydrophilic properties, and dissociation state. DSC relates the changes in heat absorption and melting points as a direct function of temperature. The endothermic and the exothermic peak shifts generate molecular interactions between G and the polymer matrix (CitationRibeiro et al. 2005, CitationWong et al. 2002, CitationBorges et al. 2005, CitationSarmento et al. 2006). The periodical change over time determines the temperature and heat flow associated with the transition of G as a function of temperature (CitationTakka and Cali, 2012, CitationNayak et al. 2009, CitationGill et al. 2010). The thermal stability was analyzed, and the analysis is shown in [(a) CDCA powder (b) G powder (c) CDCA-SA microcapsules (d) G-SA microcapsules (e) G-CDCA-SA powder (f) SA powder].
Figure 6. Thermal scanning of (a) CDCA powder (b) G powder (c) G-CDCA-SA microcapsules (d) G-SA microcapsules (e) G-CDCA-SA powder (f) SA powder.
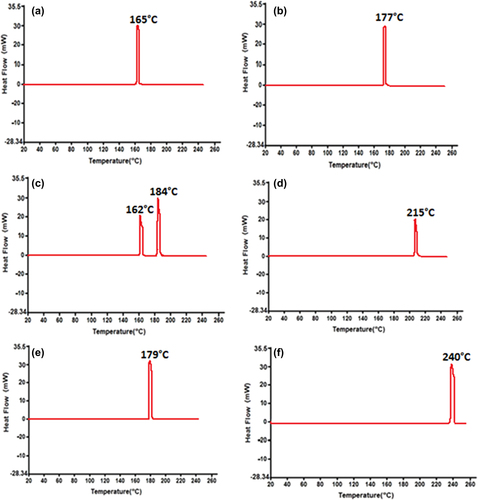
shows a sharp peak between 160°C and 170°C, confirming the melting point of CDCA. A similar sharp peak at 177°C was observed for G (). The DSC thermogram for G-CDCA-SA microcapsules () exhibits integration of prominent G and CDCA peaks, whereas the G-SA analysis () shows a small shift between 175°C and 220°C, suggesting G–polymer interaction. The physical mixture showed no significant chemical interaction (), suggesting good chemical compatibility pre-microencapsulation. The endothermic profile of SA () shows a significant peak at 240°C, and is maintained throughout the encapsulation process (CitationTakka and Cali 2012, CitationBarakat and Almurshedi 2011, CitationAcartürk and Takka 1998).
Slight shifts in the melting points of G may be caused by ionic interaction with the polymer SA, as their melting points are similar. However, this slight variation is maintained pre- and post-microencapsulation and suggests no significant compromise of G stability as a result of CDCA incorporation or the microencapsulation process. This can be further supported by the FTIR analysis of G, CDCA, and the powder mixture, pre- and post-microencapsulation.
Fourier transform infrared spectroscopic studies
The chemical interactions in heterogeneous materials can be examined using the Fourier Transform infrared (FTIR) spectroscopy. The vibrational frequencies of different functional groups associated with the molecule are well established (CitationKazarian et al. 2005, CitationKazarian and Chan, 2006, CitationChan et al. 2005). In this study, G analysis using the FTIR spectrum confirms the chemical compatibility with the SA and CDCA in the microencapsulated matrix. The FTIR spectral analysis was performed to obtain the IR spectral images of CDCA powder (), G powder (), G-CDCA-SA microcapsules (), G-SA microcapsules (), G-UDCA-SA powder mixture (), and SA powder ().
Figure 7. FTIR spectra of (a) CDCA powder (b) G powder (c) G-CDCA-SA microcapsules (d) G-SA microcapsules (e) G-CDCA-SA powder (f) SA powder.
The analysis of the CDCA powder () shows four dominant peaks, between 1018 and 3160 cm− 1. A sharp concave peak at 1707.11 cm− 1 confirms the presence of the carbonyl group for G, and the presence of the sulfonyl group is indicated by the symmetrical stretching that appeared while analyzing the G spectra at 1161.81 cm− 1 in . There were reportedly no changes observed in the frequency region, and no significant changes were observed within the microcapsule formulations during the shifting process (). The presence of G in and was confirmed by the exhibition of a peak that was complementary to the G powder (). Based on the literatures, the FTIR spectrum of SA powder () is consistent (CitationSartori et al. 1997), showing a very strong peak (O–H stretching) at 3269.86 cm− 1.
A minor shift towards the right of the G peak is observed in the G-CDCA-SA powder () and G-CDCA-SA microcapsules (). These shifts could be due to the ionic interactions taking place during the microencapsulation process, but do not seem to compromise the overall peak appearance or presence within the polymeric matrix, suggesting the chemical stability of G in the presence of CDCA, pre- and post-microencapsulation.
The microencapsulation process and drug contents
The incorporation of the BA CDCA reduced the G content per microcapsule (p < 0.01) and reduced the value of Zeta potential (− 70 ± 1.5 to − 45 ± 1.0), while the production yield and the microencapsulation efficiency remained similar (). The consistent and uniform particle size with or without CDCA can explain the lower G content of G-CDCA-SA microcapsule being replaced by CDCA. The lowering of Zeta potential after CDCA incorporation may be explained by the surfactant effects of CDCA on the dispersion system and the resultant reduction of the charge on the outer surface of the molecules (p < 0.01).
Table II. Drug contents, production yield, microencapsulation efficiency, Zeta potential, and mean particle size (n = 3), and data are expressed as average ± SD). **p < 0.01.
Stability tests
Accelerated stability studies were carried out for 3 days, testing both formulations at − 15°C, 5°C, 25°C, and 40°C, and a relative humidity maintained at 35%. When viewed visually, both formulations (G-SA and G-CDCA-SA) retained their original morphological characteristics by retaining their sphericity and homogeneity, irrespective of CDCA incorporation. At temperatures of − 15°C and 5°C, there was no change in size, color, or texture. At 25°C and 40°C, the microcapsules changed color, suggesting oxidation of the SA from cream to yellowish-orange at 25°C and dark brown at 40°C. The size of the microcapsules was significantly reduced, with the smallest microcapsules being observed at 40°C. This can be explained by the loss of moisture content, reducing the surface area and volume of the microcapsules. The microcapsules also became brittle at 40°C, most likely due to significant loss of water contents. Overall, CDCA did not affect or compromise the stability or the physical appearance of the G microcapsules.
Microcapsule release studies
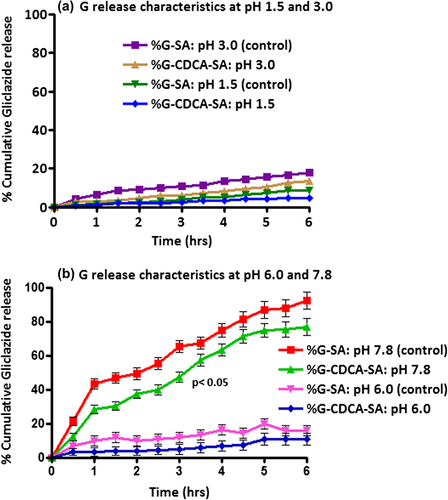
The release patterns of G from G-SA and G-CDCA-SA microcapsules were studied at 4 different pH values: 1.5, 3.0, 6.0, and 7.8. The four different pH values were chosen based on our ex vivo (CitationAl-Salami et al. 2008f, CitationAl-Salami et al. 2008e, CitationAl-Salami et al. 2008b, CitationAl-Salami et al. 2008c) and in vivo (CitationMikov et al. 2008, CitationAl-Salami et al. 2008a) studies that showed selective absorption of G at pH 7.8. Accordingly, those release studies aimed at investigating the targeted release properties of the microcapsules and the impact of CDCA incorporation. (a: at pH levels of 1.5 and 3.0, and b: at pH levels of 6.0 and 7.8) showed clearly different release patterns at pH 7.8 compared with those at the lower pH levels of 1.5, 3.0 and 6.0. The results show significant G-release only at pH 7.8, and to a small extent at pH 6.0, suggesting targeted release at the lower part of the intestine. The incorporation of CDCA did not affect G-release at pH levels of 1.5, 3.0, and 6.0, but slowed G release at pH 7.8, thus suggesting more controlled release by CDCA. This is consistent with that shows a more compact surface, suggesting a slower degradation process and microcapsule disintegration in the presence of the BA CDCA. This is also consistent with our previous studies showing BA-stabilizing effects on the membrane of SA-based microcapsules (CitationMooranian et al. 2014c).
Figure 8. G release from the microcapsules at different pH values (a) 1.5 and 3.0, and (b) 6.0 and 7.8. Data are mean ± SD, n = 3.
Swelling and mechanical resistance analysis
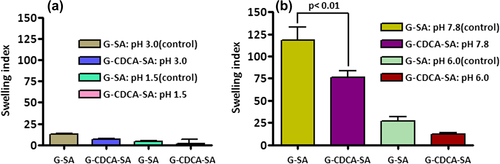
The permeation of the microcapsules is mainly affected by temperature and pH. The swelling characteristics of G-SA and G-CDCA-SA microcapsules were examined at two temperatures— 25°C and 37°C, at 4 pH values of 1.5, 3.0, 6.0, and 7.8 ( and ). shows the swelling properties of G-SA and G-CDCA-SA microcapsules at 25°C (pH 1.5 and 3.0 [a], and pH 6.0 and 7.8 [b]). Consistent with the results of release studies (), results show that only at the pH of 7.8 is G release significant, due to significant swelling and dissociation of the microcapsule. In addition, the incorporation of the BA CDCA clearly strengthens the outer layer of the microcapsules, which results in reduced swelling and slower G release. The fact that this occurs only at pH 7.8 reflects G delivery targeted at the lower site of the intestine (CitationAl-Salami et al. 2008e), suggesting targeted release of G, especially when incorporated with CDCA.
Figure 9. Swelling (at 25°C) of G-SA and G-CDCA-SA microcapsules at pH 1.5 and 3.0 (a) and pH 6.0 and 7.8 (b). Data are average ± SD, n = 3.
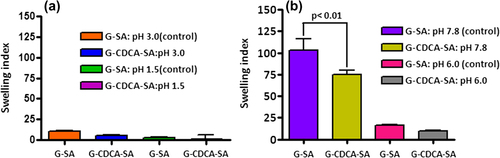
Figure 10. Swelling (at 37°C) of G-SA and G-CDCA-SA microcapsules at pH 1.5 and 3.0 (a) and pH 6.0 and 7.8 (b). Data are average ± SD, n = 3.
The mechanical resistance testing revealed the deformation and fracture responses of the microcapsules. shows that the G-SA microcapsules can maintain 100% strength under mechanical stress for 16 h. After 16 h, G-SA microcapsules (control) start to break down and clearly show surface damage. Interestingly, consistent with our previous studies, the addition of BAs exerts a membrane-reinforcing effect which leads to the development of a much stronger microcapsule and provides more resistance to mechanical strength and pressure.
Figure 11. Mechanical Strength Index for G-SA and G-CDCA-SA microcapsules. Data are average ± SD, n = 3.
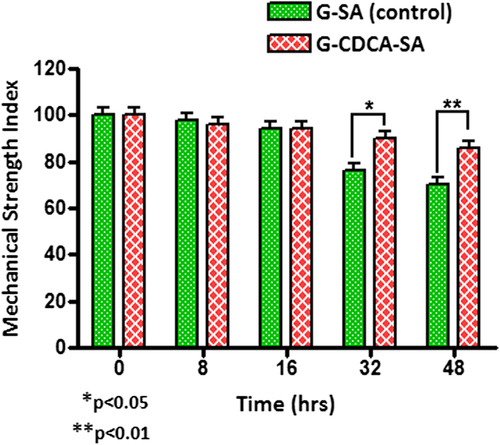
shows that CDCA incorporation resulted in strong and resilient microcapsules that were 100% intact at the end of the 48-h study, suggesting enhanced mechanical strength and stability. This is consistent with the results of swelling studies ( and ) that showed reinforced microcapsules in the presence of CDCA, compared with control.
Summary
The study aimed to incorporate a BA (CDCA) that has shown permeation-enhancing effects with a well-known anti-diabetic drug (G). The study then aimed to characterize this novel microcapsule in terms of uniformity, stability, and release profiles. The result showed better physical characteristics and release properties, and stable microcapsules upon CDCA incorporation. This can be used as a platform to deliver other lipophilic anti-diabetic drugs for targeted oral delivery. These findings can also be used to test different concentrations of BAs and their impact on the microcapsules or excipients; but also their physiological effect to act as permeation enhancers and provide better anti-diabetic effects, in vivo.
Acknowledgments
The authors acknowledge the CHIRI at Curtin University, and the Curtin Seeding Grant for the support provided, and also acknowledge the use of laboratory equipment, scientific and technical assistance of the Curtin University, and the Electron Microscope Facility, which has been partially funded by the University, State, and Commonwealth Governments. The authors also acknowledge the Pharmaceutical Technology Laboratory (Curtin School of Pharmacy). The authors would also like to acknowledge the use of equipment and assistance obtained from the School of Biomedical Sciences and the School of Public Health at Curtin University.
Declaration of interest
The authors report no declarations of interest. The authors alone are responsible for the content and writing of the paper.
Related Research Data
References
- Acartürk F, Takka S. 1998. Calcium alginate microparticles for oral administration: II. Effect of formulation factors on drug release and drug entrapment efficiency. J Microencapsulation. 16:291–301.
- Al-Kassas RS, Al-Gohary O, Al-Faadhel MM. 2007. Controlling of systemic absorption of gliclazide through incorporation into alginate beads. Int J Pharma. 341:230–237.
- Al-Salami H, Butt G, Fawcett JP, Tucker IG, Golocorbin-Kon S, Mikov M. 2008a. Probiotic treatment reduces blood glucose levels and increases systemic absorption of gliclazide in diabetic rats. Eur J Drug Metab Pharmacokinet. 33:101–106.
- Al-Salami H, Butt G, Tucker I, Fawcett PJ, Golo-Corbin-Kon S, Mikov I, Mikov M. 2009. Gliclazide reduces MKC intestinal transport in healthy but not diabetic rats. Euro J Drug Metab Pharmacokinet. 34:43–50.
- Al-Salami H, Butt G, Tucker I, Mikov M. 2008b. Influence of the semisynthetic bile acid (MKC) on the ileal permeation of gliclazide in healthy and diabetic rats. Pharmacol Rep. 60:532–541.
- Al-Salami H, Butt G, Tucker I, Mikov M. 2008c. Influence of the semisynthetic bile acid MKC on the ileal permeation of gliclazide in vitro in healthy and diabetic rats treated with probiotics. Methods Find Exp Clin Pharmacol. 30:107–113.
- Al-Salami H, Butt G, Tucker I, Mikov M. 2008d. Influence of the semisynthetic bile acid MKC on the ileal permeation of gliclazide in vitro in healthy and diabetic rats treated with probiotics. Methods Find Exp Clin Pharmacol. 30:107–113.
- Al-Salami H, Butt G, Tucker I, Skrbic R, Golocorbin-Kon S, Mikov M. 2008e. Probiotic Pre-treatment Reduces Gliclazide Permeation (ex vivo) in Healthy Rats but Increases It in Diabetic Rats to the Level Seen in Untreated Healthy Rats. ArchDrug Inf. 1:35–41.
- Al-Salami H, Butt G, Tucker IG, Mikov M. 2008f. The Influence of Pre-Treatment with Probiotics on the in Vitro Ileal Permeation of the Antidiabetic Drug Gliclazide, in Healthy and Diabetic Rats. Drug Metabol Rev. 40:81–82.
- Barakat NS, Almurshedi AS. 2011. Design and development of gliclazide‐loaded chitosan microparticles for oral sustained drug delivery: in‐vitro/in‐vivo evaluation. J Pharma Pharmacol. 63: 169–178.
- Barakat NS, Shazly GA, Almedany AH. 2013. Influence of polymer blends on the characterization of gliclazide–encapsulated into poly (epsilon-caprolactone) microparticles. Drug Dev Ind Pharm. 39:352–362.
- Berger J, Reist M, Mayer JM, Felt O, Gurny R. 2004. Structure and interactions in chitosan hydrogels formed by complexation or aggregation for biomedical applications. Eur J Pharma Biopharma. 57:35–52.
- Biswal S, Sahoo J, Murthy P. 2009. Characterisation of gliclazide-PEG 8000 solid dispersions. Tropical J Pharma Res. 8:417–424.
- Borges O, Borchard G, Verhoef JC, De Sousa A, Junginger HE. 2005. Preparation of coated nanoparticles for a new mucosal vaccine delivery system. Int J Pharma. 299:155–166.
- Campbellt D, Laviellez R, Nathan CC. 1991The mode of action and clinical pharmacology of gliclazide: A review. Diab Res Clin Prac. 14:26–31.
- Chan KLA, Elkhider N, Kazarian SG. 2005. Spectroscopic Imaging of Compacted Pharmaceutical Tablets. Chem Eng Res Des. 83: 1303–1310.
- Chen X, Yang D, Shen W, Dong HF, Wang JM, Oppenheim JJ, Howard MZ. 2000. Characterization of chenodeoxycholic acid as an endogenous antagonist of the G-coupled formyl peptide receptors. Inflamm Res. 49:744–755.
- Gill P, Moghadam TT, Ranjbar B. 2010. Differential scanning calorimetry techniques: applications in biology and nanoscience. J Biomol Tech. 21:167.
- Goyal N, Rana A, Bijjem K, Kumar P. 2015. Effect of chenodeoxycholic acid and sodium hydrogen sulfide in dinitro benzene sulfonic acid (DNBS) – Induced ulcerative colitis in rats. Pharmacol Rep. 67: 616–623.
- Houten SM, Watanabe M, Auwerx J. 2006. Endocrine functions of bile acids. EMBO J. 25:1419–1425.
- Hylemon PB, Zhou H, Pandak WM, Ren S, Gil G, Dent P. 2009. Bile acids as regulatory molecules. J Lipid Res. 50:1509–1520.
- Kazarian SG, Chan KLA. 2006. Applications of ATR-FTIR spectroscopic imaging to biomedical samples. Biochim Biophys Acta Biomembranes. 1758:858–867.
- Kazarian SG, Kong KWT, Bajomo M, Van Der Weerd J, Chan KLA. 2005. Spectroscopic Imaging Applied to Drug Release. Food Bioprod Process. 83:127–135.
- Kuhajda K, Kandrac J, Kevresan S, Mikov M, Fawcett J. 2006. Structure and origin of bile acids: An overview. Eur J Drug Metab Pharmacokin. 31:135–143.
- Mikov M, Al-Salami H, Golocorbin-Kon S, Skrbic R, Raskovic A, Fawcett JP. 2008. The influence of 3alpha,7alpha-dihydroxy-12-keto-5beta-cholanate on gliclazide pharmacokinetics and glucose levels in a rat model of diabetes. Eur J Drug Metab Pharmacokin. 33:137–142.
- Mikov M, Fawcett JP, Kuhajda K, Kevresan S. 2006. Pharmacology of bile acids and their derivatives: Absorption promoters and therapeutic agents. Eur J Drug Metab Pharmacokin. 31:237–251.
- Mooranian A, Negrulj R, Chen-Tan N, Al-Sallami HS, Fang Z, Mukkur T, et al. 2014a. Microencapsulation as a novel delivery method for the potential antidiabetic drug, Probucol. Drug Des Devel Ther. 8:1221–1230.
- Mooranian A, Negrulj R, Chen-Tan N, Fakhoury M, Arfuso F, Jones F, Al-Salami H. 2014b. Advanced bile acid-based multi-compartmental microencapsulated pancreatic beta-cells integrating a polyelectrolyte-bile acid formulation, for diabetes treatment. Artif Cells Nanomed Biotechnol. 1–8.
- Mooranian A, Negrulj R, Chen-Tan N, Watts GF, Arfuso F, Al-Salami H. 2014c. An optimized probucol microencapsulated formulation integrating a secondary bile acid (deoxycholic acid) as a permeation enhancer. Drug Des Devel Ther. 8:1673–1683.
- Nayak BS, Ghosh SK, Patro KTB. 2009. Preparation and characterization of famotidine microcapsule employing mucoadhesive polymers in combination to enhance gastro retention for oral delivery. Int J Pharm Sci. 1:112–120.
- Nayak AK, Hasnain MS, Beg S, Alam MI. 2010. Mucoadhesive beads of gliclazide: Design, development, and evaluation. Science Asia. 36:319–325.
- Negrulj R, Mooranian A, Chen-Tan N, Al-Sallami HS, Mikov M, Golocorbin-Kon S, et al. 2015. Swelling, mechanical strength, and release properties of probucol microcapsules with and without a bile acid, and their potential oral delivery in diabetes. Artif Cells Nanomed Biotechnol. 1–8.
- Prajapati S, Tripathi P, Ubaidulla U, Anand V. 2008. Design and development of gliclazide mucoadhesive microcapsules: in vitro and in vivo evaluation. AAPS PharmSciTech. 9:224–230.
- Prajapati VD, Mashru KH, Solanki HK, Jani GK. 2013. Development of modified release gliclazide biological macromolecules using natural biodegradable polymers. Int J Biol Macromol. 55:6–14.
- Ribeiro AJ, Silva C, Ferreira D, Veiga F. 2005. Chitosan-reinforced alginate microspheres obtained through the emulsification/internal gelation technique. Eur J Pharma Sci. 25:31–40.
- Rokstad AM, Lacík I, De Vos P, Strand BL. 2014. Advances in biocompatibility and physico-chemical characterization of microspheres for cell encapsulation. Adv Drug Deliv Rev. 67–68:111–130.
- Sarmento B, Ferreira D, Veiga F, Ribeiro A. 2006. Characterization of insulin-loaded alginate nanoparticles produced by ionotropic pre-gelation through DSC and FTIR studies. Carbohydr Polym. 66:1–7.
- Sartori C, Finch DS, Ralph B, Gilding K. 1997. Determination of the cation content of alginate thin films by FTi.r. spectroscopy. Polymer. 38:43–51.
- Takka S, Cali AG. 2012. Bile salt-reinforced alginate-chitosan beads. Pharm Dev Technol. 17:23–29.
- Tormo MA, Zubeldia MA, Montero JL, Campillo JE. 1989. Gliclazide increases glucose utilization by rat intestine in vitro. Diabete Metab. 15:170–175.
- Tsutsumi K, Li SK, Hymas RV, Teng CL, Tillman LG, Hardee GE, et al. 2008. Systematic studies on the paracellular permeation of model permeants and oligonucleotides in the rat small intestine with chenodeoxycholate as enhancer. J Pharm Sci. 97:350–367.
- Wang YJ. 2000. Development of new polycations for cell encapsulation with alginate. Mater Sci Eng C. 13:59–63.
- Wong TW, Chan LW, Kho SB, Sia Heng PW. 2002. Design of controlled-release solid dosage forms of alginate and chitosan using microwave. J Control Release. 84:99–114.
- Yang L, Fawcett JP, Ostergaard J, Zhang H, Tucker IG. 2012. Mechanistic studies of the effect of bile salts on rhodamine 123 uptake into RBE4 cells. Mol Pharm. 9:29–36.
- Yasukawa K, Iida T, Fujimoto Y. 2009. Relative inhibitory activity of bile acids against 12-O-tetradecanoylphorbol-13-acetate-induced inflammation, and chenodeoxycholic acid inhibition of tumour promotion in mouse skin two-stage carcinogenesis. J Pharm Pharmacol. 61:1051–1056.