
 ?Mathematical formulae have been encoded as MathML and are displayed in this HTML version using MathJax in order to improve their display. Uncheck the box to turn MathJax off. This feature requires Javascript. Click on a formula to zoom.
Abstract
Context
We have shown that the primary bile acid, cholic acid (CA), has anti-diabetic effects in vivo. Probucol (PB) is a lipophilic drug with potential applications in type 2 diabetes (T2D).
Objective
This study aimed to encapsulate CA with PB and examine the formulation and surface characteristics of the microcapsules. We also tested the microcapsules’ biological effects on pancreatic β-cells.
Methods
Using the polymer, sodium alginate (SA), two formulations were prepared: PB-SA (control), and PB-CA-SA (test). Complete characterizations of the morphology, shape, size, chemical, thermal, and rheological properties, swelling and mechanical strength, cross-sectional imaging (Micro CT), stability, Zeta-potential, drug contents, and PB release profile were carried out, at different temperature and pH values. The microcapsules were applied to a NIT-1 cell culture and the supernatant was analyzed for insulin and TNF-α concentrations.
Results
CA incorporation optimized the PB microcapsules, which exhibited pseudoplastic–thixotropic rheological characteristics. The size of the microcapsules remained similar after CA addition, and the microcapsules showed even drug distribution and no chemical alterations of the excipients. Micro-CT imaging, differential scanning calorimetry, Fourier transform infrared spectroscopy, scanning electron microscopy, and energy-dispersive X-ray spectroscopy showed consistent microcapsules with uniform shape and morphology. PB-CA-SA microcapsules enhanced NIT-1 cell viability under hyperglycemic states and resulted in improved insulin release as well as reduced cytokine production at the physiological glucose levels.
Conclusions
The addition of the primary bile acid, CA, improved the physical properties of the microcapsules and enhanced their pharmacological activity in vitro, suggesting potential applications in diabetes treatment.
Introduction
Diabetes mellitus is a chronic disorder, classified as type 1 diabetes (T1D) or type 2 diabetes (T2D) (CitationBarnett 2010, CitationTorpy et al. 2009). In the past, T2D was largely viewed as a dysregulation of blood glucose, and little attention was given to the associated inflammation, oxidative stress, and metabolic disturbances. T2D is characterized by gut-associated bile acid disturbances and dysbiosis, as well as an underlying widespread systemic inflammation and oxidative stress affecting multiple organs including the pancreas (CitationPrawitt et al. 2011, CitationFesti et al. 2011, CitationFakhoury et al. 2014b).
Probucol (PB) is a lipophilic drug and has strong radical-scavenging and antioxidant effects. PB has been shown to be beneficial in T2D by causing a reduction in inflammation and oxidative stress, increasing pancreatic β-cell viability, and improving glycemic and metabolic profiles (CitationYamashita and Matsuzawa 2009, CitationTanous et al. 2008). However, its effects are limited by its poor water solubility and dissolution, and the lack of an efficient and robust formulation for its targeted oral delivery (CitationHeeg et al. 1984, CitationHeel et al. 1978, CitationBuckley et al. 1989, CitationDavignon 1990). Thus, a reliable oral delivery formulation is needed to encapsulate PB and release it at the site of action in a controlled manner that avoids fluctuations in dose–plasma concentrations and allows for a more predictable dose–response.
In previous studies, when we incorporated the bile acid, cholic acid (CA), into sodium alginate (SA) microcapsules containing the antidiabetic drug, gliclazide, CA greatly enhanced the morphology, drug-distribution, and drug-release patterns (CitationMooranian et al. 2014f). In a more recent study, we designed novel multicompartmental microcapsules of PB with a bile acid, using low viscosity SA, which displayed great rheological properties but undesirable morphology and limited stability. Thus, this study aimed to incorporate CA into PB-SA microcapsules and study their structure, morphology, rheological parameters, and chemical and thermal stability, in vitro.
Methods
Materials
Probucol (PB, 98%, C31H48O2S2), low viscosity sodium alginate (99%) and cholic acid (CA, 98%, C24H40O5) were purchased from Sigma Chemical Co, USA. Calcium chloride dihydrate (CaCl2.2H2O, 98%) was obtained from Scharlab S.L, Australia. All solvents and reagents were supplied by Merck (Australia), and were of HPLC grade and used without further manipulation. Dulbecco's Modified Eagle's medium (DMEM) was obtained from Sigma Chemical Co, USA. Mouse ultrasensitive insulin ELISA was purchased from Mercodia (Uppsala, Sweden).
Stock suspensions of PB (10 mg/ml) and CA (1 mg/ml) were prepared by adding the powder to 10% Ultra water-soluble gel. The CaCl2 stock solution (2%) was prepared by adding CaCl2 powder to HPLC water. All preparations were mixed thoroughly at room temperature for 6 h, stored in the refrigerator, and used within 48 h of preparation.
Cell lines
The NIT-1 mouse pancreatic β-cell line was a generous gift from The University of Western Australia and St. Vincent's Institute of Medical Research (Victoria).
Preparation and characterization of microcapsules
Polymer solutions containing SA and PB with or without CA were made up to a final concentration in a PB:CA:SA ratio of 1:3:30 respectively (CitationMooranian et al. 2015a). Microcapsules were dried using stability chambers (Angelantoni Environmental and Climatic Test Chamber, Italy).
Drug content, production yield, microencapsulation efficiency, Zeta-potential, and size analysis: The determination of encapsulated drug content, production yield, efficiency of the microencapsulation process, and Zeta-potential, as well as size analysis were undertaken as previously described (CitationMooranian et al. 2014c, CitationMooranian et al. 2015a, CitationMooranian et al. 2014g).
Morphology, size analysis, and chemical characterization of microcapsules: All microcapsules were freshly made and used within 48 h of preparation. The appearance and size of microcapsules were determined using light microscopy followed by scanning electron microscopy (SEM) and energy-dispersive X-ray spectrometry (EDXR). The particle size distribution and mean particle size diameter were calculated using the software provided. PB distribution within the microcapsules was examined using a Micro-CT SkyScan instrument (Kontich, Belgium).
Optical microscopy (OM): Morphological characteristics and particle size analysis were determined with OM as described elsewhere (CitationMooranian et al. 2014e).
Scanning electron microscopy (SEM) and Energy-dispersive X-Ray (EDXR) spectroscopy: The surface morphology of the microcapsules was examined using a Zeiss Neon 40EsB FIBSEM (USA), while the chemical characterization of the microcapsules was performed using the EDXR (Oxford Instruments, INCA X-Act, USA) (CitationMooranian et al. 2014e).
Spinning disk confocal scanning microscopy of TRITC–CA chemical conjugate: To determine the partitioning of the bile acid CA within all the layers of the microcapsule, a conjugation reaction using a fluorescent compound (tetramethylrhodamine isothiocyanate; TRITC) was done based on the work of Sherman and Fisher (CitationSherman and Fisher 1986).
Swelling, mechanical strength, and drug dissolution studies: Microcapsule swelling, mechanical strength, and dissolution studies were carried out, as previously described (CitationMooranian et al. 2014c, CitationMooranian et al. 2015a, CitationMooranian et al. 2014b, CitationMooranian et al. 2014g).
In vitro buoyancy test: The buoyancy of microcapsules was tested through visual observation. Briefly, two grams of microcapsules were carefully weighed and added to 200 mL of simulated intestinal fluids (SIF) which consisted of phosphate buffer (pH 7.8). This solution was stirred by rotating paddles at 100 rpm for 24 h (USP dissolution apparatus 24, type II) at a temperature of 37°C ± 0.2, which was regulated by a thermostat. After 24 h, the number of floating microcapsules was counted visually (n = 3) and F was calculated based on the equation below:
F: floating percent; NF: number of floating microcapsules; NT: total number of microcapsules.
X-ray microtomography (Micro-CT) scanning studies: The morphology and drug distribution were examined using a SkyScan 1172A Micro-CT (Kontich, Belgium) (CitationMooranian et al. 2015a).
Physical and chemical stability: The microcapsules were tested for stability at various temperature and humidity conditions, as previously described (CitationMooranian et al. 2015a, CitationMooranian et al. 2014g, CitationMooranian et al. 2015b).
Determination of viscosity of the dispersing media
Viscosities of both preparations (PB-SA-loaded and PB-CA-SA-loaded microcapsules) were measured for 15 ml aliquots (n = 3) of freshly prepared mixtures at room temperature using Visco-88 viscometry (Bohlin Visco 88, USA).
Differential scanning calorimetric (DSC) and Fourier transform infrared (FTIR) spectral studies
DSC of PB, CA, and SA powders, their physical mixture, and their microencapsulated formulations were carried out in a DSC instrument (PerkinElmer DSC 8000, USA) as described in our previous studies (CitationMooranian et al. 2014d), while FTIR spectra of each component, their physical mixture, and the microcapsules were recorded using an attenuated total reflectance FTIR spectrometer TWO (PerkinElmer, USA).
In vitro pharmacological activity of PB-loaded microcapsules
Calorimetric assessment of pancreatic β-cell viability: To test the potential beneficial effects on pancreatic β-cells, confluent mouse β-cell line NIT-1 were cultured with PB-SA and PB-CA-SA microcapsules for 24 h at two glucose concentrations of 3.3 and 25 mmol using DMEM pH 7.4 (CitationHamaguchi et al. 1991).
Pancreatic β-cell insulin and cytokine production: To test the effect of PB-loaded microcapsules on pancreatic β-cell insulin and TNF-α output, NIT-1 cells were cultured at 5.5 mmol glucose in DMEM (pH 7.4) and treated with PB-SA (control) and PB-CA-SA microcapsules for 24 h, and levels of insulin and TNF-α were measured in the media using Mercodia (USA) and Attune Acoustic Focusing Flow Cytometer (Life Technologies, Carlsbad, California, USA) (CitationHamaguchi et al. 1991). To test the effect of PB-loaded microcapsules on the production and secretion of β-cell-derived TNF-α, NIT-1 cells were cultured at 5.5 mmol glucose in DMEM (pH 7.4) and treated with PB-SA (control) and PB-CA-SA microcapsules for 24 h (CitationHamaguchi et al. 1991). After this time point, microcapsules were removed and aliquots of the media were tested for TNF-α via cytokine bead array flow cytometric analysis.
Statistical analysis
The results are expressed as mean ± standard deviation, recorded in triplicate. For statistical analysis, two-way ANOVA with Tukey's post-hoc analysis was conducted, setting the level of significance at p < 0.05. All the statistical analyses were performed using GraphPad Prism version 6.0. The results for the p value were only reported where significance was noted.
Results and discussion
Drug content, production yield, microencapsulation efficiency, and stability studies
Drug content, production yield, microencapsulation efficiency, Zeta-potential, and size analysis
shows drug content, production yield, encapsulation efficiency, Zeta potential, and mean particle size for both PB-SA and PB-CA-SA formulations. The incorporation of CA did not significantly change PB content, production yield, microencapsulation efficiency, or particle size. However, the incorporation of CA reduced the Zeta potential value of the dispersion system, potentially reducing its stability (CitationMooranian et al. 2015a).
Table I. Drug content, production yield, and encapsulation efficiency.
The dispersion system formed by the microcapsules (PB-SA) revealed a stable system, as depicted by Zeta potential values of − 73 ± 2 mV. The incorporation of CA reduced the Zeta potential value to − 18 ± 2 mV. In general, both systems would still be capable of sustaining sufficient repulsive forces and PB-CA-SA microcapsules may still be suitable for the oral delivery of PB in T2D (CitationXie et al. 2010). The difference in Zeta potential values between both microcapsules (PB-SA and PB-CA-SA) suggests that CA does interact with the alginate matrix, resulting in a reduction in the surface charge and closer inter-microcapsule distance. This is consistent with previous work in our laboratory that showed physicochemical alterations in the outer layer of microcapsules containing the antidiabetic drug, gliclazide, brought about by CA incorporation (CitationMooranian et al. 2014f).
Optical microscopy and scanning electron microscopy
The microcapsules appeared consistently uniform and spherical in shape as determined via a calibrated scale mounted onto a glass slide. shows that the mean diameter of PB-SA microcapsules () (average ± SD) was 800 ± 30 μm, while that of PB-CA-SA microcapsules () was 860 ± 70 μm. In addition to the vertical and horizontal diameters, the microcapsule width was also obtained and there was no significant difference between test and control. The size analysis by calibrated optical microscopy revealed similar sizes and morphological characteristics between both microencapsulated formulations, and it appeared that the addition of CA to PB microcapsules did not adversely affect the size, shape, or characteristics of the PB microcapsules.
Figure 1. Optical microscopy of PB-SA (A) and PB-SA-CA (C) microcapsules. L1 corresponds to the vertical diameter and L2 to the horizontal diameter. SEM micrographs of PB-SA (B) and PB-SA-CA (D) microcapsules are also shown. Panels in B: (1) 200 μm scale, (2) surface morphology at 2 μm scale, and (3 and 4) 10 μm scale. Panels in D: (1) 200 μm scale, (2) surface morphology at 20 μm scale, and (3 and 4) 1 μm scale.
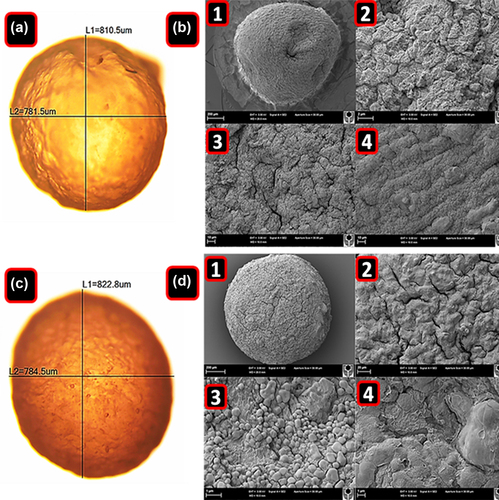
Images obtained from the scanning electron microscope (SEM) show homogeneous particle size distribution. (PB-SA) and (PB-CA-SA) are representative images of randomly selected microcapsules. However, the surface of the PB-SA (control) microcapsules appears to be rougher, and with cracks, compared with the PB-CA-SA microcapsules (test).
Energy-dispersive X-ray spectroscopy (EDXR)
For both formulations, it was evident that both small and large crystals were distributed across the microcapsule surface. These crystals coating the microcapsule surface were believed to be the drug, PB, which was confirmed by EDXR studies ().
Figure 2. Energy-dispersive X-ray spectra of PB-SA microcapsule surface showing drug deposition (a–1) and surface composition (c–2) with corresponding analyses (b and d), and energy-dispersive X-ray spectra of PB-CA-SA microcapsule surface showing drug deposition (e–1) and surface composition (g–2) with corresponding analyses (f and h).
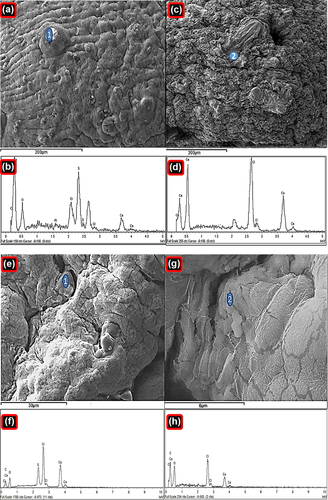
shows typical analysis of PB-SA and PB-CA-SA microcapsules. Two distinct sites were randomly investigated. This includes the agglomerates of drug deposition and the surface composition, with their corresponding spectral analyses. Results show several crystal depositions, observed at various magnifications in order to gain a better overall understanding of the surface composition (seen in , , , and ) and microcapsule surface compositions (, , and ).
Viewing the spectra of crystal depositions on the microcapsule surfaces ( and ), it appears that there are high levels of sulfur atoms present in both formulations of PB-SA and PB-CA-SA, which is in agreement with findings from previous studies (CitationGeorge and Abraham 2006, CitationKandrac et al. 2006). These findings, alongside the analysis conducted with SEM (), reaffirm that PB coats the microcapsule surface and forms drug agglomerates that are scattered throughout the microcapsule surface. These drug crystals appeared to be in higher numbers on the PB-SA microcapsules compared to the PB-CA-SA formulation, suggesting less PB accumulation on the surface after the addition of CA.
The PB-SA microcapsule surface appears more porous, with several openings in the form of cracks and spaces, while the PB-CA-SA microcapsule surface exhibits fewer pores and cracks. This can be explained as due to the reinforcement by CA, which is in line with our previous work (CitationMooranian et al. 2014a). The spectra observed in , , and of chemical analysis showed dominant atoms (Na, O, Ca, S, and Cl) that are expected for a typical PB-SA and PB-CA-SA microcapsule prepared via ionic gelation methodology (CitationAltaf 2008, CitationDavignon, 1994). Na and Cl represent sodium chloride, a by-product of ionic gelation. The sulfur atom is unique to PB (shows preferential binding to the microcapsule surface), and Ca with O appeared due to the calcium alginate composition of the microcapsule surface (CitationAwasthi and Kulkarni 2013, CitationPrajapati et al. 2008).
Spinning disk confocal scanning microscopy of TRITC–CA chemical conjugate
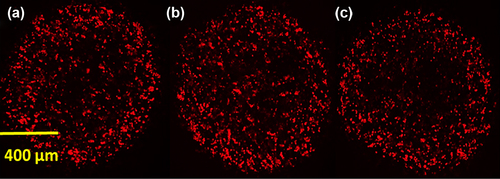
shows the distribution of the TRITC-conjugated bile acid CA within three PB-CA-SA microcapsules. It appears that the bile acid CA is distributed throughout the microcapsule matrix system, partitioning within all the layers throughout the alginate matrix system.
Figure 3. Distribution of TRITC–CA within PB-CA-SA microcapsules (a–c).
Swelling studies
and show the swelling indices of both PB-SA and PB-CA-SA microcapsules respectively, which represent the change in weight of the microcapsules at different levels of pH (3 and 7.8) and temperature (25°C and 37°C). shows the swelling characteristics of the microcapsules at 25°C. It shows more swelling of both microcapsules at higher pH. It also shows that the presence of CA reduced the swelling characteristics of the microcapsules (p < 0.01), suggesting membrane-stabilizing effects, which is in line with our previous studies (CitationNegrulj et al. 2015, CitationMooranian et al. 2014a). shows the swelling characteristics of the microcapsules at 37°C and, similar to , shows swelling-reducing effects of CA on the PB microcapsules.
Figure 4. Swelling characteristics of PB-SA and PB-CA-SA microcapsules (pH 3 and 7.8) at 25°C (a), swelling characteristics of PB-SA and PB-CA-SA microcapsules (pH 3 and 7.8) at 37°C (b), mechanical strength testing of PB-SA (control) and PB-CA-SA (test) microcapsules (c), buoyancy of PB-SA (control) and PB-CA-SA (test) microcapsules (d), probucol release over time from PB-SA and PB-CA-SA microcapsules at pH 3 and 1.5 (e), and probucol release over time from PB-SA and PB-CA-SA microcapsules at pH 7.8 and 6 (f).
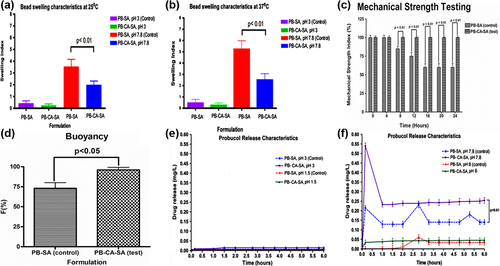
At higher pH values, the porosity and solubilization of the alginate polymer matrix is higher, thus there is greater water penetration with subsequent expansion of the membrane matrix (CitationGeorge and Abraham 2006). Temperature also plays a key part in microcapsule swelling due to increased water activity and uptake, causing erosion and disintegration of the matrix wall and allowing for greater water diffusion and subsequent loss of membrane integrity (CitationGoh et al. 2012). As expected, at pH 3, CA did not change the swelling behavior of the microcapsules at 25°C or 37°C. This suggests that CA has no effect on the SA matrix at low pH, most likely since SA is highly insoluble and impermeable to water penetration and is able to maintain its integrity at this pH. Interestingly, CA addition at pH 7.8 caused a significant reduction in microcapsule swelling, implying membrane-reinforcing effects and causing less expansion of the microcapsules, which is in line with our previous study (CitationMooranian et al. 2014d). This effect by CA is hypothesized to be via cross-linking and ionic interactions with the alginate matrix.
Mechanical strength studies
shows the mechanical strength testing of both microcapsules, PB-SA and PB-CA-SA. The incorporation of the bile acid CA greatly optimized the strength of the microcapsules, mostly likely via greater matrix reinforcement, in line with previously published work (CitationMooranian et al. 2015a, CitationMooranian et al. 2014b). Data from the mechanical strength testing complement the swelling studies, which showed reductions in swelling properties following the incorporation of CA into the formulation ( and ).
In vitro buoyancy test
shows the buoyancy of PB-SA (control) and PB-CA-SA (test) microcapsules under SIF testing conditions. As it can be seen, the percentage of floating microcapsules F (%) was 75 ± 4% for PB-SA microcapsules and 95 ± 3% for PB-CA-SA microcapsules. This high buoyancy of PB-CA-SA microcapsules means that the overwhelming majority of them would float and be retained in the distal segment of the small intestine, allowing for the gradual release of encapsulated drug contents. Microcapsules floating (i.e., buoyant) under SIF conditions mimicking the distal GIT would be able to sufficiently swell and allow PB to diffuse from the microcapsule matrix into the lumen in a sustained manner (). In addition, high mechanical stability and resistance to shear stress forces () would be greatly advantageous in preventing sudden rupture of microcapsules.
Dissolution studies
The experimental pH values used were chosen based on our previous in vitro, ex vivo, and in vivo studies examining pH values of different gut regions and their suitability for the oral absorption of potential anti-diabetics, either alone or combined with bile acids (CitationAl-Salami et al. 2009, CitationAl-Salami et al. 2012, CitationAl-Salami et al. 2008a, CitationAl-Salami et al. 2008b, CitationAl-Salami et al. 2008c, CitationAl-Salami et al. 2008d, CitationRodes et al. 2011, CitationNegrulj et al. 2013). In (pH 3 and 1.5), PB release from both formulations was almost undetectable, and the addition of CA did not affect PB release. In (pH 6 and 7.8), there was a significant PB release from PB-SA and PB-CA-SA microcapsules, with the highest release from both formulations occurring at pH 7.8.
At pH 7.8, CA enhanced the initial release of PB from the microcapsules in a monophasic pattern, compared with a triphasic pattern from PB-SA microcapsules. Furthermore, PB release from PB-SA showed 3 peaks (, dotted blue line at 0.2, 2.7, and 5.3 h), while from PB-CA-SA, PB release showed 1 large peak at pH 7.8 (, solid purple line at 0.1 h) followed by constant release, suggesting an improved targeted release profile in the presence of CA.
PB absorption is hypothesized to take place in the lower part of the intestine due to the abundance of PB-efflux transporters (CitationAndersen et al. 1988, CitationCook et al. 2012). Thus, a controlled-release microencapsulated formulation of PB targeting a pH of 7.8 should be beneficial in maximizing PB absorption, enhancing its bioavailability, reducing its inter-individual variation in absorption, and optimizing its safety profile (CitationFakhoury et al. 2014a, CitationStojancevic et al. 2013). Our results showed that at pH 7.8, PB-CA-SA microcapsules exhibited an initial release of PB, followed by a sustained release (at 0.25 mg/L) over the period of the experiment ().
At pH 7.8, CA caused PB to be released faster initially, rather than in a controlled and sustained manner. This is possibly due to the fact that instead of CA entirely integrating with the surface of the microcapsules, it displaced PB, resulting in surface agglomeration of PB.
X-ray microtomography (micro-CT) scanning studies
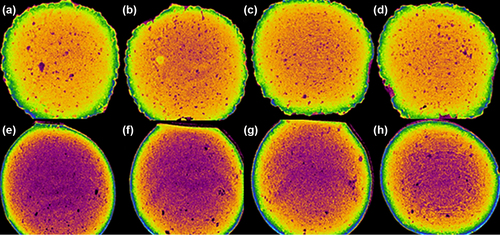
Computer-assisted X-ray micro-CT scanning is often used to determine the microstructure, internal complexity, and morphology of alginate-based microencapsulated systems (CitationArifin et al. 2011, CitationArifin et al. 2012). shows images of PB-SA microcapsules while shows PB-CA-SA microcapsules at various cross-sectional scan exposure times. Overall, the shape of the microcapsules was similar but there were notable differences in their internal complexity. There was a greater encapsulated density of material owing to bile acid partitioning within the microcapsule layers. In addition, the PB-CA-SA microcapsules presented well-defined membrane borders as opposed to PB-SA microcapsules (), and this may be explained by bile acid's membrane-stabilizing and structural support properties, which are in line with our previous work (CitationMooranian et al. 2014a).
Figure 5. Micro-CT images of PB-SA microcapsules (a–d) and PB-CA-SA microcapsules (e–h). The visible purple color in PB-CA-SA (e–h) reflects a greater density of the core of microcapsules caused by incorporation of CA into the matrix.
Viscosity of the microencapsulated formulation
The viscosity, shear rate, shear stress, and torque force for both formulations were examined under various speeds (RPM: 20, 35, 61, 107, 187 327, 572, and 1000). Results show that both formulations (PB-SA and PB-CA-SA) behaved in a non-Newtonian fashion under shear stress or force (CitationDe Celis Alonso et al. 2010). Many polymer solutions behave in this fashion, and the results of this study confirm that both formulations behave as thixotropic non-Newtonian fluids under increasing stress, as evident by parallel reductions in their apparent viscosities (CitationYang et al. 2013, CitationDraget and Taylor 2011). Further evidence of the thixotropic–pseudoplastic behavior of both formulations can be seen in the proportional increases in torque and shear rate following rising shear stress forces and associated decrease in viscosity (CitationBonino et al. 2011, CitationAl-Kassas et al. 2007). The application of the stirring rod in solutions at increasing speeds resulted in the solutions forming rapid circular motions away from the site of centripetal force, which suggests that both formulations also behaved in a non-Weissenberg fashion (CitationPamies et al. 2010, CitationLegrand et al. 2000).
Differential scanning calorimetry
DSC establishes a correlation between temperature and specific physical properties of substances, and is commonly employed to determine the enthalpy associated with the process of microencapsulation (CitationTakka and Cali 2012, CitationLin and Wang 2012). DSC is applied in microencapsulation to determine how much change would occur in the physical properties of PB molecules, along with temperature against time (CitationAjun et al. 2009, CitationGill et al. 2010). This is done through determining the temperature and heat flow (35–240°C) associated with PB transitions as a function of time (CitationAjun et al. 2009, CitationSarmento et al. 2006). DSC spectra were analyzed for PB powder (), CA powder (), SA powder (), PB-CA-SA physical powder mixture (), PB-SA microcapsules (), and PB-CA-SA microcapsules (). DSC analysis showed a prominent peak of PB powder () at 128°C, which is indicative of the melting point of PB, in accordance with the literature (CitationAjun et al. 2009, CitationThybo et al. 2008). Another thermogram conducted on CA powder () showed a small peak at 206°C, indicative of the melting point of CA (CitationBatta et al. 1991). In line with the literature, the thermogram of SA () appeared at 193°C and was also analytic of the polymer's melting point (CitationSoares et al. 2004). Analysis of a combination of PB, CA, and SA powder () showed two peaks, one representative of PB and the other representative of SA in the powder mixture. It is worth noticing that the CA peak () for CA powder does not appear in the PB-CA-SA powder mixture (). This could be explained as due to a shift in thermal capacity within the 35–240°C range or due to other interactions between all ingredients and potential crystallinity (CitationAjun et al. 2009). The CA peak is also absent in the PB-CA-SA microcapsules, possibly due to the CA formulation in the combined PB-CA-SA microcapsules existing in an amorphous or crystalline phase or a solid state solution (CitationAjun et al. 2009). As for the PB-SA microcapsules seen in , again two distinct peaks were noted. The peak at 127°C clearly depicts PB, while the one to the right at 214°C was a marginal shift to the right when compared to that of SA powder (193°C) and may indicate plasticization of the polymer (CitationTakka and Cali 2012). shows the DSC analysis of PB-CA-SA microcapsules with an interference-free integration of two peaks; one which corresponds to PB and another shifted to the right when compared to those of individual CA and SA powders. This could represent chemical interactions between SA and CA in the microcapsule matrix, alterations in the crystallinity of CA and SA within the temperature range used for analysis, polymorphism, or a possible combination of factors, leading to an endothermic shift to the right (CitationKulkarni et al. 2001, CitationSarmento et al. 2006).
Figure 6. DSC thermograms of (a) PB powder, (b) CA powder, (c) SA powder, (d) PB-CA-SA powder, (e) PB-SA microcapsule, and (f) PB-CA-SA microcapsule.
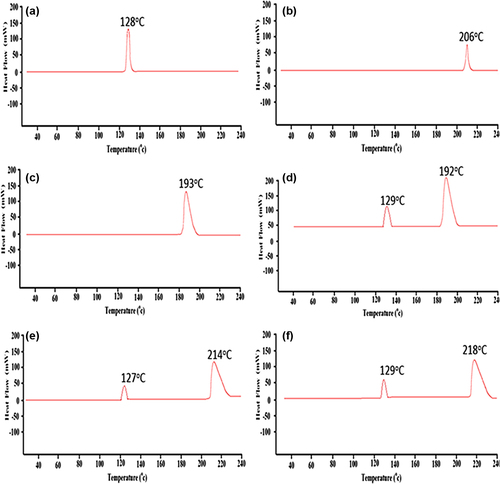
Overall, it appears that PB did not significantly participate in a cross-linking reaction, but rather retained its chemical integrity during the microencapsulation process.
FTIR spectral studies
The FTIR spectra were used to confirm the chemical compatibility of PB with the SA polymer and CA in the microencapsulation formulation. In line with the DSC analyses in , FTIR spectra were analyzed for PB powder (), CA powder (), SA powder (), PB-CA-SA powder (), PB-SA microcapsules (), and PB-CA-SA microcapsules (). FTIR spectral analysis was performed for individual powders, mixed powders containing all the ingredients, and the final microcapsules, in order to ensure the chemical compatibility of PB during and post-microencapsulation. The spectrum of PB powder () revealed characteristic peaks at 2959 cm− 1, 1422 cm− 1, and 1310 cm− 1, which are in line with previously published work (CitationAjun et al. 2009). Additionally, spectra for SA () and CA () were in line with published work, revealing peaks similar to those reported by others (CitationAwasthi and Kulkarni 2012, CitationYang et al. 2005).
Figure 7. FTIR spectra of (a) PB powder, (b) CA powder, (c) SA powder, (d) PB-CA-SA powder, (e) PB-SA microcapsule, and (f) PB-CA-SA microcapsule.
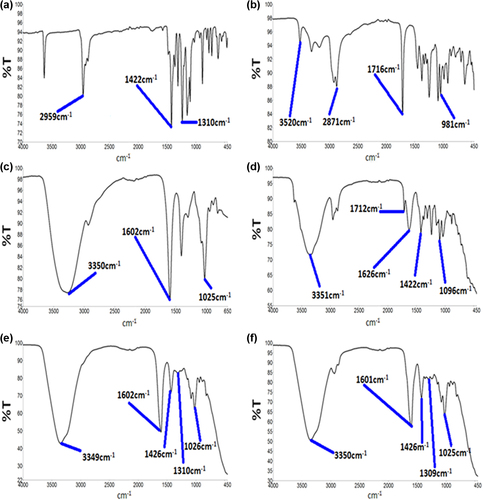
For the combined PB-CA-SA powder (), PB peaks including all the excipients were present with no interference or alterations in the bond-peak activity. This confirmed compatibility of all the ingredients in the powder form, compared to the microcapsules. illustrates the FTIR spectra of PB-SA microcapsules, clearly showing two distinct and interference-free peaks corresponding to PB (1426 cm− 1 and 1310 cm− 1), and three distinct peaks representative of alginate (3350 cm− 1, 1602 cm− 1, and 1025 cm− 1). Similar peaks were noted in in the PB-CA-SA microcapsule where PB was not modified. Moreover, peaks of PB (1426 cm− 1 and 1309 cm− 1) and alginate (3350 cm− 1, 1601 cm− 1, and 1025 cm− 1) illustrate that PB was not chemically modified following the microencapsulation process. It appears that there was no peak representative of CA within this formulation, which further supports the predicted chemical compatibility between all ingredients, with a chemical interaction occurring between the bile acid and polymer following microencapsulation. We can speculate that the DSC thermal shifts of SA in the microcapsule, along with the FTIR results, show a reaction occurring perhaps via complexation of a CA–alginate–cholate product, resulting in shadowing of CA's FTIR spectral activity. PB was not modified in either the powder mixtures or both the microencapsulation formulations, and this suggests PB stability in the microcapsules after CA addition. Thus, microencapsulation of PB with SA and CA does not significantly compromise the chemical composition and structural integrity of PB.
In vitro pharmacological activity of PB-loaded microcapsules
Calorimetric assessment of pancreatic β-cell viability
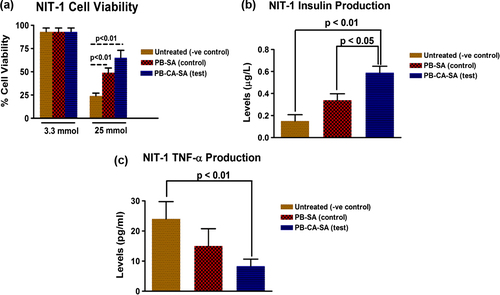
shows the calorimetric (MTT) assessment of NIT-1 cellular viability following treatment with PB-SA (control) and PB-CA-SA (test) microcapsules at glucose concentrations of 3.3 and 25mmol for 24 h. At low glucose levels of 3.3mmol, there was no difference in the groups and cell viability remained high. However, at 25 mmol, untreated NIT-1 pancreatic β-cells (− ve control) showed low viability (24%) and there was a significant improvement in viability of PB-SA-treated (49 ± 2%) and PB-CA-SA-treated (65 ± 4%) NIT-1 pancreatic β-cells. This might be attributed to the antioxidant, anti-inflammatory, and β-cell protective properties of PB which have been shown to alleviate hyperglycemia-induced oxidative stress and inflammation, in animal studies (CitationLiu et al. 2011, CitationGorogawa et al. 2002). The addition of the bile acid, CA, further enhanced these beneficial effects, and this could be attributed to improvements in the release and dissolution of PB () or the added anti-inflammatory and anti-apoptotic effects provided by the bile acid CA in PB-CA-SA microcapsules (CitationPerez and Briz 2009).
Figure 8. Cell viability at 3.3 and 25 mmol glucose (a), NIT-1 insulin production (b), and TNF-α production (c).
Pancreatic β-cell insulin and cytokine and cytokine production
shows the total insulin production of NIT-1 pancreatic β-cells at a glucose concentration of 5.5 mmol over a 24-h period for untreated cells (− ve control), PB-SA-treated (control), and PB-CA-SA treated (test). Insulin levels were 0.15 ± 0.02 μg/L (untreated cells, − ve control), 0.34 ± 0.03 μg/L (PB-SA, control) and 0.59 ± 0.03 μg/L (PB-CA-SA, test). This seems to indicate that PB-enhanced insulin production at 5.5 mmol glucose, with the bile acid containing PB-CA-SA microcapsules, resulting in the most significant insulin release at the tested conditions. The difference in insulin production could be attributed to PB's effects on enhancing β-cell biological activity, as well as the bile acid CA, which has been shown to enhance insulin production and secretion via multiple intracellular signaling pathways (CitationDüfer et al. 2012, CitationRenga et al. 2010, CitationThomas et al. 2009, CitationGorogawa et al. 2002, CitationLiu et al. 2011).
shows the total cytokine production of the pro-inflammatory cytokine TNF-α at glucose concentration of 5.5 mmol for untreated NIT-1 cells (− ve control), PB-SA-treated (control), and PB-CA-SA-treated (test). Levels of TNF-α production were lowest for PB-CA-SA treated NIT-1 β-cells, mostly likely due to the combined anti-inflammatory effects of both PB and CA from the microcapsules (CitationPerez and Briz 2009, CitationKarunakaran and Park 2013, CitationMaritim et al. 2003, CitationFukuda et al. 1995).
Conclusions
CA incorporation into PB-SA microcapsules resulted in optimized rheological parameters, good morphology, and excipient compatibility. In addition, PB-CA-SA microcapsules enhanced NIT-1 pancreatic β-cell viability under hyperglycemic states and resulted in improved insulin release as well as reduced cytokine production at physiological glucose levels. The incorporation of the bile acid CA into PB microcapsules resulted in stronger microcapsules and a more controlled release pattern, suggesting potential benefits in the oral delivery of PB in diabetes. Future experiments will now evaluate these microcapsules in our animal model of type 2 diabetes mellitus for further evaluation.
Acknowledgments
The authors acknowledge the Australian Postgraduate Award (APA) and the Curtin Research Scholarship (CRS) for their support. The authors also acknowledge the CHIRI and the use of laboratory equipment, and the scientific and technical assistance of the Curtin University Electron Microscope Facility, which has been partially funded by the University, State and Commonwealth Governments. The authors also acknowledge the Pharmaceutical Technology Laboratory (Curtin School of Pharmacy). The authors are grateful to The University of Western Australia and St. Vincent's Institute of Medical Research (Victoria) for supplying the NIT-1 β-cells.
Declaration of interest
The authors report no declarations of interest. The authors alone are responsible for the content and writing of the paper.
Related Research Data
References
- Ajun W, Yan S, Li G, Huili L. 2009. Preparation of aspirin and probucol in combination loaded chitosan nanoparticles and in vitro release study. Carbohydr Polym. 75:566–574.
- Al-Kassas RS, Al-Gohary O, Al-Faadhel MM. 2007. Controlling of systemic absorption of gliclazide through incorporation into alginate beads. Int J Pharma. 341:230–237.
- Al-Salami H, Butt G, Tucker I, Fawcett PJ, Golocorbin-Kon S, Mikov I, Mikov M. 2009. Gliclazide reduces MKC intestinal transport in healthy but not diabetic rats. Eur J Drug Metab Pharmacokinet. 34:43–50.
- Al-Salami H, Butt G, Tucker I, Golocorbin-Kon S, Mikov M. 2012. Probiotics decreased the bioavailability of the bile acid analog, monoketocholic acid, when coadministered with gliclazide, in healthy but not diabetic rats. Eur J Drug Metab Pharmacokinet. 37:99–108.
- Al-Salami H, Butt G, Tucker I, Mikov M. 2008a. Influence of the semisynthetic bile acid MKC on the ileal permeation of gliclazide in vitro in healthy and diabetic rats treated with probiotics. Methods Find Exp Clin Pharmacol. 30:107–113.
- Al-Salami H, Butt G, Tucker I, Skrbic R, Golocorbin-Kon S, Mikov M. 2008b. Probiotic Pre-treatment Reduces Gliclazide Permeation (ex vivo) in Healthy Rats but Increases It in Diabetic Rats to the Level Seen in Untreated Healthy Rats. Arch Drug Inf. 1:35–41.
- Al-Salami H, Butt G, Tucker IG, Mikov M. 2008c. The Influence of Pre-Treatment with Probiotics on the in Vitro Ileal Permeation of the Antidiabetic Drug Gliclazide, in Healthy and Diabetic Rats. Drug Metabol Rev. 40:81–82.
- Al-Salami H, Grant B, Ian T, Mikov M. 2008d. The influence of probiotics pre-treatment, on the ileal permeation of gliclazide, in healthy and diabetic rats. Arch Drug Inf. 1:35–41.
- Altaf M. 2008. Ionic gelation controlled drug delivery systems for gastric-mucoadhesive microcapsules of captopril. Indian J Pharm Sci. 70:655.
- Andersen E, Karlaganis G, Sjovall J. 1988. Altered bile acid profiles in duodenal bile and urine in diabetic subjects. Eur J Clin Invest. 18:166–172.
- Arifin DR, Long CM, Gilad AA, Alric C, Roux S, Tillement O, et al. 2011. Trimodal gadolinium-gold microcapsules containing pancreatic islet cells restore normoglycemia in diabetic mice and can be tracked by using US, CT, and positive-contrast MR imaging. Radiology. 260:790–798.
- Arifin DR, Manek S, Call E, Arepally A, Bulte JW. 2012. Microcapsules with intrinsic barium radiopacity for immunoprotection and X-ray/CT imaging of pancreatic islet cells. Biomaterials. 33:4681–4689.
- Awasthi R, Kulkarni GT. 2012. Development of novel gastroretentive floating particulate drug delivery system of gliclazide. Curr Drug Deliv. 9:437–451.
- Awasthi R, Kulkarni GT. 2013. Development of novel gastroretentive drug delivery system of gliclazide: hollow beads. Drug Dev Ind Pharm. 1–11.
- Barnett R. 2010. Historical keyword: diabetes. Lancet. 375:191.
- Batta AK, Aggarwal SK, Salen G, Shefer S. 1991. Selective reduction of oxo bile acids: synthesis of 3 beta-, 7 beta-, and 12 beta-hydroxy bile acids. J Lipid Res. 32:977–983.
- Bonino CA, Samorezov JE, Jeon O, Alsberg E, Khan SA. 2011. Real-time in situ rheology of alginate hydrogel photocrosslinking. Soft Matter. 7:11510–11517.
- Buckley MM, Goa KL, Price AH, Brogden RN. 1989. Probucol. A reappraisal of its pharmacological properties and therapeutic use in hypercholesterolaemia. Drugs. 37:761–800.
- Cook MT, Tzortzis G, Charalampopoulos D, Khutoryanskiy VV. 2012. Microencapsulation of probiotics for gastrointestinal delivery. J Control Release. 162:56–67.
- Davignon J. 1990. Probucol revisited. In: Descovich G, Gaddi A, Magri G & Lenzi S (eds.) Atherosclerosis and Cardiovascular Disease. Springer Netherlands.
- Davignon J. 1994. Probucol. Principles and Treatment of Lipoprotein Disorders. Springer.
- De Celis Alonso B, Rayment P, Ciampi E, Ablett S, Marciani L, Spiller RC, et al. 2010. NMR relaxometry and rheology of ionic and acid alginate gels. Carbohydr Polym. 82:663–669.
- Draget KI, Taylor C. 2011. Chemical, physical and biological properties of alginates and their biomedical implications. Food Hydrocolloids. 25:251–256.
- Düfer M, Hörth K, Wagner R, Schittenhelm B, Prowald S, Wagner TF, et al. 2012. Bile Acids Acutely Stimulate Insulin Secretion of Mouse β-Cells via Farnesoid X Receptor Activation and KATP Channel Inhibition. Diabetes. 61:1479–1489.
- Fakhoury M, Coussa-Charley M, Al-Salami H, Kahouli I, Prakash S. 2014a. Use of artificial cell microcapsule containing thalidomide for treating TNBS-induced Crohn's disease in mice. Curr Drug Deliv. 11:146–153.
- Fakhoury M, Negrulj R, Mooranian A, Al-Salami H. 2014b. Inflammatory bowel disease: clinical aspects and treatments. J Inflamm Res. 7:113–120.
- Festi D, Schiumerini R, Birtolo C, Marzi L, Montrone L, Scaioli E, et al. 2011. Gut microbiota and its pathophysiology in disease paradigms. Dig Dis. 29:518–524.
- Fukuda M, Ikegami H, Kawaguchi Y, Sano T, Ogihara T. 1995. Antioxidant, probucol, can inhibit the generation of hydrogen peroxide in islet cells induced by macrophages and prevent islet cell destruction in NOD mice. Biochem Biophys Res Commun. 209:953–958.
- George M, Abraham TE. 2006. Polyionic hydrocolloids for the intestinal delivery of protein drugs: alginate and chitosan–a review. J Control Release. 114:1–14.
- Gill P, Moghadam TT, Ranjbar B. 2010. Differential scanning calorimetry techniques: applications in biology and nanoscience. J Biomol Tech. 21:167–193.
- Goh CH, Heng PWS, Chan LW. 2012. Alginates as a useful natural polymer for microencapsulation and therapeutic applications. Carbohydr Polym. 88:1–12.
- Gorogawa S, Kajimoto Y, Umayahara Y, Kaneto H, Watada H, Kuroda A, et al. 2002. Probucol preserves pancreatic beta-cell function through reduction of oxidative stress in type 2 diabetes. Diabetes Res Clin Pract. 57:1–10.
- Hamaguchi K, Gaskins HR, Leiter EH. 1991. NIT-1, a pancreatic beta-cell line established from a transgenic NOD/Lt mouse. Diabetes. 40:842–849.
- Heeg JF, Hiser MF, Satonin DK, Rose JQ. 1984. Pharmacokinetics of probucol in male rats. J Pharm Sci. 73:1758–1763.
- Heel RC, Brogden RN, Speight TM, Avery GS. 1978. Probucol: a review of its pharmacological properties and therapeutic use in patients with hypercholesterolaemia. Drugs. 15:409–428.
- Kandrac J, Kevresan S, Gu JK, Mikov M, Fawcett JP, Kuhajda K. 2006. Isolation and determination of bile acids. Eur J Drug Metab Pharmacokinet. 31:157–177.
- Karunakaran U, Park KG. 2013. A systematic review of oxidative stress and safety of antioxidants in diabetes: focus on islets and their defense. Diabetes Metab J. 37:106–112.
- Kulkarni AR, Soppimath KS, Aminabhavi TM, Rudzinski WE. 2001. In-vitro release kinetics of cefadroxil-loaded sodium alginate interpenetrating network beads. Eur J Pharm Biopharm. 51:127–133.
- Legrand J, Dumont E, Comiti J, Fayolle F. 2000. Diffusion coefficients of ferricyanide ions in polymeric solutions—comparison of different experimental methods. Electrochimica acta. 45:1791–1803.
- Lin SY, Wang SL. 2012. Advances in simultaneous DSC-FTIR microspectroscopy for rapid solid-state chemical stability studies: some dipeptide drugs as examples. Adv Drug Deliv Rev. 64:461–478.
- Liu JH, Liu DF, Wang NN, Lin HL, Mei X. 2011. Possible role for the thioredoxin system in the protective effects of probucol in the pancreatic islets of diabetic rats. Clin Exp Pharmacol Physiol. 38:528–533.
- Maritim AC, Sanders RA, Watkins JB, 3rd. 2003. Diabetes, oxidative stress, and antioxidants: a review. J Biochem Mol Toxicol. 17:24–38.
- Mooranian A, Negrulj R, Al-Sallami HS, Fang Z, Mikov M, Golocorbin-Kon S, et al. 2014a. Release and swelling studies of an innovative antidiabetic-bile acid microencapsulated formulation, as a novel targeted therapy for diabetes treatment. J Microencapsul. 1–6.
- Mooranian A, Negrulj R, Arfuso F, Al-Salami H. 2014b. Characterization of a novel bile acid-based delivery platform for microencapsulated pancreatic β-cells. Artificial Cells Nanomed Biotechnol. 1–7.
- Mooranian A, Negrulj R, Chen-Tan N, Al-Sallami HS, Fang Z, Mukkur T, et al. 2014c. Novel artificial cell microencapsulation of a complex gliclazide-deoxycholic bile acid formulation: a characterization study. Drug Des Dev Ther. 8:1003.
- Mooranian A, Negrulj R, Chen-Tan N, Al-Sallami HS, Fang Z, Mukkur TK, et al. 2014d. Microencapsulation as a novel delivery method for the potential antidiabetic drug, Probucol. Drug Des Devel Ther. 8:1221–1230.
- Mooranian A, Negrulj R, Chen-Tan N, Watts GF, Arfuso F, Al-Salami H. 2014e. An optimized probucol microencapsulated formulation integrating a secondary bile acid (deoxycholic acid) as a permeation enhancer. Drug Des Devel Ther. 8:1673–1683.
- Mooranian A, Negrulj R, Mathavan S, Martinez J, Sciarretta J, Chen-Tan N, et al. 2014f. Stability and Release Kinetics of an Advanced Gliclazide-Cholic Acid Formulation: The Use of Artificial-Cell Microencapsulation in Slow Release Targeted Oral Delivery of Antidiabetics. J Pharm Innov. 9:150–157.
- Mooranian A, Negrulj R, Mathavan S, Martinez J, Sciarretta J, Chen-Tan N, et al. 2014g. An advanced microencapsulated system: a platform for optimized oral delivery of antidiabetic drug-bile acid formulations. Pharm Dev Technol. 1–8.
- Mooranian A, Negrulj R, Al-Sallami HS, Fang Z, Mikov M, Golocorbin-Kon S, et al. 2015a. Probucol Release from Novel Multicompartmental Microcapsules for the Oral Targeted Delivery in Type 2 Diabetes. AAPS PharmSciTech. 16:45–52.
- Mooranian A, Negrulj R, Mikov M, Golocorbin-Kon S, Arfuso F, Al-Salami H. 2015b. Novel chenodeoxycholic acid-sodium alginate matrix in the microencapsulation of the potential antidiabetic drug, probucol. An in vitro study. J Microencapsul (in press).
- Negrulj R, Mooranian A, Al-Salami H. 2013. Potentials and Limitations of Bile Acids in Type 2 Diabetes Mellitus: Applications of Microencapsulation as a Novel Oral Delivery System. J Endocrinol Diab Mellitus. 1:49–59.
- Negrulj R, Mooranian A, Chen-Tan N, Al-Sallami HS, Mikov M, Golocorbin-Kon S, et al. 2015. Swelling, mechanical strength, and release properties of probucol microcapsules with and without a bile acid, and their potential oral delivery in diabetes. Artif Cells Nanomed Biotechnol. 1–8.
- Pamies R, Schmidt RR, Martínez MDCL, Torre JGDL. 2010. The influence of mono and divalent cations on dilute and non-dilute aqueous solutions of sodium alginates. Carbohydrate Polymers. 80:248–253.
- Perez MJ, Briz O. 2009. Bile-acid-induced cell injury and protection. World J Gastroenterol. 15:1677–1689.
- Prajapati S, Tripathi P, Ubaidulla U, Anand V. 2008. Design and development of gliclazide mucoadhesive microcapsules: in vitro and in vivo evaluation. AAPS PharmSciTech. 9:224–230.
- Prawitt J, Caron S, Staels B. 2011. Bile acid metabolism and the pathogenesis of type 2 diabetes. Curr Diab Rep. 11:160–166.
- Renga B, Mencarelli A, Vavassori P, Brancaleone V, Fiorucci S. 2010. The bile acid sensor FXR regulates insulin transcription and secretion. Biochim Biophys Acta Mol Basis Dis. 1802:363–372.
- Rodes L, Paul A, Coussa-Charley M, Al-Salami H, Tomaro-Duchesneau C, Fakhoury M, Prakash S. 2011. Transit time affects the community stability of lactobacillus and bifidobacterium species in an in vitro model of human colonic microbiotia. Artif Cells Blood Substit Immobil Biotechnol. 39:351–356.
- Sarmento B, Ferreira D, Veiga F, Ribeiro A. 2006. Characterization of insulin-loaded alginate nanoparticles produced by ionotropic pre-gelation through DSC and FTIR studies. Carbohydr Polym. 66:1–7.
- Sherman I, Fisher M. 1986. Hepatic transport of fluorescent molecules: in vivo studies using intravital TV microscopy. Hepatology. 6:444–449.
- Soares J, Santos J, Chierice G, Cavalheiro E. 2004. Thermal behavior of alginic acid and its sodium salt. Eclética Química. 29:57–64.
- Stojancevic M, Bojic G, Salami HA, Mikov M. 2013. The Influence of Intestinal Tract and Probiotics on the Fate of Orally Administered Drugs. Curr Issues Mol Biol. 16:55–68.
- Takka S, Cali AG. 2012. Bile salt-reinforced alginate-chitosan beads. Pharm Dev Technol. 17:23–29.
- Tanous D, Hime N, Stocker R. 2008. Anti-atherosclerotic and anti- diabetic properties of probucol and related compounds. Redox Rep. 13:48–59.
- Thomas C, Gioiello A, Noriega L, Strehle A, Oury J, Rizzo G, et al. 2009. TGR5-Mediated Bile Acid Sensing Controls Glucose Homeostasis. Cell Metabolism. 10:167–177.
- Thybo P, Pedersen BL, Hovgaard L, Holm R, Müllertz A. 2008. Characterization and Physical Stability of Spray Dried Solid Dispersions of Probucol and PVP-K30*. Pharm Dev Technol. 13:375–386.
- Torpy JM, Lynm C, Glass RM. 2009. DIabetes. JAMA. 301:1620–1620.
- Xie HG, Li XX, Lv GJ, Xie WY, Zhu J, Luxbacher T, et al. 2010. Effect of surface wettability and charge on protein adsorption onto implantable alginate‐chitosan‐alginate microcapsule surfaces. J Biomed Mat Res Part A. 92:1357–1365.
- Yamashita S, Matsuzawa Y. 2009. Where are we with probucol: a new life for an old drug? Atherosclerosis. 207:16–23.
- Yang L, Xu Y, Su Y, Wu J, Zhao K, Chen J, Wang M. 2005. FT-IR spectroscopic study on the variations of molecular structures of some carboxyl acids induced by free electron laser. Spectrochim Acta Part A, Mol Biomol Spectrosc. 62:1209–1215.
- Yang Y, Campanella OH, Hamaker BR, Zhang G, Gu Z. 2013. Rheological investigation of alginate chain interactions induced by concentrating calcium cations. Food Hydrocoll. 30:26–32.