
Abstract
Taking the emergence of continuous resistance to chemotherapy and the evidence that miRNAs are associated with chemoresistance in cancers into consideration, it is of significant importance to reveal the miRNAs functions for the treatment of cancer. As a novel tumor suppressor, MiR-634 is known to induce apoptosis in tumor cell which is essential for tumorigenesis. Herein, we elucidated the regulation effects of miR-634 in gene expression and discovery of its target gene in cell proliferation and invasion that would aid therapeutic apoptosis. As a result, by targeting mTOR signal pathway, miR-634 inhibited cell proliferation, migration and invasiveness in cervical cancer cells and the block of miR-634 enhances the mTOR expression at both the mRNA and protein levels which regulated the expression of mTOR negatively. Taken together, these results further indicated that miR-634 is an effective target for cancer treatment, and the findings provided in this work might lead to the better understanding of the malignant behavior of cervical carcinoma.
Introduction
MicroRNAs (miRNAs) are a conserved group of endogenous, small noncoding RNA molecules that have the capacity to regulate gene expression at the post-transcriptional level, resulting in mRNA cleavage or translational repression (Jemal et al. Citation2011, Ferlay et al. Citation2010). Thus far, miRNAs regulate the expression of approximately 60% of protein-coding genes, which are involved in diverse biological processes, such as cell growth, differentiation, development and apoptosis (Wang et al. Citation2008, Li et al. Citation2011), as well as processes during drug resistance (Colombo et al. Citation2012, Hwang and Mendell Citation2007). Depending on the role of their targets in cancer, miRNAs function as either oncogenes or as tumor suppressors (Colombo et al. Citation2012). Cervical cancer has also recently been shown to be associated with an abnormal miRNA expression profile, suggesting that miRNAs might contribute to cancer development (Hwang and Mendell Citation2007). Cervical carcinoma significantly affects the health of women worldwide and currently ranks as the second leading cause of cancer mortality in women, following breast cancer. Approximately 500,000 cases of cervical cancer are diagnosed per year, with nearly 45% of those resulting in death (Hwang and Mendell Citation2007, Tamura et al. Citation2013). Cervical cancer is a complex disease involving the abnormal expression of many oncogenes and tumor suppressor genes. Although focusing on known genes has yielded significant new information, previously unknown noncoding RNAs, such as miRNAs, may also provide insights into the biology of cervical cancer (Marcucci et al. Citation2013).
A number of miRNAs have been identified to regulate tumor metastasis. Among them, miR-634 is capable of inducing epithelial-to-mesenchymal transition of mammary epithelial cells, thereby fostering invasive and metastatic behaviors of cancers (Pedersen et al. Citation2009). mTOR is the target of a molecule named rapamycin or sirolimus, which is a macrolide produced by Streptomyces hygroscopius bacteria and that first gained attention because of its broad antiproliferative properties. Several observations support the importance of mTOR pathway in cancer pathogenesis. This pathway regulates many major cellular processes and is implicated in an increasing number of pathological conditions, including cancer, obesity, type2 diabetes and neurodegeneration (Gironella et al. Citation2007). Due to its antiapoptotic properties, mTOR is a potential proto-oncogene. In addition, enhanced expression of mTOR is observed in a wide range of tumors, including hepatocellular carcinoma, breast cancer, etc. (Huang et al. Citation2013, Higgs and Slack Citation2013, Martin and St Johnston Citation2003). Growing evidence suggests that mTOR expression levels are associated with worse clinical outcomes in various cancer types. Although the miR-634 is considered to play a key role in determining tumor properties, the regulation of mTOR expression in cervical cancers remains largely unknown. This prompted us to further analyze the relevance of mTOR for cervical cancer.
In this study, we investigated the role played by miR-634, an miRNA associated with cervical cancer and its interaction with the suppressor mTOR.
Experimental methods
Ethical statement and subjects
Written informed consents were obtained from all subjects. The experimental protocol was reviewed and approved by the Ethical Committee of Qilu Hospital, Shandong Univeristy (SDU-EC-10258) and was conducted according to the principles expressed in the Declaration of Helsinki.
Plasmid construction
Pri-miR-634 was amplified using the primers and then cloned into the restriction sites of pcDNA3. The resulting construct pcDNA3/pri-miR-634 was confirmed by DNA sequencing. ASO-miR-634 was synthesized and used as miR-634 antisense oligonucleotides. The 3′-UTR fragment of the MTOR gene containing the predicted miR-634 binding site was amplified by PCR using the primers. PCR products were cloned into the pcDNA3/EGFP plasmid. The resulting vector was named pcDNA3/EGFP-MTOR 3′-UTR. Moreover, mutant fragment of MTOR 3′-UTR containing a mutated miR-634 binding site was amplified using PCR site-directed mutagenesis and cloned into the pcDNA3/EGFP plasmid between the same sites. All insertions were confirmed by sequencing. To construct the siR-MTOR vector, a 70-bp double-stranded fragment was obtained via an annealing reaction using two single strands. The pcDNA3 vector was used to generate an MTOR overexpression plasmid. The full-length human MTOR cDNA sequence was amplified using PCR from a cDNA clone vector and then cloned into the restriction sites using primers.
Cell culture
HeLa and SiHa cell lines were obtained from Cancer Research Center of Shandong Univeristy (Qingdao, China). Hela cells were maintained in RPMI1640 (GIBCO) and SiHa cells were maintained in DMEM medium; these cells were supplemented with 10% fetal bovine serum (FBS; HyClone, Logan, UT), 100 IU/ml of penicillin and 100 μg/ml of streptomycin in a humidified atmosphere of 95% air and 5% CO2 at 37 °C.
Human tissue samples
Twenty-six pairs of clinical specimens, including 26 human cervical cancer tissue sections from patients with cervical cancer and corresponding adjacent normal tissues, were obtained from the First Affiliated Hospital, Harbin Medical University. Histologically, all the biopsies were squamous cell carcinoma and the stages of cancer were from III. The diagnoses of these samples were verified by pathologists.
Real-time RT-PCR analysis
Quantitative RT-PCR was performed to detect the relative transcript levels of miR-634. Briefly, 3 μg of small RNA extracted and isolated from cells or tissue samples was reverse-transcribed to cDNA with the stem–loop reverse transcriptase primer using the M-MLV reverse transcriptase (Promega, Madison, WI). cDNA was subsequently used for the amplification of miR-634 and an endogenous control, U6 snRNA, via PCR. The MTOR reverse transcription (RT) primer and qPCR primers were synthesized by Sangon Biotech., Inc. (Shanghai, China). PCR cycles were as follows: 94 °C for 3 min followed by 40 cycles of 90 °C for 30 s, 55 °C for 30 s, and 74 °C for 30 s. To quantify MTOR expression, 4 μg of RNA extracted from cells or tissue samples was reverse-transcribed to cDNA using the M-MLV reverse transcriptase. PCR cycles were as follows: 94 °C for 3 min followed by 40 cycles of 96 °C for 30 s, 56 °C for 30 s, and 70 °C for 30 s. SYBR green RCR was performed in triplicate using Bio-Rad Chromo 4 System Real-Time RCR detector (Bio-Rad, Hercules, CA, USA). The relative gene expression levels were calculated. All the primers were purchased from ABI.
Western blotting
Western blotting was performed to determine mTOR protein expression. All proteins were resolved on 10% SDS-denatured polyacrylamide gel and were then transferred onto a PVDF membrane. Membranes were incubated with blocking buffer for 80 min at room temperature and then incubated with an antibody against MTOR or glyceraldehyde-3-phosphate dehydrogenase (GAPDH) with overnight at 5 °C. The membranes were washed and incubated with a horseradish peroxidase (HRP)-conjugated secondary antibody (AuGCT, Inc. (Beijing, China)). Protein expression was assessed by enhanced chemiluminescence and exposure to chemiluminescent film. Lab Works Image Acquisition and Analysis Software (UVP) were used to quantitate band intensities.
Fluorescent reporter assay
HeLa and SiHa cells were co-transfected with pri-miR-634 or ASO-miR-634 in a 48-well plate followed by the pcDNA3/EGFP-MTOR 3′-UTR reporter vector or pcDNA3/EGFP-MTOR 3′-UTR mutant. A separate RFP expression vector, pDsRed2-N1 (Clontech, Mountain View, CA), was used for normalization. The cells were lysed 72 h later, and the proteins were harvested. The following vectors were co-transfected into cells: those containing the EGFP reporter vector alone, with pcDNA3/primiR-634, or bearing ASO-miR-634. PcDNA3/EGFP, pcDNA3 or ASO-NC were used as control vectors. The intensities of EGFP and RFP fluorescence were detected with the F-4500 Fluorescence Spectrophotometer (Hitachi, Tokyo, Japan).
Transfection assay
HeLa cells (1 × 10⁵ cells per well) were seeded into 6-well culture plates and grown overnight. Then cells were transfected with miR-634 expression vector (pri-miR-634, 4 μg each well) or miR-634 antisense oligonucleotides (ASO-miR-634). For SiHa cells, 1 × 10⁶ cells per well were seeded into 6-well culture plates. 5 μg pri-miR-634 or 500 μmol ASO-miR-634 was transfected. The plasmid pcDNA3 and the nonrelative sequence (ASO-NC) were used for negative control. Transfection was performed with Lipofectamine 2000 Reagent (Invitrogen, Carlsbad, CA) according to the manufacturer's protocol. The medium was replaced with new culture medium 5 h after transfection. After 24 h post-transfection, cells were used for cell viability, cell colony formation and in vitro migration and invasion assays.
Assessment of cell viability and proliferative capacity
The viability of SiHa and Hela cells was measured using the Cell Counting Kit-8 assay (CCK-8, Dojindo, Shanghai, China). The cells were plated in 96-well plates (1 × 10⁵ cells/well) directly or 48 h after transfection. After overnight incubation, freshly prepared chemotherapeutic drugs, such as cisplatin or gemcitabine (Sigma, USA), were added at different final concentrations. The cells were exposed to the drug for 48 h and were then incubated in normal medium containing WST-8 substrate at 37 °C for 2 h. Next, cell viability was assessed indirectly by using a spectrophotometer to measure absorbance at 450 nm. To determine cell proliferative capacity, cells were examined using the colony formation assays as described previously (Ostling et al. Citation2011). Cells were seeded in 96-well plates at either 1 × 10⁵ cells/well (HeLa cells) or 1.5 × 10⁵ cells/well (SiHa cells) for the colony formation assay, and the number of viable cell colonies was determined after 10 days (HeLa cells, SiHa cells) after inoculation of 200 cells/well in triplicate in 12-well plates. The cells were stained with crystal violet. Colony formation was quantified using the colony formation number.
Cell migration and invasion assays
For the Transwell migration assay, 1 × 10⁵ HeLa cells or 1.3 × 10⁵ SiHa cells in 200 μl of RPMI 1640 without FBS were seeded into the upper part of each Transwell chamber (pore size of 8 μm; Corning) containing a noncoated membrane. For the invasion assay, 1 × 10⁵ HeLa cells or 1.3 × 10⁵ SiHa cells were placed on the upper chamber of each insert coated with 50 μl of 2 mg/ml Matrigel growth factor, and 500 μl of RPMI 1640 with 20% FBS was added to the lower part of the chamber. After incubating for several hours, the chambers were disassembled, and the membranes were stained with a 2% crystal violet solution for 15 min and placed on a glass slide. Then, cells that had migrated across the membrane were counted in five random visual fields using a light microscope. All assays were performed three independent times in triplicate.
CCK-8 assay and cell cycle assay
Stable cell lines established with the miR-634 expression plasmid or vector only were seeded in 96-well plates and maintained in 10% FBS α-MEM for 24 h until they were adherent. Cell growth was monitored over the course of 6 consecutive days. The proliferation rate was assessed using the Cell Counting Kit-8 as recommended by the manufacturer. In brief, the CCK-8 solution (5 μL) was added to each well and incubated for 2 h before absorbance values at 450 and 650 nm were recorded by an ELISA reader, and the difference between these values was recorded as the optical density. Cells were plated and transfected with pcDNA3-miR-634 or pcDNA3-NC on day 0, then reseeded on day 1 and harvested on day 2. Samples were fixed, stained and measured with flow cytometry according to reported protocols.
Flow cytometry analysis
Apoptosis was assessed by measuring the membrane redistribution of phosphatidylserine with an annexin V-propidium iodide apoptosis detection kit (Sigma, USA). In addition, the propidium iodide-stained LoVo cells were analyzed on an EPICS ELITE ESP flow cytometer (Beckman Coulter, USA).
Result
miR-634 directly targets MTOR
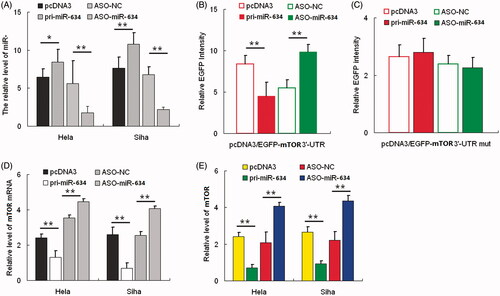
We first used the integrated computational algorithms of gNET method with TargetScan to identify gene–miRNA pairs significantly regulated in cervical cancer. We used this algorithm programs to predict miR-634 binding directly to 3′-UTR of MTOR. Next, the effect of miR-634 on MTOR expression was validated by miR-634 gain and loss of functions. In both HeLa and SiHa cells, qRT-PCR was performed to validate the miR-634 overexpression construct or miR-634 ASO, with pcDNA3 or ASO-NC to be the respective controls (). HeLa cells were co-transfected with the pcDNA3/EGFP-MTOR 3′-UTR report vector and pri-miR-634 or ASO-miR-634. As shown in , the intensity of EGFP fluorescence in the pri-miR-634 group was significantly reduced, whereas that in the ASO-miR-634 group, it increased significantly at 48 h after transfection. To determine the function of the miR-634 binding site, we constructed an additional EGFP reporter vector containing the MTOR 3′-UTR with a mutant miR-634 binding site. As a result, neither overexpression nor blocking of miR-634 had any effect on the intensity of EGFP fluorescence in cells transfected with the 3′-UTR mutant vector (). Together, these results demonstrated that miR-634 binds directly to the 3′-UTR of MTOR to repress gene expression. Additionally, we determined whether miR-634 also suppresses endogenous MTOR expression at the post-transcriptional level, and analyzed the effect of miR-634 on endogenous MTOR mRNA and protein levels using qRT-PCR analysis and Western blotting, respectively. In HeLa cells, overexpression of miR-634 resulted in approximately 70% decrease in MTOR mRNA levels () and about 50% decrease in protein expression (). Furthermore, MTOR mRNA and protein levels increased approximately three- and twofold, respectively, in HeLa cells transfected with ASO-miR-634. We observed similar results in the SiHa cell line (). These data indicated that miR-634 negatively regulates endogenous MTOR protein expression through mRNA degradation and translational repression.
Figure 1. MTOR is a direct target of miR-634. (1A) the expression level of miR-634 in HeLa and SiHa cells was significantly altered following transfection with either pri-miR-634 or ASO-miR-634 expression constructs as determined by qRT-PCR using U6 snRNA for normalization. (1B) the intensity of EGFP fluorescence in HeLa cells transfected with pri-miR-634 was decreased after 48 h and increased following transfection with ASO-miR-634. (1C) pri-miR-634 and ASO-miR-634 had no effect on the intensity of EGFP fluorescence in cells transfected with the 3′-UTR mutant vector. (1D) mRNA expression in HeLa and SiHa cells resulted from MiR-634 and miR-634 ASO with pcDNA3 or ASO-NC to be the respective controls. (1E) mTOR expression in HeLa and SiHa cells resulted from MiR-634 and miR-634 ASO with pcDNA3 or ASO-NC to be the respective controls. (*, p < 0.05, **, p < 0.005).
MiR-634 inhibits migration and invasion
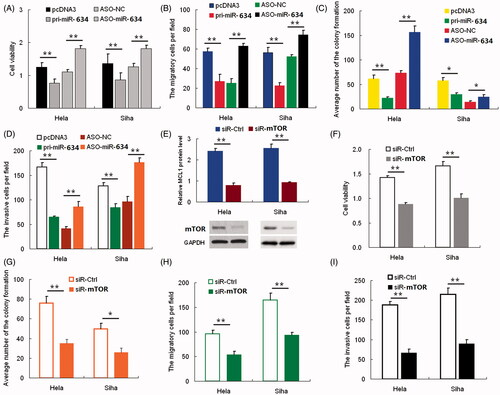
We performed cck8, colony formation, cell migration, and invasiveness assays using HeLa and SiHa cells transfected with either pri-miR-634 or ASO-miR-634 plasmids to determine the effects of miR-634 expression in vitro. CCK-8 and colony formation assays demonstrated a statistically significant reduction in the cell viability and proliferation of the pri-miR-634-transfected cells relative to the control group, whereas ASO-miR-634 obviously increased these properties in HeLa cells (). Transwell assay without Matrigel () demonstrated that miR-634 overexpression reduced migration in HeLa cells by 60%, and transfection of ASO-miR-634 increased migration by approximately twofold compared with the control cells. Furthermore, overexpression of miR-634 resulted in a significant reduction in the invasive potential of HeLa cells when compared with control cells in Transwell assay with Matrigel, and cells transfected with ASO-miR-634 had a significant increase in their invasive potential (). Similar results were obtained with the SiHa cell line (). These data suggest that miR-634 inhibits cell proliferation, migration and invasiveness in HeLa and SiHa cells in vitro.
Figure 2. miR-634 represses cell proliferation and migration and invasiveness. Cervical cancer cells were transfected with either pri-miR-634 or ASO-miR-634. Cell viability was determined at 24, 48, and 72 h after seeding in 96-well plates using the CCK8 assay. (2A)the histogram shows the data at the time point of 48 h. All three data points showed a significant difference. (2B)cervical cancer cells were transfected with pri-miR-634 or ASO-miR-634 and then seeded in 12-well plates. For the colony formation assay, the cells were stained with 2% crystal violet solution, and a representative image is shown. (2C) and (2D) migration and invasion assays were performed with HeLa and SiHa cells transfected with either pri-miR-634 or ASO-miR-634. Representative images and randomly selected fields are shown. Knockdown of MTOR suppresses proliferation, migration, and invasiveness of cervical cancer cells. (2E), MTOR protein level was measured by Western blotting 48 h after transfection of siR-MTOR into HeLa and SiHa cells. GAPDH was used as loading/transfer control (Ctrl) and for normalization of values. (2F) Viability and proliferation of Hela and SiHa cells resulted from siR-mTOR with SiR as controls. (2G) Colony formation in HeLa and SiHa cells resulted from siR-mTOR with SiR as controls. (2H) Migration of Hela and SiHa cells resulted from siR-mTOR with SiR as controls. (2I) Invasive potential in HeLa and SiHa cells resulted from siR-mTOR with SiR as controls.(*, p < 0.05; **, p < 0.005).
Knockdown of MTOR inhibits proliferation, migration and invasion
The function of MTOR in HeLa and SiHa cells was examined using RNA interference. HeLa and SiHa cells were transfected with siRNA targeting MTOR. Western blotting was used to evaluate the effect of siRNA on MTOR protein inhibition. As shown in , siR-MTOR caused a statistically significant reduction of MTOR protein levels, up to approximately 60% in HeLa cells and 50% in SiHa cells. Inhibition of MTOR expression decreased viability () and colony formation () of cervical cancer cells when compared with control cells. Furthermore, knockdown of MTOR expression resulted in a significant decrease in the rate of cell migration () and invasion (). These findings demonstrated the effect of MTOR knockdown on cell proliferation, migration and invasion, which are consistent with the effect of miR-634 overexpression in both HeLa and SiHa cells.
Restoration of MTOR counteracts effects of miR-634 expression
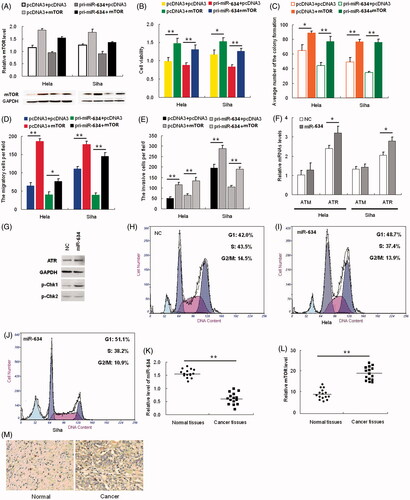
To confirm that the effects of miR-634 on the proliferation, migration and invasiveness of HeLa and SiHa cells are mediated through MTOR, we constructed a pcDNA3/MTOR vector containing the MTOR ORF without the 3′-UTR to avoid the influence of miRNAs. Transfection of HeLa and SiHa cells with this MTOR ORF expression construct reversed the negative effects of miR-634 on MTOR protein levels (). The inhibition of cell proliferation (), colony formation ( and Figure S3A in File S1), migration ( and Figure S3B in File S1) and invasiveness ( and Figure S3C in File S1) caused by pri-miR-634 was abrogated in cells co-transfected with the pcDNA3/MTOR vector. As shown in , over-expression of MTOR countered the effect of miR-634 on cell proliferation, migration and invasiveness of HeLa and SiHa cells, which suggested reverse causality between them
Figure 3. mTOR rescues miR-634-induced cellular phenotypes in cervical cancer cells. Hela and SiHa cells were either transfected with pcDNA3+pcDNA3, pcDNA3+mTOR, pri-miR-634+pcDNA3 or pri-miR-634+mTOR plasmids; (3A) Western blot was used to assess mTOR protein expression. The upper panel shows grayscale ratios mTOR and GAPDH. GAPDH was used as the loading control. (3B) Viability and proliferation of Hela and SiHa cells treated as indicated were measured by CCK-8 assay. (3C) Colony formation assay was used to analyze the colony formation capacity of Hela and SiHa cells treated as indicated. Quantification of the colony number in each treatment group is shown as histograms. (3D) Transwell chambers were used to assess the migratory capacity of Hela and SiHa cells treated as indicated. The number of migrating cells, averaged over five randomly selected fields of view, was quantified. (3E) Matrigel invasion chambers were used to assess the invasiveness of Hela and SiHa cells treated as indicated. The number of invading cells was counted and averaged over five randomly selected fields of view. (3F) Real-time PCR was used to determine relative ATM and ATR mRNA levels in Hela and SiHa cells transfected with or without miR-634 plasmid. (3G) Levels of ATR and p-Chk1 and p-Chk2 were analyzed by western blot. GAPDH was used as the loading control. (3H-J) The cell cycle distribution of Hela cells in each treatment group was analyzed by flow cytometry. (3K-L) The relative miR-634 and mTOR mRNA levels in 15 pairs of cervical cancer tissues and respective adjacent non-cancerous tissues were analyzed by Real-time PCR. Each circle or square represents a single sample, and the line represents the mean value of each category. (M) Representative images showing mTOR immunostaining levels in cervical cancer and non-cancerous tissues. Nuclei are counterstained with hematoxylin.
Expression of miR-634 and MTOR in cervical cancer and normal tissues
To detect the expression of miR-634 in human cervical cancer tissues, the qRT-PCR assay was performed on fifteen paired samples of cervical cancer and adjacent normal tissues. miR-634 was expressed at a lower level (), whereas MTOR was expressed at a significantly higher level in the tumor tissues when compared with the corresponding normal tissues (). In this setting, we utilized an immunohistochemistry assay to further detect the MTOR expression level in human cervical cancer tissues and adjacent normal tissues. As shown in , the expression levels of MTOR were significantly higher than those in adjacent normal tissues, further supporting that miR-634 negatively regulates MTOR. This discovery provides insight into how MTOR expression is regulated, and suggests therapeutic targets for rescuing the function of the MTOR protein most commonly associated with human cervical cancer.
Discussion
It is known that miRNAs regulate diverse biological processes, including tumorigenesis. The tumor suppressor miR-634 family is reported to be frequently downregulated in human cancers. Two recent studies have identified miR-634 as the key suppressor component of miR-634 family, demonstrating that miR-634 inhibited mTOR expression and induced apoptosis in esophageal squamous cell carcinoma (Yamamoto et al. Citation2014), and directly targets fibroblast growth factor receptor 3 and inhibits the growth of non-small-cell lung cancer (Ji et al. Citation2007). Recent research indicates that induction of the miR-634 inhibited tumor growth and enhanced paclitaxel sensitivity (Leivonen et al. Citation2014). Here, we focused on the expression of miR-634 in cervical cancer cells and the mechanisms of regulation of its target genes. First, we performed qRT-PCR to examine miR-634 expression in human cervical carcinomas and matched normal tissues, and discovered that the levels of miR-634 were downregulated in tumor tissues, compared with the matched normal tissues, in 26 of matched specimens. We hypothesized that these miRNAs might function as tumor suppressors. The cck8 assay showed that HeLa cells transfected with the miR-634 overexpression vector (pri-miR-634) exhibited decreased growth compared with the control cells. Therefore, we inferred that miR-634 might be a growth-inhibiting factor in cervical carcinomas.
MicroRNAs are recognized as important regulators of gene expression, suppressing the expression of target genes through translational repression or degradation of a target transcript. We integrated bioinformatics-based predictions and the resulting candidate functions and found that the mTOR gene had the highest recurrence rate as a potential target gene of miR-634. miRNAs are believed to bind partially to the homologous sequence of a target gene in the 3′-UTR. Accordingly, we constructed a luciferase reporter plasmid bearing the wild-type 3′-UTR of mTOR mRNA downstream of the stop codon of Luciferase gene for in vitro analysis and found that inhibition or overexpression of miR-634 could significantly enhance or reduce luciferase activity, respectively. Furthermore, we constructed another luciferase reporter vector containing a mutated miR-634 “seed region” binding site, and no significant difference was detected when miR-634 were either overexpressed or inhibited. All these results suggest that miR-634 can directly and negatively regulate mTOR gene expression by binding to the 3′-UTR of mTOR mRNA.
It was suggested that highly expressed miRNAs could suppress target gene expression, whereas inhibition of an endogenous miRNA could protect mRNA targets from increased degradation. Accordingly, we performed real-time PCR and Western blot assays to confirm the hypothesis that mTOR is regulated by miR-634. The results showed that when miR-634 was blocked, mTOR expression was enhanced at both the mRNA and protein levels, and when miR-634 was overexpressed, mTOR mRNA and protein expression levels were reduced. Collectively, we concluded that miR-634 negatively regulated the expression of mTOR.
In our work, we observed that miR-634 are not only related to cell proliferation but also associated with the invasion of cervical cancer cells through regulation of mTOR expression. Consistent with our results, it has been demonstrated that miR-634 inhibited the cell migration and invasion in renal cell carcinoma (Gironella et al. Citation2007). However, Turcatel et al. (Ostling et al. Citation2011) found that miR-634 and -634 inhibition decreased TGF-beta activity by inhibiting SMAD3 phosphorylation, resulting in decreased migration in normal murine mammary gland cell NMUNG. We speculated that these differences were resulted from different cell types, suggesting that the regulatory system of cellular invasive ability seems complex. When miR-634 levels were high, HeLa cells have a decreased ability of growth and invasion. However, when the mTOR signal was blocked by rapamycin, the proliferation and invasion potential was decreased, and meanwhile, rapamycin can rescue these effects induced by miR-634 ASO. Taken together, our findings suggest that miR-634 plays critical roles in the malignant properties of human cervical carcinoma by targeting mTOR. Similarly, Wu and his co-workers demonstrated that miR-1634-3p, which belongs to the miR-634 family, regulated endometrial cancer cell proliferation by targeting mTOR (Du et al. Citation2012).
mTOR is the target of a molecule named rapamycin or sirolimus, which is a macrolide produced by Streptomyces hygroscopius bacteria and that first gained attention because of its broad antiproliferative properties. Several observations support the importance of mTOR pathway in cancer pathogenesis. This pathway regulates many major cellular processes and is implicated in an increasing number of pathological conditions, including cancer, obesity, type 2 diabetes and neurodegeneration (Fujita et al. Citation2010). The loss of p53, a very common event in cancer, promotes mTORC1 activation (Li et al. Citation2009). Activation of mTOR signaling pathway contributes to survival of cervical cancer cells (Esquela-Kerscher and Slack Citation2006). However, the mTOR inhibitor AZD8055 inhibits proliferation and glycolysis in cervical cancer cells (Leong et al. Citation2005). Thioridazine induces apoptosis by targeting the PI3K/Akt/mTOR pathway in cervical and endometrial cancer cells (Siegel et al. Citation2013). Furthermore, mTOR plays important roles in tumor cell motility, invasion and metastasis.
Collectively, this study provides evidence that miR-634 are downregulated in cervical cancer tissues, and that these miRNAs function as tumor suppressors to inhibit cell proliferation and invasion. Moreover, their novel target gene, mTOR, was identified and was found to be upexpressed in cervical cancer tissues; blockade of mTOR signaling pathway was able to suppress proliferation and invasion in cervical cancer cells. Investigation of miR-634 and their target oncogenes may help to deeply understand the malignant behavior of cervical carcinoma.
Declaration of interest
This is to certify that the work in the paper entitled “MiR-634 decreases cell proliferation and induces apoptosis by targeting mTOR signaling pathway in cervical cancer cells” submitted for publication is an original one and has not been submitted for publication elsewhere. We further certify that proper citations to the previously reported work have been given and no data/tables/figures have been quoted verbatim from other publications without giving due acknowledgement and without the permission of the authors.
The authors report no declarations of interest. The authors alone are responsible for the content and writing of the paper.
Related Research Data
References
- Colombo N, Carinelli S, Colombo A, Marini C, Rollo D, Sessa C. 2012. Cervical cancer: esmo clinical practice guidelines for diagnosis, treatment and follow-up. Ann Oncol. 23:i27–i32.
- Du L, Subauste MC, DeSevo C, Zhao Z, Baker M, Borkowski R, et al. 2012. miR-337-3p and its targets STAT3 and RAP1A modulate taxane sensitivity in non-small cell lung cancers. PLoS One. 7:e39167.
- Esquela-Kerscher A, Slack FJ. 2006. Oncomirs - microRNAs with a role in cancer. Nat Rev Cancer. 6:259–269.
- Ferlay J, Shin HR, Bray F, Forman D, Mathers C, Parkin DM. 2010. Estimates of worldwide burden of cancer in 2008: GLOBOCAN 2008. Int J Cancer. 127:2893–2917.
- Fujita Y, Kojima K, Ohhashi R, Hamada N, Nozawa Y, Kitamoto A, et al. 2010. MiR-148a attenuates paclitaxel resistance of hormone-refractory, drug-resistant prostate cancer PC3 cells by regulating MSK1 expression. J Biol Chem. 285:19076–19084.
- Gironella M, Seux M, Xie MJ, Cano C, Tomasini R, Gommeaux J, et al. 2007. Tumor protein 53-induced nuclear protein 1 expression is repressed by miR-155, and its restoration inhibits pancreatic tumor development. Proc Natl Acad Sci U S A. 104:16170–16175.
- Higgs G, Slack F. 2013. The multiple roles of microRNA-155 in oncogenesis. J Clin Bioinforma. 3:17.
- Huang X, Taeb S, Jahangiri S, Emmenegger U, Tran E, Bruce J, et al. 2013. MiRNA-95 mediates radioresistance in tumors by targeting the sphingolipid phosphatase SGPP1. Cancer Res. 73:6972–6986.
- Hwang HW, Mendell JT. 2007. MicroRNAs in cell proliferation, cell death, and tumorigenesis. Br J Cancer. 96:R40–R44.
- Jemal A, Bray F, Center MM, Ferlay J, Ward E, Forman D. 2011. Global cancer statistics. CA Cancer J Clin. 61:69–90.
- Ji H, Ramsey MR, Hayes DN, Fan C, McNamara K, Kozlowski P, et al. 2007. LKB1 modulates lung cancer differentiation and metastasis. Nature. 448:807–810.
- Leivonen SK, Sahlberg KK, Makela R, Due EU, Kallioniemi O, Borresen-Dale AL, Perala M. 2014. High-throughput screens identify microRNAs essential for HER2 positive breast cancer cell growth. Mol Oncol. 8:93–104.
- Leong SS, Wee J, Tay MH, Toh CK, Tan SB, Thng CH, et al. 2005. Paclitaxel, carboplatin, and gemcitabine in metastatic nasopharyngeal carcinoma: a Phase II trial using a triplet combination. Cancer. 103:569–575.
- Li Y, VandenBoom TG 2nd, Kong D, Wang Z, Ali S, Philip PA, Sarkar FH. 2009. Up-regulation of miR-200 and let-7 by natural agents leads to the reversal of epithelial-to-mesenchymal transition in gemcitabine- resistant pancreatic cancer cells. Cancer Res. 69:6704–6712.
- Li Y, Wang F, Xu J, Ye F, Shen Y, Zhou J, et al. 2011. Progressive miRNA expression profiles in cervical carcinogenesis and identification of HPV-related target genes for miR-29. J Pathol. 224:484–495.
- Marcucci G, Maharry KS, Metzeler KH, Volinia S, Wu YZ, Mrozek K, et al. 2013. Clinical role of microRNAs in cytogenetically normal acute myeloid leukemia: miR-155 upregulation independently identifies high-risk patients. J Clin Oncol. 31:2086–2093.
- Martin SG, St Johnston D. 2003. A role for drosophila LKB1 in anterior-posterior axis formation and epithelial polarity. Nature. 421:379–384.
- Ostling P, Leivonen SK, Aakula A, Kohonen P, Makela R, Hagman Z, et al. 2011. Systematic analysis of microRNAs targeting the androgen receptor in prostate cancer cells. Cancer Res. 71:1956–1967.
- Pedersen IM, Otero D, Kao E, Miletic AV, Hother C, Ralfkiaer E, et al. 2009. Onco-mir-155 targets SHIP1 to promote TNFalpha-dependent growth of B cell lymphomas. EMBO Mol Med. 1:288–295.
- Siegel R, Naishadham D, Jemal A. 2013. Cancer statistics, 2013. CA Cancer J Clin. 63:11–30.
- Tamura M, Uyama M, Sugiyama Y, Sato M. 2013. Canonical Wnt signaling activates miR-34 expression during osteoblastic differentiation. Mol Med Rep. 8:1807–1811.
- Wang X, Tang S, Le SY, Lu R, Rader JS, Meyers C, et al. 2008. Aberrant expression of oncogenic and tumor-suppressive microRNAs in cervical cancer is required for cancer cell growth. PLoS One. 3:e2557.
- Yamamoto S, Inoue J, Kawano T, Kozaki K, Omura K, Inazawa J. 2014. The impact of miRNA-based molecular diagnostics and treatment of NRF2-stabilized tumors. Mol Cancer Res. 12:58–68.