
Abstract
In this study, the mesenchymal stem cell (MSC) responses to biomaterial surfaces and to an anti-microtubule drug (vinblastine) were detected by using the quartz crystal microbalance (QCM). Gold electrodes with different coatings were subjected to MSCs under flow conditions; thus, crystal frequency decreased due to the adhesion of MSCs on the crystal. For evaluation of cell–drug interactions, vinblastine was introduced to MSCs attached onto the surfaces. The changes in frequency indicated the binding of drug to cell microtubules. The present study demonstrates the suitability of QCM as an invaluable tool for the real-time monitoring of cell–surface and cell–drug interactions.
Introduction
The quartz crystal microbalance (QCM) is a piezoelectric sensor, which is fundamentally a device that can measure simultaneous mass changes on a quartz crystal at nanogram level. This system is fabricated from a thin plate of quartz, compressed between two metal plates that serve as electrodes (Chen et al. Citation2013). Many biosensor applications in the field of detecting biological agents exist, which are based on the QCM technique (reviewed in Şeker and Elçin Citation2014). For example, those involve the measurement of enzymes (Bouchet-Spinelli et al. Citation2013, Şeker et al. Citation2010), proteins (Crosson and Rossi Citation2013), nucleic acids (Papadakis et al. Citation2012), bacteria (Kengne-Momo et al. Citation2012) or mammalian cells (Wang et al. Citation2011). QCM technique was initially introduced to monitor the mass adsorption of chemical species in gas phase on a quartz surface. After the quartz crystal has been integrated into liquid conditions, the solution-based QCM became a medium in bioanalytical applications to measure adsorption at solution–surface interfaces (Wegener et al. Citation2001). In the past decade, the QCM system has found place in a wide range of applications as label-free chemical and biological sensors, in areas from food to environmental and clinical analysis. The QCM system has several advantages such as small size, high sensitivity, high specificity, cost effectiveness, short response time, reproducibility, low sample requirement, ease of use and readily transportable instrumentation. It is a well-established technique for monitoring mass and film thickness. In addition, it can provide information about the viscoelastic properties of adsorbed adlayers (Fohlerová et al. Citation2012).
Mesenchymal stem cells (MSCs) have been commonly used in cell-based clinical therapies and are capable of differentiating into a number of somatic cells including, osteocytes, adipocytes and chondrocytes (Caplan Citation2005, Elcin et al. Citation2003). The differentiation potential of MSCs makes them an ideal candidate for cellular therapies in regenerative medicine (Granero-Molto et al. Citation2008). The detection of cell attachment onto subtrates is very important for evaluating the cell behavior to biomaterial surfaces and substances of biological importance (Lourenço et al. Citation2012). One of the major problems in biomaterials research and development is the lack of a system that can detect real-time cell–material interactions under in vitro culture conditions (Fredriksson et al. Citation1998, Lord et al. Citation2006). In order to detect cell attachment onto biomaterial surfaces different techniques have been used (Anselme Citation2000), such as enzymatic dispersion or fixation, direct counting of labeled cells; measurement of cell area and density using optical techniques, and fluorescence density measurements used for analysis of the adhesion strength. After cell adhesion, removing the cells from the surface, dyeing or fixation is the step that needs improvement in this technique (Fredriksson et al. Citation1998). QCM system is a useful technique for detection of cell adhesion, since it enables monitoring, without the need for detaching cells from surface, or any need for using label molecules/compounds (Watarai et al. Citation2012).
In the past two decades, QCM-based mammalian cell biosensors have been developed to monitor the attachment of different cell types, such as endothelial cells (Marx et al. Citation2009), osteoblasts (Tagaya et al. Citation2011), MDCK cells (Lüthgens et al. Citation2003), CHO cells (Le Guillou-Buffello et al. Citation2011), Neuro-2A cells (Khraiche et al. Citation2005), McCoy human fibroblasts (Le Guillou-Buffello et al. Citation2005), MC3T3-E1 cells (Modin et al. Citation2006), MCF-7 cells (Guo et al. Citation2008), Vero cells (Gryte et al. Citation1993), rat epithelial (WB F344) and lung melanoma (B16F10) cells (Fohlerová et al. Citation2007), human dermal fibroblasts (Chung et al. Citation2012), malignant human mammary epithelial cells (Zhou et al. Citation2012) and mouse fibroblasts (Watarai et al. Citation2012). These studies have indicated that the QCM cell biosensor is suitable for evaluating cell attachment and dispersion on quartz surface.
The QCM cell biosensors have been used for the monitoring of cellular responses to anti-microtubule drugs that alter microtubule dynamics (Braunhut et al. Citation2005, Marx et al. Citation2001, Marx et al. Citation2007, Tymchenko et al. Citation2012, Wei et al. Citation2007). In these studies, cells are attached to the surface of the quartz crystals and are exposed to drugs at various concentrations. By measuring the resonance frequency shifts of quartz crystals, significant information about cell proliferation, cell adhesion or cytotoxicity can be detected. In addition, QCM system has been applied to study melanosome transport processes based on melanosome aggregation (by the addition of melatonin) and dispersion (by the addition of melatonin and melanocyte-stimulating hormone) in the presence of agents disrupting actin filaments (latrunculin) or microtubules (nocodazole) (Frost et al. Citation2013). Besides, QCM has been applied to cell biology studies, which assess complex dynamic cellular process, by monitoring responses of cells to growth factors (Garcia et al. Citation2013).
In this study, MSC attachment onto surfaces bearing different functional groups was monitored in real-time, under in vitro culture conditions. We have shown that the rate of adhesion of MSCs to various substrates is significantly different and this difference can be measured by using QCM cell biosensor. Also, the response of MSCs to anti-microtubule drug, vinblastine was evaluated using the QCM.
Materials and methods
Chemicals
Poly(DL-lactide-co-glycolide) (PLGA; lactide:glycolide; 85:15; Mw 50,000–75,000), poly(ɛ-caprolactone) (PCL; Mw 80,000), poly(styrene) (PS; Mw 35,000), 11-mercaptoundecanoic acid, 2-mercaptoethylamine, 2-mercaptoethanol, vinblastine, dichloromethane (DCM; 99.6%), tetrahydrofurane (THF; 99.0%) and N, N′-dimethyl formamide (DMF; >99.0%) were obtained from Sigma-Aldrich (St. Louis, MO). All chemicals were of either HPLC, cell culture or analytical-grade. Highly purified double-distilled water (20 MΩ cm at 25 °C) was used in all experiments.
QCM system and quartz crystals
AT-cut quartz crystals (7.995 MHz fundamental frequency) deposited with polished gold electrodes on both sides with diameter of 5.1 mm was purchased from CH Instruments, Inc. (Austin, TX). Frequency shifts in the quartz crystals were measured with a CHI-400 electrochemical quartz crystal microbalance system (CH Instruments, Inc.).
Crystal coatings
Before the coating procedure, quartz crystals were cleaned with a piranha solution (30% v/v H2O2 and 70% v/v H2SO4) and rinsed thoroughly with distilled water and then, dried at room temperature.
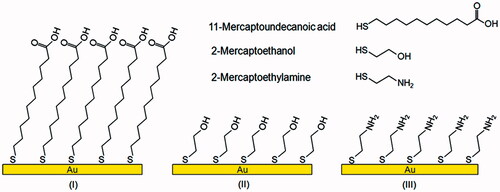
Self-assembled monolayer (SAM) method: The quartz crystals were immersed overnight in a 1 mM thiol solution (either 11-mercaptoundecanoic acid, 2-mercaptoethylamine or 2-mercaptoethanol, prepared in ethanol) at room temperature, to form a monolayer that presents many active tails (such as –COOH, –NH2 or –OH) suitable for cell attachment (), after rinsing with ethanol and bi-distilled water dried at room temperature.
Figure 1. The structures of three thiols used in this study and schematic representation of the SAM surfaces of gold, modified with 11-mercaptoundecanoic acid (I), 2-mercaptoethanol (II) and 2-mercaptoethylamine (III).
Electrospinning method: The quartz crystals were coated with PLGA nanofibrous membrane by using the electrospinning technique as described elsewhere (Inanc et al. Citation2009). Briefly, the nanofibers were formed as follows: With a syringe pump, the 20% PLGA solution (in a solvent system composed of DCM, THF, DMF; 3:1:1) was pushed along the glass pipe to the needle where positive charge was applied. Quartz crystals were placed on the collecting plate and were coated with the PLGA nanofibers, after rinsing with distilled water, dried at room temperature.
Spin coating method: One percent PLGA, 1% PS and 1% PCL were prepared in DCM, toluene and chloroform, respectively. The spin coating of PLGA, PS and PCL thin films on quartz crystals was carried out by using a Primus SB15 model spin coater (ATM Group, Salem, Germany) at 3000 rpm for 2 min. The coated quartz crystals were washed with distilled water and dried at room temperature.
Atomic force microscopy
Atomic force microscopy (AFM) was used to investigate the morphology and roughness of uncoated and coated quartz crystal surfaces. AFM investigations were performed on a NI-AFM model atomic force microscope (Nanomagnetics Instruments, Ankara, Turkey), operating in dynamic mode in air (Koc et al. Citation2007). A Tap300A1 model cantilever (Budget Sensors, Innovative Solutions, Sofia, Bulgaria) with a resonance frequency of 320 kHz was used. The surfaces were scanned with 40 N/m force constant and imaged at random scan areas.
Cell isolation and culture
MSCs were isolated from the bone marrow of male Wistar rats (300 ± 25 g) using standard technique (Koc et al. Citation2008). Protocols with animals were performed in accordance with the standards of international regulations. Briefly, the rats were anesthetized by an injection of avertin. Later, by the help of an injector the bone marrow was aspirated from femurs into Dulbecco’s modified Eagle’s medium (DMEM). The cell suspension was centrifuged for 5 min at 1100 rpm at 25 °C, supernatant was transferred to T-75 cell culture flasks containing DMEM (Lonza, Basel, Switzerland) supplemented with 10% fetal bovine serum, 100 U/mL penicillin, 100 μg/mL streptomycin, 1% nonessential amino acid stock solution, and 2 mM l-glutamine (all from Sigma) at 37 °C humidified atmosphere with 5% CO2. After 48 h the non-adherent cells were removed and the adherent cells were cultured and characterized (Çelebi et al. Citation2010). Rat bone marrow MSCs demonstrated typical CD29+, CD44+, CD90+, CD34 − and CD45 − immunophenotype (Baykan et al. Citation2014, Li et al. Citation2007). MSCs obtained from passages 2–3 were used in all experiments. Culture medium was changed twice a week.
Experimental set-up and QCM measurements
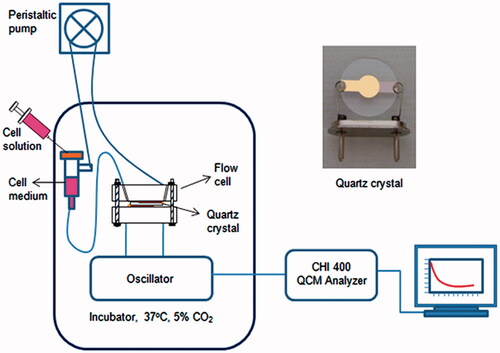
The cell–substrate and cell–drug interaction studies were carried out using a flow chamber. shows the experimental set-up of the real-time detection system and quartz crystal. Briefly, the quartz crystal and each part of the flow chamber were sterilized using a UV light source (254 nm) for 30 min before use and rinsed with sterile PBS. A quartz crystal was placed into the flow chamber inside silicone O-rings and only one surface of quartz crystal contacted with liquid. The flow chamber was connected to an external peristaltic pump system and an oscillator unit and then placed inside a CO2 incubator. The serum-free culture medium was circulated by the peristaltic pump across the flow chamber at a rate of 0.40 mL/min until the frequency shift reached the baseline. After the crystal frequency stabilized in the presence of plain culture medium (required time is approximately 1 h), the cell suspension containing 1.0 × 10⁴ mL−1 MSCs was injected into the circulating medium in three steps, and cultured. The frequency shift (ΔF) was recorded for a duration of 4 h. In order to verify the actual attachment of cells, the crystal surfaces were visualized under the phase contrast microscope after the experiments. As a control, the measurements were performed with culture medium without cells. The control experiments were carried out at the same time to understand the stability with time at a constant flow rate.
Figure 2. Experimental set-up of the real-time QCM detection system and the quartz crystal.
For cell–drug interaction experiments, the PS-coated crystal was used. Vinblastine solution (150 μM) was prepared by diluting with DMEM of the stock solution (prepared in dimethyl sulfoxide; DMSO). The MSC suspension was injected into the circulating medium and the cells were allowed to attach onto the PS surface for 20 h. Following the initial establishment of baseline frequency values, vinblastine solution was introduced to the MSC culture on quartz crystal surface. In this part of the study, two control experiments were performed. For the first control, vinblastine was subjected to PS coated surfaces (no cell) to determine whether the drug actually binds to the surface. Second, the drug solvent, DMSO, was injected into MSCs as a vehicle control. All frequency shifts were recorded simultaneously during the course of the experiments.
MTT assay and IC50 value
MTT asssay was performed to evaluate the effect of drug on cells. MSCs were treated with different concentrations (50, 100, 150, 200 and 250 μM) of vinblastine for 6 h. At the end of exposure, the MTT solution was added into each well, and the absorbance of forming formazan product was measured using a SpectraMax M5 model microplate reader (Molecular Devices, Sunnyvale, CA) (Seker et al. Citation2014). The increasing concentration of formazan product as measured by the amount of optical density (OD) is directly proportional to the number of living cells in culture. The relative cell viability (%) was calculated from ODsample/ODcontrol × 100, where ODsample is the optical density of cells exposed to drug, and ODcontrol is the optical density of the control cells. The half maximal inhibitory concentrations (IC50) were calculated from linear equation of the scatter graph of the % cell death (y-axis) versus log concentrations of drug (x-axis). In linear equation, y value was substituted with 50 to obtain the x value; antilog x being the IC50 value.
Statistical analysis
QCM data of all groups were obtained from three independent experiments, except the ΔF measurements which were performed by six independent experiments. Three-dimensional images (256 × 256 pixels) were processed using the NMI SPM software (ver.2.0.23; Nanomagnetics Instruments, Oxford, UK). ΔF data were expressed as the mean ± standard deviation, and statistically analyzed using a paired two-tailed Student's t-test. A value of p < 0.05 was considered to be statistically significant.
Results
Frequency shifts of coated crystals
The frequencies of the crystals were recorded as before (as F0) and after (as F1) surface coatings. The frequency shifts (ΔF) were calculated by subtracting F1 from F0 (ΔF = F0 − F1), which indicates the shifts in resonance frequency of the crystal due to surface coating. The calculated ΔF values for all surfaces are presented in . The findings indicate that spin coating method causes a greater frequency decrease than that of the nanofiber coating and SAM modifications. We can state that the surface coatings were confirmed by the decrease in crystal frequency.
Table I. Frequency shifts of modified/coated crystals.
AFM results
The surface morphologies of uncoated and coated crystals obtained by AFM are presented in and the corresponding roughness values are given in . The AFM results demonstrate that SAM surfaces possess a homogenous distribution of ordered surfaces.
Figure 3. The three-dimensional AFM images of uncoated (a), 11-MUA (b), 2-mercaptoethanol (c), and 2-mercaptoethylamine (d) modified, and PLGA nanofiber (e), PLGA film (f), PCL film (g), and PS film (h) coated crystal surfaces.
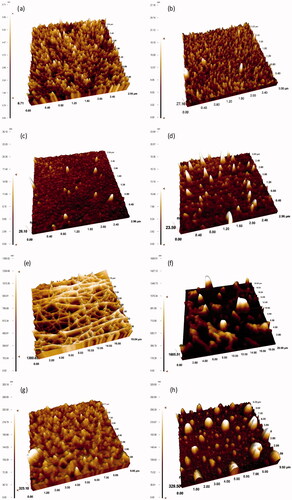
Table II. The average RMS values of surfaces used in this work.
The AFM images of the PLGA nanofibers revealed a fibrous and a more homogenous surface structure with the highest root mean-square roughness (RMS) value, whereas PLGA films formed bulks in different sizes on the surfaces. The spin-coated PS and PCL films were uniformly coated on gold crystal surfaces and exhibited homogenous distribution of the polymers.
AFM results also demonstrate that the RMS roughness of the crystal gold surface had changed after polymer coating or SAM modification procedures. Thus, the surface coatings or the modifications were confirmed by the RMS value changes. The results clearly indicate that the coated surfaces are much rougher than the uncoated surface with the lowest RMS value of 0.8 nm. As can be seen in , SAM modifications caused a lesser degree of surface roughness compared with that of polymer coatings.
Cell morphology
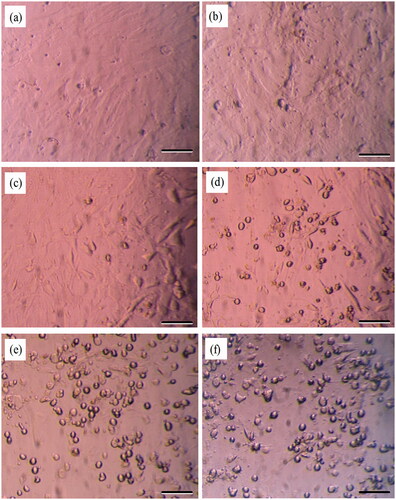
The phase-contrast microscopy images of MSCs exposed to vinblastine (50, 100, 150, 200 and 250 μM) and the control cultures are shown in . The MSCs cultured under standard conditions (no vinblastine) were evenly spread on culture dishes and showed characteristic morphology (). The cells exposed to vinblastine progressively lost their characteristic phenotype at increasing concentrations. As shown in , dramatic changes in morphology had occurred at 150 μM vinblastine concentration. The cells started to shrink and obtained irregular shapes.
Figure 4. Representative phase-contrast microscopy images demonstrating the morphological characteristics of MSCs (a) and MSCs treated with vinblastine concentration of 50 μM (b), 100 μM (c), 150 μM (d), 200 μM (e), 250 μM (f). Scale bars: 100 μm.
Cell-substrate interaction results
indicates the results of real-time monitoring of cell adhesion on uncoated and coated surfaces. The lines II in the figure show cell adhesion on crystals following the injection of MSCs into the circulating medium and the lines I correspond to the control experiments performed without cells ().
Figure 5. Resonance frequency shift of the uncoated (a) and 11-MUA (b), 2-mercaptoethanol (c), 2-mercaptoethylamine (d), PLGA nanofiber (e), PLGA film (f), PCL (g) and PS (h) coated crystal surfaces upon the addition of culture medium (I) and MSC suspension (II) for 4 h at 37 °C.
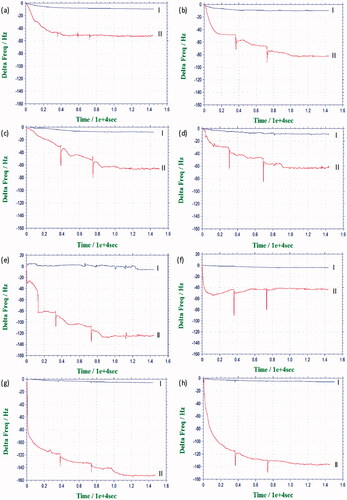
In experimental investigation of cell responses to different surfaces, when the frequency shift of the crystal was stable in culture medium flowing on the quartz crystal, the MSCs were injected to the flow chamber at three stages. When MSCs were introduced to the circulating medium, the frequency value rapidly decreased, as the cells sedimented and contacted the crystal surface, depositing their mass on the surface. Decrease in the frequency was due to cell adhesion on the crystal surfaces. A higher decrease in crystal frequency corresponds to higher level of cell adhesion. Our results indicated that decrease in the frequency started by first addition of cells, and this decrease was much larger than that of the second and third injections. At the end of fourth hour, the frequency became quite stable ().
As seen in , the decrease in the frequency of SAM-modified surfaces was higher than that of unmodified surfaces () which is approximately ∼50 Hz. The other frequency shifts were approximately ∼85, ∼70 and ∼60 Hz, respectively. It is seen that the highest cell adhesion was achieved with the carboxy-terminated surface among SAM surfaces ().
shows the results of real-time monitoring of cell adhesion on PLGA nanofiber and film surfaces, respectively. The results indicated that the frequency shift for the PLGA film was ∼40 Hz, whereas this was ∼130 Hz for the PLGA nanofiber. This shows that cell attachment on PLGA nanofiber surface induced a higher decrease in frequency than that of the PLGA film surface. Electrospun PLGA surfaces demonstrated a higher cell adhesion, related to the nanofibrous structure of the coating layer.
The results of the real-time monitoring of cell adhesion on PCL and PS film surfaces are shown in . The frequency shifts were ∼150 and ∼140 Hz, respectively. Lastly, the frequency changes for each surface in the control experiments were negligible.
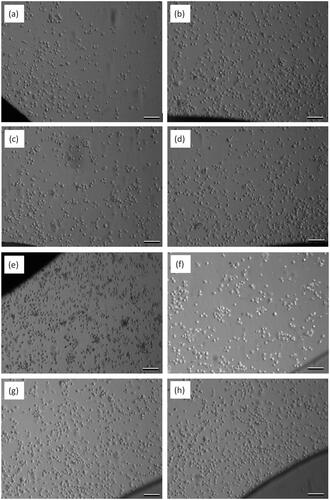
After the cell–substrate interaction experiments, the phase-contrast microscopy images of crystal surfaces were visualized to verify the actual attachment of cells on the crystal surfaces. As can be seen in , cells attached and spread on PS, PCL and PLGA nanofiber coated quartz crystal surfaces, which are consistent with the QCM measurements.
Figure 6. The phase-contrast microscopy images of the uncoated (a) and 11-MUA (b), 2-mercaptoethanol (c), 2-mercaptoethylamine (d), PLGA nanofiber (e), PLGA film (f), PCL (g) and PS (h) coated crystal surfaces after the cell–substrate interaction experiments. Scale bars: 100 μm.
MTT results and IC50 values
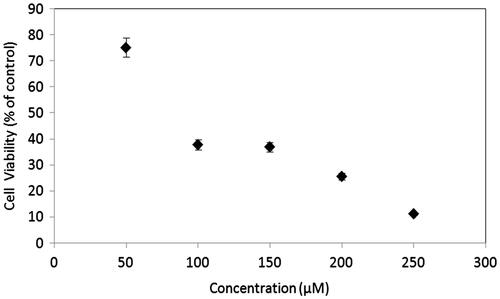
Cell viability in MSCs was measured by the MTT assay at the end of drug exposure duration of 6 h. As seen in , exposure to vinblastine resulted in a significant concentration-dependent decrease in the mitochondrial activity of cells. The calculated IC50 value of vinblastine for MSCs was found to be 92 μM.
Figure 7. Effect of vinblastine on the mitochondrial activity of MSCs. Cells were treated with 50, 100, 150, 200 and 250 μM of vinblastine for 6 h.
Cell–drug interaction results
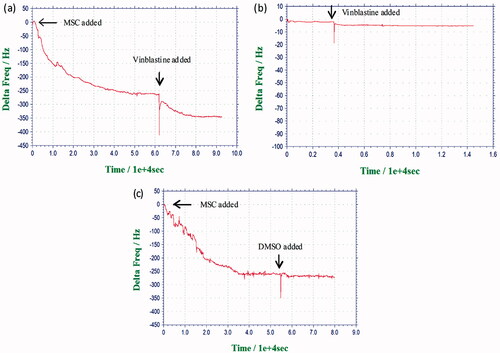
depicts the results of the real-time monitoring of cell response to vinblastine. Frequency shift of the quartz crystal was observed upon the addition of MSCs (first arrow). At the second arrow, vinblastine was added to a final concentration of 150 μM. Following cell addition (first arrow), decrease in the frequency was due to cell adhesion on the quartz for 20 h. After MSCs achieved their steady ΔF values on the biosensor surface, vinblastine was added into the circulating medium. Following drug addition, there was a rapid and significant decrease in the frequency, likely due to the vinblastine binding to the microtubules. Two control experiments involving the injection of vinblastine solution onto PS coated surfaces (no cells) () and the injection of DMSO onto the cells () were also carried out. As can be seen, the frequency changes in the control experiments were negligible.
Figure 8. (a) Resonance frequency shifts of the PS-coated quartz crystal in response to the addition of MSCs at first arrow, vinblastine addition at second arrow. (b) Resonance frequency shifts of the PS-coated quartz crystal in response to the addition of vinblastine at first arrow. (c) Resonance frequency shift of the quartz crystal in response to the addition of MSCs (first arrow), and DMSO addition (second arrow).
Discussion
The cell responses to different surfaces obtained by the QCM system were expressed as variations in frequency shifts as a function of time, after cell injections for each type of surface coating or modification on the quartz. Introduction of cell suspensions on the substrate surfaces had corresponding shifts in oscillation frequency. Results showed that the decrease in frequency following cell adhesion onto substrate depends on the chemical composition of the modified quartz surface. The QCM results demonstrated that the cell response to different surfaces can generate different QCM signals. The maximum frequency response of 150 Hz was observed for PS-coated surfaces. The microscopical observations confirmed and validated the cell attachment results obtained by the QCM.
Prior to performing the study of the cell adhesion on QCM, the stability of all coatings was investigated with control experiments. The results of experiments without cells showed the frequency of coated crystals was stable with time at a constant flow rate. We concluded that the surfaces have mechanical stability at the applied medium flow rate. And also, it is clear that the frequency changes caused by the adsorption of compounds inside the cell culture medium were negligible ().
SAM methods have been commonly used in biomaterials research to form thermodinamically stable monolayer surfaces with specific properties (hydrophilic or hyrophobic, adjustable surface charge and topography, etc.) (Chaki et al. Citation2001). In this work, three functional end groups, –COOH, –OH or –NH2, were created by the SAM method on quartz surface. These modifications were confirmed by the RMS values of modified surfaces. It can be seen from that the RMS roughness values of the modified gold surfaces are higher than that of unmodified gold surface. This suggests that the surface roughness is increased following modification when compared with the RMS values of modified and unmodified surfaces. The frequency shifts caused by SAM modification were also confirmed by the decrease in crystal frequency ().
shows the results of real-time detection of MSC adhesion on the gold surface and modified gold surfaces. The QCM results indicated that the surface modification of gold electrode of crystal resulted in increased cell adhesion. Moreover, the decrease in the frequency on the carboxy-terminated surface, which is the 11-mercaptoundecanoic acid was more than that of the other SAM surfaces.
Electrospinning technique provides ultra thin-polymer fibers with high surface area and controlled pore size (Huang et al. Citation2003). The important advantage of using nanofibers in biomaterials studies is the increased surface area due to highly porous topography for cell adhesion. Since PLGA nanofibers form highly porous structures, which is confirmed by the highest RMS value obtained from AFM, the crystal surfaces coated with PLGA nanofibers had higher affinity to cell attachment than those on the PLGA film surface ().
UV-exposed PS-coated quartz crystals were used in cell–drug interaction experiments. Polystyrene has been commonly used in cell biosensor studies to fabricate a uniform rigid thin film (Fredriksson et al. Citation1998, Lord et al. Citation2006). depicts the QCM responses to MSC adhesion on PS coated surface and to vinblastine effect on the cells. In MSC response to vinblastine, when cells on the PS surface were added to the circulating medium, the frequency value decreased as the cells sedimented and contacted the crystal surface, depositing their mass. Over the first 20 h, the cells reached equilibrium through attachment and spreading, and the drug was introduced into the medium at this point (). Results were expressed as variations in frequency shifts as a function of time. The addition of vinblastine caused significant changes in the cell morphology and thus caused a decreasing frequency in the QCM system (Marx et al. Citation2007). To confirm the occurrence of cell rounding during vinblastine exposure, in vitro cytotoxicity analyses were performed by MTT assay in order to determine the effects of vinblastine on MSCs. MTT results indicated that about 65% of the cells were dead by 6 h of 150 μM vinblastine exposure. We also note that, compared with control cells (), vinblastine-treated cells showed significant difference in their adhesion to the culture dish at 150 μM; thus, the cells that started to shrink detached from culture plates ().
To show that the frequency shift did not result from the adsorption of vinblastine on PS coated surface instead by the cells, we performed a control experiment by injecting vinblastine solution onto PS coated surfaces (without cells). As can be seen, the frequency shift in was insignificant. depicts the QCM responses to DMSO injection (no vinblastine) onto MSCs. DMSO injection did not dramatically change the crystal frequency.
Conclusion
As the conclusion, this study demonstrates the suitability of QCM as an invaluable tool that incorporated stem cells on the quartz crystal surface to investigate cell adhesion, cell–substrate and cell–drug interactions. The adhesion of MSCs on modified crystal surfaces could be continuously monitored and displayed by real-time changes in resonance frequency. This approach opens the way to detect, distinguish and compare chemotherapeutic action of new drugs on stem cells for further use in drug discovery and biomaterials research.
Declaration of interest
YME is the founder and shareholder of Biovalda Health Technologies, Inc. (Ankara, Turkey). The authors declare no competing financial interests in relation to this article. The authors are alone responsible for the content and writing of the paper. This paper is essentially based on the PhD thesis work of ŞŞ. YME acknowledges the support of the Turkish Academy of Sciences (TÜBA), Ankara, Turkey.
References
- Anselme K. 2000. Osteoblast adhesion on biomaterials. Biomaterials. 21:667–681.
- Baykan E, Koc A, Elcin AE, Elcin YM. 2014. Evaluation of a biomimetic poly(ɛ-caprolactone)/β-tricalcium phosphate multispiral scaffold for bone tissue engineering: in vitro and in vivo studies. Biointerphases. 9:029011.
- Bouchet-Spinelli A, Coche-Guérente L, Armand S, Lenouvel F, Labbé P, Fort S. 2013. Functional characterization of starch-degrading enzymes using quartz crystal microbalance with dissipation monitoring (QCM-D). Sensor Actuat B Chem 176:1038–1043.
- Braunhut SJ, McIntosh D, Vorotnikova E, Zhou T, Marx KA. 2005. Detection of apoptosis and drug resistance of human breast cancer cells to taxane treatments using quartz crystal microbalance biosensor technology. Assay Drug Dev Technol. 3:77–88.
- Caplan AI. 2005. Mesenchymal stem cells: cell-based reconstructive therapy in orthopedics. Tissue Eng. 11:1198–1211.
- Chaki NK, Aslam M, Sharma J, Vijayamohanan K. 2001. Applications of self-assembled monolayers in materials chemistry. Proc Indian Acad Sci (Chem Sci). 113:659–670.
- Chen D, Wang J, Xu Y, Li D, Zhang L, Li Z. 2013. Highly sensitive detection of organophosphorus pesticides by acetylcholinesterase-coated thin film bulk acoustic resonator mass-loading sensor. Biosens Bioelectron. 41:163–167.
- Chung TW, Tyan YC, Lee RH, Ho CW. 2012. Determining early adhesion of cells on polysaccharides/PCL surfaces by a quartz crystal microbalance. J Mater Sci Mater M. 23:3067–3073.
- Crosson C, Rossi C. 2013. Quartz crystal microbalance immunosensor for the quantification of immunoglobulin G in bovine milk. Biosens Bioelectron. 42:453–459.
- Çelebi B, Elçin AE, Elçin YM. 2010. Proteome analysis of rat bone marrow mesenchymal stem cell differentiation. J Proteome Res. 9:5217–5227.
- Elcin YM, Elcin AE, Pappas GD. 2003. Functional and morphological characteristics of bovine adrenal chromaffin cells on macroporous poly (dl-lactide-co-glycolide) scaffolds. Tissue Eng. 9:1047–1056.
- Fohlerová Z, Skládal P, Turánek J. 2007. Adhesion of eukaryotic cell lines on the gold surface modified with extracellular matrix proteins monitored by the piezoelectric sensor. Biosens Bioelectron. 22:1896–1901.
- Fohlerová Z, Turánek J, Skládal P. 2012. The cell adhesion and cytotoxicity effects of the derivate of vitamin E compared for two cell lines using a piezoelectric biosensor. Sensor Actuat B Chem. 174:153–157.
- Fredriksson C, Khilman S, Kasemo B, Steel DM. 1998. In vitro real-time characterization of cell attachment and spreading. J Mater Sci Mater M. 9:785–788.
- Frost R, Norström E, Bodin L, Langhammer C, Sturve J, Wallin M, Svedhem S. 2013. Acoustic detection of melanosome transport in Xenopus laevis melanophores. Anal Biochem. 435:10–18.
- Garcia MP, Shahid A, Chen JY, Xi J. 2013. Effects of the expression level of epidermal growth factor receptor on the ligand-induced restructuring of focal adhesions: a QCM-D study. Anal Bioanal Chem. 405:1153–1158.
- Granero-Molto F, Weis JA, Longobardi L, Spagnoli A. 2008. Role of mesenchymal stem cells in regenerative medicine: application to bone and cartilage repair. Expert Opin Biol Ther. 8:255–268.
- Gryte DM, Ward MD, Hu WS. 1993. Real-time measurement of anchorage-dependent cell adhesion using a quartz crystal microbalance. Biotechnol Prog. 9:105–108.
- Guo M, Chen J, Zhang Y, Chen K, Pan C, Yao S. 2008. Enhanced adhesion/spreading and proliferation of mammalian cells on electropolymerized porphyrin film for biosensing applications. Biosens Bioelectron. 23:865–871.
- Huang ZM, Zhang YZ, Kotaki M, Ramakrishna S. 2003. A review on polymer nanofibers by electrospinning and their applications in nanocomposites. Compos Sci Technol. 63:2223–2253.
- Inanc B, Arslan YE, Seker S, Elcin AE, Elcin YM. 2009. Periodontal ligament cellular structures engineered with electrospun poly(dl-lactide-co-glycolide) nanofibrous membrane scaffolds. J Biomed Mater Res A. 90:186–195.
- Kengne-Momo RP, Lagarde F, Daniel P, Pilard JF, Durand MJ, Thouand G. 2012. Polythiophene synthesis coupled to quartz crystal microbalance and Raman spectroscopy for detecting bacteria. Biointerphases. 7:67.
- Khraiche ML, Zhou A, Muthuswamy J. 2005. Acoustic sensor for monitoring adhesion of Neuro-2A cells in real-time. J Neurosci Methods. 144:1–10.
- Koc A, Durkut S, Elcin AE, Tan E, Elcin YM. 2007. Evaluation of modified CMC and CMC-PVA as miscible polymer blend membranes for hepatocytes. Macromol Biosci. 7:681–689.
- Koc A, Emin N, Elcin AE, Elcin YM. 2008. In vitro osteogenic differentiation of rat mesenchymal stem cells in a microgravity bioreactor. J Bioact Compat Polym. 23:244–261.
- Le Guillou-Buffello D, Gindre M, Johnson P, Laugier P, Migonney V. 2011. An alternative quantitative acoustical and electrical method for detection of cell adhesion process in real-time. Biotechnol Bioeng. 108:947–962.
- Le Guillou-Buffello D, Hélary G, Gindre M, Pavon-Djavid G, Laugier P, Migonney V. 2005. Monitoring cell adhesion processes on bioactive polymers with the quartz crystal resonator technique. Biomaterials. 26:4197–4205.
- Li W, Ma N, Ong L-L. 2007. Bcl-2 engineered MSCs inhibited apoptosis and improved heart function. Stem Cells. 25:2118–2127.
- Lord MS, Modin C, Foss M, Duch M, Simmons A, Pedersen FS, Milthorpe BK, Besenbacher F. 2006. Monitoring cell adhesion on tantalum and oxidised polystyrene using a quartz crystal microbalance with dissipation. Biomaterials. 27:4529–4537.
- Lourenço BN, Marchioli G, Song W, Reis RL, van Blitterswijk CA, Karperien M, van Apeldoorn A, Mano JF. 2012. Wettability influences cell behavior on superhydrophobic surfaces with different topographies. Biointerphases. 7:46.
- Lüthgens E, Herrig A, Kastl K, Steinem C, Reiss B, Wegener J, Pignataro B, Janshoff A. 2003. Adhesion of liposomes: a quartz crystal microbalance study. Meas Sci Technol. 14:1865–1875.
- Marx KA, Zhou T, McIntosh D, Braunhut SJ. 2009. Electropolymerized tyrosine-based thin films: selective cell binding via peptide recognition to novel electropolymerized biomimetic tyrosine RGDY films. Anal Biochem. 384:86–95.
- Marx KA, Zhou T, Montrone A, McIntosh D, Braunhut SJ. 2007. Comparative study of the cytoskeleton binding drugs nocodazole and taxol with a mammalian cell quartz crystal microbalance biosensor: different dynamic responses and energy dissipation effects. Anal Biochem. 361:77–92.
- Marx KA, Zhou T, Montrone A, Schulze H, Braunhut SJ. 2001. Quartz crystal microbalance cell biosensor: detection of microtubule alterations in living cells at nM nocodazole concentrations. Biosens Bioelectron. 16:773–782.
- Modin C, Stranne AL, Foss M, Duch M, Justesen J, Chevallier J, et al. 2006. QCM-D studies of attachment and differential spreading of pre-osteoblastic cells on Ta and Cr surfaces. Biomaterials. 27:1346–1354.
- Papadakis G, Tsortos A, Bender F, Ferapontova EE, Gizeli E. 2012. Direct detection of DNA conformation in hybridization processes. Anal Chem. 84:1854–1861.
- Şeker Ş, Arslan YE, Elçin YM. 2010. Electrospun nanofibrous PLGA/fullerene-C60 coated quartz crystal microbalance for real-time gluconic acid monitoring. IEEE Sens J. 10:1342–1348.
- Şeker Ş, Elçin YM. 2014. Bioanalytical applications of piezoelectric sensors. In: Nanopatterning and Nanoscale Devices for Biological Applications, 1st ed. Boca Raton (FL): CRC Press, pp. 259–285.
- Seker S, Elçin AE, Yumak T, Sınağ A, Elçin YM. 2014. In vitro cytotoxicity of hydrothermally synthesized ZnO nanoparticles on human periodontal ligament fibroblast and mouse dermal fibroblast cells. Toxicol In Vitro. 28:1349–1358.
- Tagaya M, Ikoma T, Takemura T, Hanagata N, Okuda M, Yoshioka T, Tanaka J. 2011. Detection of ınterfacial phenomena with osteoblast-like cell adhesion on hydroxyapatite and oxidized polystyrene by the quartz crystal microbalance with dissipation. Langmuir. 27:7635–7644.
- Tymchenko N, Nilebäck E, Voinova MV, Gold J, Kasemo B, Svedhem S. 2012. Reversible changes in cell morphology due to cytoskeletal rearrangements measured in real-time by QCM-D. Biointerphases. 7:43.
- Wang G, Dewilde AH, Zhang J, Pal A, Vashist M, Bello D, et al. 2011. A living cell quartz crystal microbalance biosensor for continuous monitoring of cytotoxic responses of macrophages to single-walled carbon nanotubes. Part Fibre Toxicol. 8:4.
- Watarai E, Matsuno R, Konno T, Ishihara K, Takai M. 2012. QCM-D analysis of material–cell interactions targeting a single cell during initial cell attachment. Sensor Actuat B Chem. 171:1297–1302.
- Wegener J, Janshoff A, Steinem C. 2001. The quartz crystal microbalance as a novel means to study cell–substrate interactions in situ. Cell Biochem Biophys. 34:121–151.
- Wei XL, Mo ZH, Li B, Wei JM. 2007. Disruption of HepG2 cell adhesion by gold nanoparticle and paclitaxel disclosed by in situ QCM measurement. Colloid Surface B. 59:100–104.
- Zhou T, Marx KA, Dewilde AH, McIntosh D, Braunhut SJ. 2012. Dynamic cell adhesion and viscoelastic signatures distinguish normal from malignant human mammary cells using quartz crystal microbalance. Anal Biochem. 421:164–171.