
 ?Mathematical formulae have been encoded as MathML and are displayed in this HTML version using MathJax in order to improve their display. Uncheck the box to turn MathJax off. This feature requires Javascript. Click on a formula to zoom.
Abstract
An amperometric principle-based biosensor, employing immobilized laccase enzyme from Trametes versicolor, was developed for the detection of disubstituted methyl and methoxy phenols. Three immobilization methods such as entrapment, cross-linking, and co-cross-linking, with bovine serum albumin (BSA) on nylon membrane have been compared. Among tested methods of immobilization, co-cross-linking method with BSA was superior to the other methods in terms of; sensitivity, limit of detection, response time, and operating stability. The increased sensitivity of the probe optimization of concentrations of laccase, BSA and glutaraldehyde can be achieved by, employing the Box–Behnken design of experiment.
Introduction
Phenols and their derivatives found in industrial effluents are coming from the activities related to the production of plastics, dyes, drugs, antioxidants, polymers, synthetic resins, pesticides, detergents, disinfectants, pulp, and paper (Adamski et al. Citation2010). Phenolic compounds belong to a class of chemicals polluting and they are easily absorbed by animals and humans, through the skin and mucous membranes (Soares et al. Citation2005). These compounds have been recognized as toxic substances and endocrine disruptors. Their toxicity affects a great variety of organs and tissues such as lungs, liver, and kidneys (Park et al. Citation2012). In addition, due to their great variety, phenolic compounds show a broad range of toxicity levels, being phenol and its alkylated and alkoxylated derivatives classified as priority pollutants. They induce serious pathologies such as developmental abnormalities and carcinogenesis (Kavlock et al. Citation1996). For these reasons, the determination of substituted phenolic compounds, in environmental matrices and in industry effluents has become a matter of great concern and scientific interest. In the past decade, a variety of analytical methods were proposed for determination of phenol and its derivatives, in natural environmental waters and waste waters. The most widely used are gas chromatography (Krizman et al. Citation2007, Padilla-Sanchez et al. Citation2011, Sanchez-Avila et al. Citation2011), high-performance liquid chromatography (Segovia-Martinez et al. Citation2010, Tanigawa et al., Citation2011) and electrochemical methods (Muna et al. Citation2005, Wu Citation2009). These methods are expensive, time-consuming, sometimes require pre-treatment of samples, skilled technicians and are inadequate for in situ monitoring.
Amperometric biosensors proved to be suitable for phenol determination because of their high selectivity, high sensitivity, reliability, simplicity, low build and storage cost, and rapid online monitoring character (Rekha et al. Citation2000).
Horseradish peroxidase (HRP), (Korkut et al. Citation2008), tyrosinase (Girelli et al. Citation2007, Nadifiyine et al. Citation2013, Yagar & Kocaturk Citation2014) and laccase-based electrodes (Portaccio et al. Citation2006, Shimomura et al. Citation2011) have been shown useful, for the selective determination of phenols in environmental matrices as well as total polyphenolic content in food samples (Diaconu et al. Citation2010, Eremia et al. Citation2013). These enzymes were either individually immobilized or a composite multienzyme system immobilized on conventional electrodes to determine phenolic compounds (Solna & Skladal Citation2005). The mechanism for tyrosinase, laccase, and peroxidase in the electrochemical biosensors are different. Generally, the tyrosinase biosensors are applicable to the monitoring of phenolic compounds with at least one free ortho-position, while the laccase biosensors can detect phenolic compounds with free para- and meta- position. Laccase is one of the best candidate to use in analytical systems, for determination of chlorinated and polyphenolic compounds, mainly due to its great stability (Gianfreda et al. Citation1999), wide range of detectable phenolic compounds (Freire et al. Citation2002) and it is not susceptible to product inhibition (Ghindilis et al. Citation1992). Laccase can catalyze the oxidation of those phenolic compounds that are not reactive with the other mentioned enzymes.
In this study, we have attempted to optimize the performance parameters of a laccase-based reusable biosensor probe, based on analysis of disubstituted phenols. This report deals with the comparison of various methods of enzyme immobilization, on nylon membrane, for the development of a Trametes versicolor laccase-based biosensor, for the detection of disubstituted methyl and methoxy phenols in simulated industry effluent. Three immobilization methods such as entrapment, cross-linking and co-cross-linking with bovine serum albumin (BSA) on nylon membrane have been compared. In our study, we have found that the incorporation of BSA during the process of immobilization contributes to long-term operational stability of biosensor based on analysis of disubstituted phenols (Sarika et al. Citation2015). Therefore, further studies were done at a better understanding of the relationships between the concentration of T. versicolor laccase, BSA, and glutaraldehyde, to determine the optimum concentrations, with an aim of getting maximum voltage response. Optimization of concentrations of laccase, BSA, and glutaraldehyde, for maximum response with minimum reagent levels was attempted by using the Box–Behnken design of experiment (Azizi and Asemi Citation2012, Singh et al. Citation2014). Response surface methodology (RSM), which is an efficient statistical technique for the optimization of multiple variables to predict the best performance conditions, with minimum number of experiments was also employed. As far as we are aware, there are no previous reports on optimization of biosensor performance parameters, by the application of Box–Behnken design of experiment on a laccase-based reusable biosensor probe. In this paper, the influence of different enzyme immobilization techniques, on nylon membrane, on the performance of a laccase-based Clark-type electrodes has been evaluated. The various analytical characteristics of the resultant biosensors were tested with different disubstituted phenols.
Principle
Laccase (p-diphenol:dioxygenoxidoreductase, EC 1.10.3.2), is a blue multi-copper containing enzyme, which catalyzes the oxidation of a variety of organic substrates such as phenols, coupled to the reduction of molecular oxygen to water (Solomon et al. Citation1996). The enzyme active site contains four copper atoms of types I (blue copper), II, and III, which play different roles in the enzymatic process. Substrates are oxidized at the T1 site, and the electrons are transferred to the T2/T3 cluster, where molecular oxygen is reduced.
The oxidation of a reducing substrate by laccase typically involves the loss of a single electron and the formation of a free radical (). Radical is generally unstable and may undergo further laccase-catalyzed oxidation (e.g., to form quinone from phenol).
Figure 1. Mechanism of oxidation of 2, 6-dimethoxy phenol by laccase.
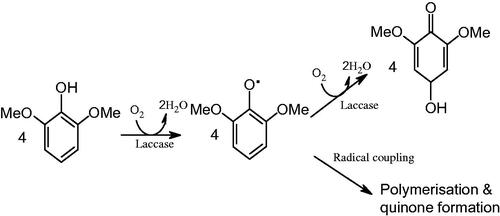
When this reaction is made to occur on the sensing element of a conventional Clark-dissolved oxygen electrode, there is local oxygen depletion, causing the voltage response of the electrode to decrease, based on the following the reactions (EquationEq. 1(1)
(1) ) (Renger & Hanssum Citation2009). The activity of laccase, and in turn the concentration of phenolic substrates can be monitored, in terms of a change in output voltage of the biosensor.
(1)
(1)
The reduction of oxygen (consumption of oxygen by the substrate), leads to the change in current and is linear to the substrate concentration. This signal is conditioned, amplified, and monitored, by the use of an amperometric detector system.
Materials and methods
Reagents
Laccase (from T. versicolor) having specific activity 10 IU mg−1 was procured from Sigma-Aldrich (St. Louis, MO, USA), 2,6-dimethoxy phenol, 2,3-dimethoxy phenol, 2,4-dimethoxy phenol, 3,4-dimethoxy phenol, 2,6-dimethyl phenol, 2,3-dimethyl phenol, 2,4-dimethyl phenol, 3,4-dimethyl phenol, were from SRL Chem. (Mumbai, India). Appropriate amount of various phenols were dissolved in distilled water, to give desired concentration. BSA was procured from Himedia and glutaraldehyde from SD Fine Chem. (Mumbai, India). All chemicals were of analytical reagent grade and were used as received without further purification. Double-distilled water was used throughout the experiment.
Apparatus
An amperometric principle-based detector system, developed in our laboratory, was used to amplify and monitor the signals obtained from enzyme electrode. Clark type of dissolved oxygen electrode was purchased from M/S Century Instruments, Chandigarh, India. Validation studies were carried out using Schimadzu (Japan) HPLC equipped with a LC 20AD model pump.
Enzyme immobilization and construction of biosensor
Various methods of immobilization such as (1) cross-linking, (2) co-cross-linking with BSA, (3) entrapment in gelatin were done on nylon membrane.
Cross-linking with glutaraldehyde: 5 IU of enzyme was cross-linked using glutaraldehyde (2%) on nylon membrane.
Co-cross-linking with BSA: 5 IU of enzyme was cross-linked with glutaraldehyde (5%) on nylon membrane using 2.5 mg of BSA.
Entrapment in gelatin: Entrapment in gelatin was done by mixing gelatin (2.5 mg) with 5 IU enzyme on the surface of the nylon membrane.
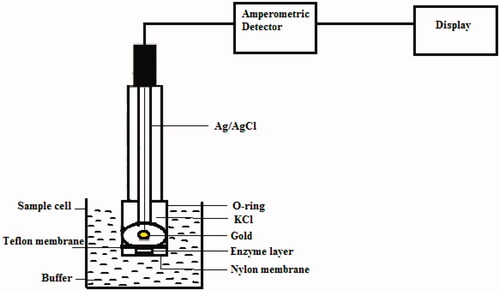
After incubating at room temperature for 1 hour, the enzyme membranes were washed with 0.2 M phosphate buffer (pH 6.8), to remove excess glutaraldehyde. This is attached to the electrode, outer to Teflon membrane using an “O” ring. This electrode was immersed in a sample cell containing 5 ml of 0.2 M phosphate buffer of pH 6.8. A schematic diagram of the biosensor is shown in .
Figure 2. Biosensor configuration.
Measurement of response
The sample cell was continuously saturated with oxygen using a portable air pump. The electrode was connected to the amperometric detector system developed in our laboratory. 50 μl of standard solutions of different disubstituted phenols of varying concentrations was injected into the buffer solution, using a micropipette. When the substrate was introduced into the sample cell, enzyme reaction proceeded, which results in depletion of oxygen in the vicinity of the enzyme membrane, thereby yielding an electrochemical signal of decreasing current. This response was converted into voltage, amplified and monitored, and was directly proportional to the concentration of the analyte. The time taken to reach steady state is 2 minutes. The system provides a 2-point calibration for quantification of various disubstituted phenols.
Optimization of biosensor performance parameters using 2,6-dimethoxy phenol as model substrate
Optimal pH, temperature, and buffer molarity were determined, using 2,6-dimethoxy phenol as model substrate. Box–Behnken design of experiments was employed, in order to optimize the concentrations of laccase, BSA, and glutaraldehyde, for obtaining maximal response and better sensitivity.
Reusability and storage stability of immobilized enzyme membrane
The operational stability studies of immobilized enzyme electrode were carried out at 28 ± 2 °C. The enzyme membranes were stored, by keeping immersed in phosphate buffer of pH 6.8 and the activity was checked daily, by injecting 50 μM 2,6-dimethoxy phenol, and the response recorded as drift in voltage.
The storage stability of enzyme membranes were investigated, by measuring 50 μM 2,6-dimethoxy phenol, 3–4 analyses per day, and the detachable membrane units were stored at 4 °C, by immersing in 0.2 M phosphate buffer of pH 6.8, when not in use.
Calibration plots and analytical characteristics
Linearity studies for biosensor response were performed, in the concentration range of 1–100 × 10−5 M solution, of various disubstituted methyl and methoxy phenols, for the different immobilized membrane electrodes. Reproducibility was studied, by injecting a known concentration of phenolic compound in 10 replicates each. The results were statistically analyzed for standard deviation (SD) and coefficient of variation (CV). Various analytical features such as linearity range, limit of detection, correlation coefficient (R2), and sensitivity were compared, for different methods of enzyme immobilization.
Sample application
Validation of the newly developed biosensor was carried out, by comparing the results obtained from the test biosensor with that of HPLC. A Shimadzu High-Performance Liquid Chromatograph, equipped with a LC 20AD model pump and an injector, was used in the present study, and the column effluents were monitored at 280 nm. Peak areas were determined using LC solution software. The flow rate was 1 ml/min. A 250 × 4.6 mm Luna 5u C18 column was used. Methanol/water mixture was used as the mobile phase.
Simulated effluents were prepared, by mixing various disubstituted phenolic compounds, and the laccase-based biosensor was applied, for the analysis of disubstituted phenols in simulated effluent samples.
Results and discussion
Optimization of parameters for the biosensor taking 2,6-dimethoxy phenol as model substrate
Effect of pH on the biosensor performance
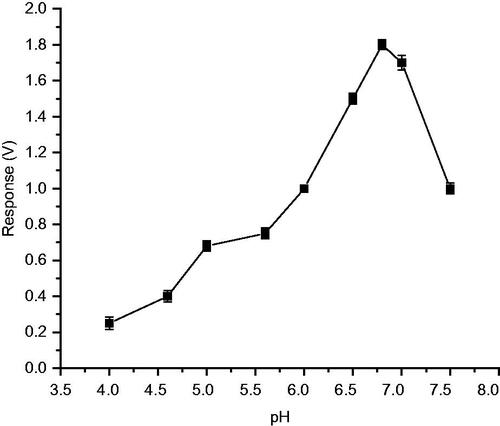
Studies were conducted using biosensor methods, to find the optimum pH for immobilized enzyme, to exhibit maximum activity on 2,6-dimethoxy phenol. The enzyme electrode was incubated in buffers of pH varying from 3 to 8 and the response, for 50 μM 2,6-dimethoxy phenol was determined, which can be considered as an indicator of the enzyme activity. Interestingly, it was observed that response for 2,6-dimethoxy phenol increased upto pH 6.8 and was later decreased. Therefore, it is concluded that the optimum pH for biosensor performance is pH 6.8 ().
Figure 3. Optimum pH for biosensor performance.
Effect of temperature on the biosensor performance
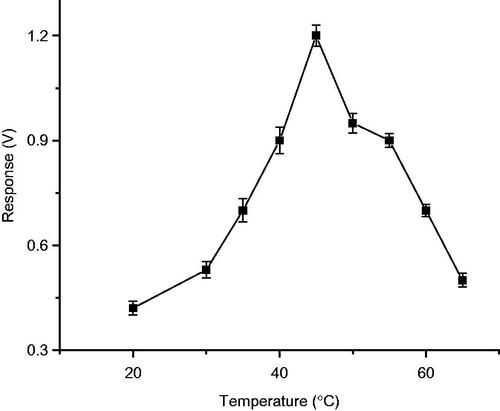
Studies were conducted to find the optimum temperature for immobilized enzyme to exhibit maximum activity using 2,6-dimethoxy phenol as substrate. The enzyme electrode, was incubated in 0.2 M phosphate buffer pH 6.8, at temperatures ranging from 30 °C to 70 °C and the response for 50 μM 2,6-dimethoxy phenol was determined. It was observed that response for 2,6-dimethoxy phenol, increased upto 45 °C and later it was decreased. Therefore, the optimum temperature for biosensor performance is 45 °C (). Results of the study with T. versicolor species, are almost similar as mentioned in the literature, stating that laccase activity is maximum at temperature between 30 and 50, for enzyme those obtained from sources such as; Trametes hirsuta, Sclerotium rolfsii, and Pleurotus ostreatus (Duran et al. Citation2002).
Figure 4. Optimum temperature for biosensor performance.
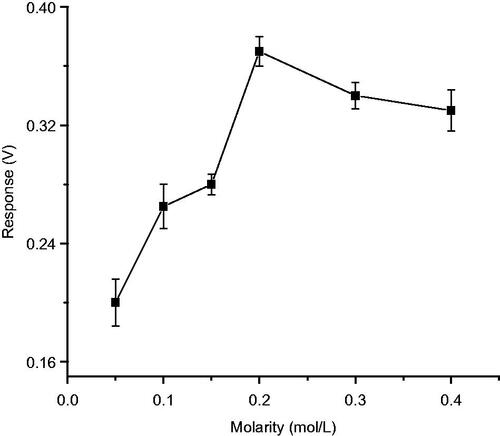
Effect of molarity of the buffer
Effect of molarity was studied by incubating the enzyme electrode in phosphate buffers of molarity ranging from 0.05 M to 0.4 M and the response for 50 μM 2,6-dimethoxy phenol was determined, which was considered as an indicator of enzyme activity. Studies showed that the optimum molarity for biosensor performance is 0.2 M phosphate buffer solution ().
Figure 5. Effect of molarity of buffer on biosensor response.
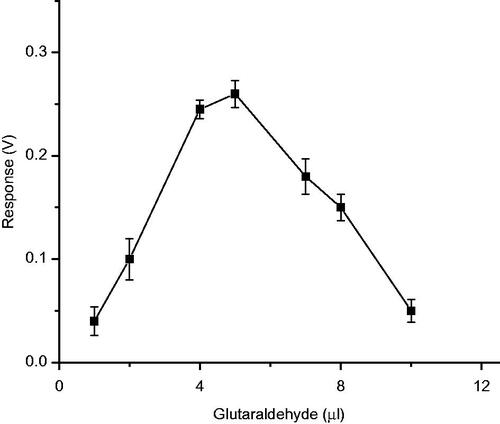
Effect of glutaraldehyde concentration on cross-linking method of immobilization
In order to optimize the glutaraldehyde concentration, for the immobilization of laccase, in cross-linking method, various concentrations of 2% glutaraldehyde were used, at the fixed concentration of enzyme (5 IU). After preparing the enzyme membrane, activity was measured as biosensor response, for 50 μM 2,6-dimethoxy phenol. As the concentration increased from 1 μl to 5 μl of 2% glutaraldehyde, relative activity of the immobilized laccase increased. Further increase in concentration of cross-linking agent, from 5 μl to 10μl, resulted in a sharp decrease in the relative activity of immobilized laccase, probably due to inactivation of enzyme with excess glutaraldehyde. Therefore, the optimum concentration of gluteraldehyde, for cross-linking method of immobilization was found to be 5 μl of 2% gluteraldehyde solution ().
Figure 6. Effect of glutaraldehyde concentration on biosensor response in cross-linking method.
Optimization of concentrations of laccase, BSA, and glutaraldehyde for co-cross-linking method by Box–Behnken design
Optimization of concentrations of laccase, BSA, and glutaraldehyde for co-cross-linking method, in order to get maximum response with minimum reagent levels, was attempted by using the Box–Behnken design of experiment. This involves, the investigation of the linear, quadratic and cross-product effects of the three factors (concentrations of laccase, BSA, and glutaraldehyde), each varied at three levels and three center points for replication. In order to optimize, the effect of these three factors, to get maximum response in voltage of the biosensor, RSM was applied. Measurements were carried out using 50 μM 2,6-dimethoxy phenol solution.
A Box–Behnken design, with three independent variables at three levels, was performed. For the design, the total number of experiments was 15 ( and ). During preliminary experiments, level of each factor including amount of laccase, BSA, and glutaraldehyde was determined (data not shown).
Table I. Factors and levels in Box–Behnken design.
Table II. Coded-level combinations for a three-level, three-variable experimental design.
For creating response surfaces, the experimental data obtained based on the above design were fitted to second order polynomial equation of the form (Azizi and Asemi Citation2012)
(2)
(2)
Where Y is the response in volt; X1, X2 and X3 represent the concentrations of laccase, BSA, and glutaraldehyde respectively; A0 is a constant; A1, A2, A3 are the linear coefficients; A4, A5, A6 are the quadratic coefficients; A7, A8, A9 are the cross-product coefficients. The regression analyses, statistical significances, response surfaces, and optimization of reaction parameters were obtained using Quantum XL software.
Box–Behnken design and analysis of variance (ANOVA)
The coefficients of the response surface model as given by EquationEq. 2(2)
(2) were evaluated by regression analysis and tested for their significance. The coefficient of determination (R2) of the model was 0.9834, which indicates that, the model is suitable to represent adequately the real relationships among the reaction parameters used. The final predictive equation (EquationEq. 3
(3)
(3) ) obtained is given by
(3)
(3)
ANOVA is shown in . We can find that the model is highly significant. The value of determination coefficient (R2=0.9834), a small P value and no significant lack of fit, indicate good relation between the predicted and experimental values (). shows that the predicted values obtained are quite close to the experimental values. All the results indicate that the model developed is successful.
Figure 7. Comparison between the observed values and the predicted values of BBD.
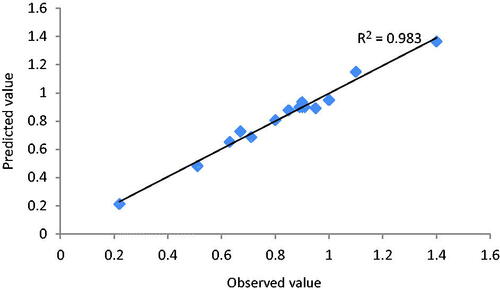
Table III. ANOVA table for the RSM model.
Table IV. Regression statistics.
Three-dimensional (3D) response surface model (RSM)
The best way to express the effect of each variable on response is to generate surface response plots. The typical response surfaces are shown in . As seen in , at lower concentration of laccase (1 IU) and higher concentration of BSA (4 mg), response is very low. A medium concentration of BSA (2.5 mg) and higher concentration of laccase (5 IU), favored maximum response. Similarly, increasing laccase concentration resulted in an increase of response, at any given concentration of BSA. This is because, the sensitivity of the biosensor increased, at higher enzyme loading. It is known that as the enzyme concentration increases, the rate of enzymatic reaction increases linearly. Thus, an increase in the enzyme concentration in the immobilized enzyme membrane, results in a linear increase in biosensor response in volts.
Figure 8. Response surface plots showing the effects of factors (concentrations of laccase (A), BSA (B), and glutaraldehyde (C)) on the response.
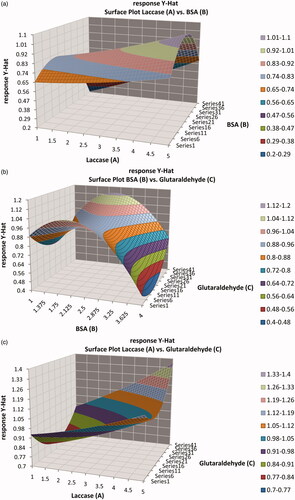
As seen from , this behavior or response in volt going to a minimum, at low concentration of glutaraldehyde (10 μl–5%) and high concentration of BSA (4 mg). A medium concentration of BSA (2.5 mg) and higher concentration of glutaraldehyde (20 μl–5%) favored maximum response. With further increase in BSA concentration, the relative activity of the immobilized enzyme decreased sharply, probably owing to the increase in the thickness of enzyme membrane. This in turn, may lead to the limitations of diffusion of substrates and co-substrates. Variation in the activity of the laccase, immobilized with BSA can be attributed to the physico-chemical nature of the BSA. It is known that the glutaraldehyde modifies only the ɛ-amino group of the lysine. Depending on the % of lysine content of BSA, glutaraldehyde modifies the enzyme. As the percentage available amino group for glutaraldehyde decreased in BSA, the concentration of BSA required reaching the maximum activity, decreased at fixed concentration of glutaraldehyde.
As seen in , a higher concentration of glutaraldehyde (20 μl–5%) and higher concentration of laccase (5 IU) favored maximum response. Similarly, increasing laccase concentration resulted in an increase of response, at any given concentration of glutaraldehyde.
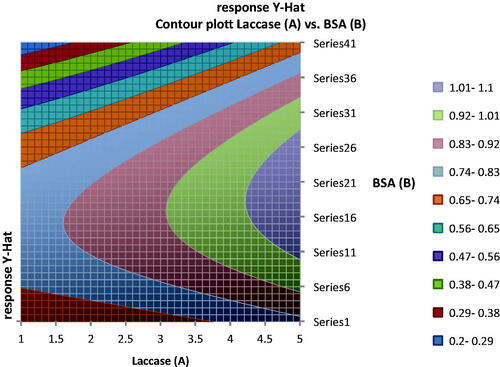
The most efficient and economical conditions would be, to use the lowest concentrations of reagents and yet achieve maximum response in volt. shows the contour plot of concentration of laccase and BSA, at constant concentration of glutaraldehyde.
Figure 9. Contour plot showing the ranges of concentration of laccase and BSA to obtain various response values taking concentration of glutaraldehyde constant.
Optimum condition and verification
The optimal conditions achieved for the analysis of 2,6-dimethoxy phenol were given in .
Table V. Predicted and experimental value for the responses at the optimum conditions.
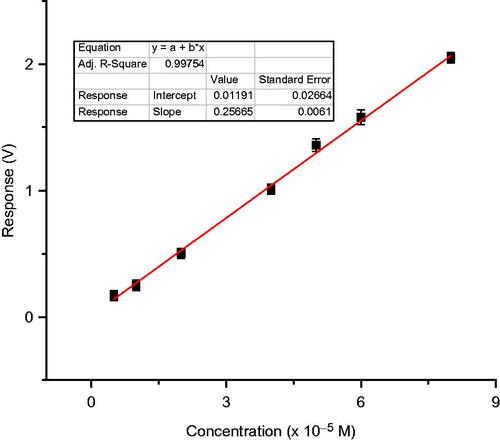
With these conditions, the predicted and actual experimental response were 1.365 V and 1.359 V respectively, for 50 μM 2,6-dimethoxy phenol, showing a good agreement () verified the validity of the model.
Figure 10. Calibration graph for 2, 6-dimethoxy phenol with test biosensor using laccase (5 IU) immobilized with BSA (2.5 mg) and glutaraldehyde (5%–20 μl).
Operational stability and storage stability of immobilized enzyme membrane
The operational stability studies of different immobilized enzyme membranes were carried out at room temperature (28 ± 2 °C).
demonstrates the operational stability of the enzyme electrode, for various immobilization methods on nylon membrane. As shown in the figure, as the number of analyses increased, activity of immobilized laccase increased initially, probably owing to the decreased diffusional barriers for the analyte, which resulted from changes of the enzyme’s 3D structure inside the immobilization matrix upon rehydration (Khan & Wernet Citation1997). Further usage of immobilized enzyme, for repeated analysis of substrate, leads to sharp decrease in activity. However, enzyme immobilized using co-cross-linking method with BSA, shows a stable high activity upto 150 analyses and thereafter declined to reach 50% activity around 400 analyses. The order of operational stability, for the different methods of immobilization is as follows: co-cross-linking > entrapment > cross-linking (). The operating stability implies the number of continuous measurements that can be performed with an enzyme electrode, without loss of its activity. This parameter mainly depends on the properties of the enzyme and on the immobilization procedure. The reason for the better performance of co-cross-linking method of immobilization with BSA may be because BSA stabilizes the enzyme by hydrophobic interactions (Sarika et al. Citation2015). Hydrophobic interactions are considered as the single most important factor in stabilization of enzyme structure.
Figure 11. Operational stability of laccase-based enzyme electrode for various immobilization methods on nylon membrane.
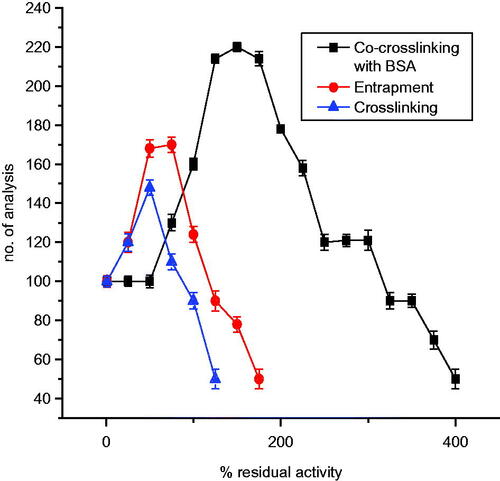
In the case of entrapment in gelatin, the increase in the operating stability of the enzyme electrode was due to a decrease in laccase inactivation, by enzymatic reaction products (quinones) or free radicals formed in the catalytic process, which modify laccase. In this case, gelatin is a trap for the products of enzymatic substrate oxidation (Karolien et al. Citation2012).
While cross-linking method using glutaraldehyde has lower operating stability resulted in a sharp decrease in the relative activity of immobilized laccase, probably due to inactivation of enzyme with excess glutaraldehyde.
To check the shelf life of enzyme membranes, the detachable membrane units were stored at 4 °C in phosphate buffer of pH 6.8 when not in use. 3-4 analyses per day were done for each membrane. The enzyme membrane co-cross-linked with BSA, retained 70% of its initial activity after 5 months, whereas the enzyme membrane developed by entrapment with gelatin, retained 50% of its initial activity after 4 months, but for the cross-linked enzyme membrane, 50% of the initial activity was lost after 60 days. Therefore, the shelf life of enzyme membrane with co-cross-linking method is found to be better than that of based on PVC membrane (2 months) (Chawla et al. Citation2010), NC membrane (4 months) (Pundir et al. Citation2011), and polyethersulfone membrane (15 days) (Gomes & Rebelo Citation2003).
Calibration plots analytical characteristics and reproducibility
summarizes, the characteristics of the calibration plots obtained for 2,6-dimethoxy phenol, for the three types of immobilization methods used, under the optimized working conditions of temperature and pH. Sensitivity of the test biosensor developed with various method of immobilization, with 2,6-dimethoxy phenol was found to be in the order: co-cross-linking with BSA > entrapment in gelatin > cross-linking with glutaraldehyde ().
Figure 12. Calibration graph of laccase-based amperometric biosensor for 2,6-dimethoxy phenol using biosensor employing various immobilization methods on nylon membrane.
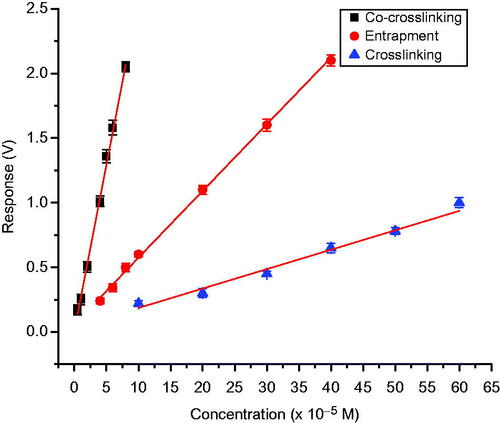
Table VI. Calibration data for methyl and methoxy disubstituted phenolic compounds using laccase biosensor employing various immobilization methods on nylon membrane.
Further experiments were carried out, using co-cross-linking method for various methyl and methoxy disubstituted phenols, and various analytical characteristics are given in . Sensitivity of sensor for 2,6-dimethyl and 2,6; 2,3; 2,4-dimethoxy phenols is found to be high, compared to sensitivity toward 2,3 and 2,4-dimethylphenol, and for 3,4-dimethoxy and 3,4-dimethyl phenols sensitivity is found to be least (). These observations also suggest that, the phenolic ring has to be electron rich, for oxidation by T. versicolor laccase. Both methyl and methoxy substituents are strongly electron donating groups. When these groups, come at positions 2 and 6 (ortho to OH group), phenolic ring will be more electron rich, and therefore, 2,6-dimethoxy and 2,6-dimethyl phenols are showing high sensitivity. But the electron donating power of methoxy substituent is more, when compared to methyl substituent. Therefore, 2,3 and 2,4-dimethoxy phenols are showing more sensitivity, compared to 2,4 and 2,3-dimethyl phenols. Sensitivity of 3,4-dimethoxy and 3,4-dimethyl phenols, are found to be less, because there is no electron donating substituent in the ortho-position. The reproducibility and accuracy of the biosensor were also investigated. The SD and CV were calculated and given in . The results showed that the determinations were consistent in terms of reproducibility, accuracy, and reusability for all methods of immobilizations.
Figure 13. Calibration graph of laccase-based amperometric biosensor for different methyl and methoxy substituted phenols using co-cross-linking with BSA and glutaraldehyde.
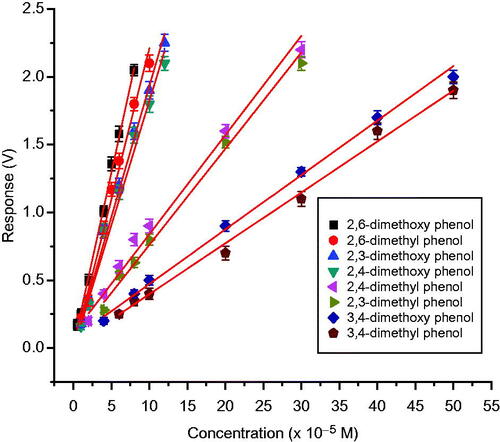
Table VII. Statistical analysis of biosensor response to varying concentration of catechol for the various type of immobilization.
In , characteristics of enzyme membrane with co-cross-linking method are compared, with other enzyme-based phenol biosensors found in the literature. This suggests that the performance characteristics of the proposed phenolic biosensor, being comparable or better, to other previously reported membrane electrodes.
Table VIII. A comparison of properties of various enzyme based phenol biosensors.
Sample application
Validation of the test biosensor was successfully performed by comparing the results with conventional HPLC. The proposed biosensor, containing laccase enzyme immobilized using co-cross-linking method with BSA on nylon membrane, was applied for the analysis of methyl and methoxy disubstituted phenolic compounds, in simulated industry effluents. 50 μl of simulated effluents were added to the reaction cell after equilibration had occurred and then the change in current was measured. The signals obtained from the effluent samples were found to be very similar with that of the reference phenolic compound solutions having the same concentration. Good correlation was observed between results obtained with the test biosensor and those with HPLC ().
Table IX. Simulated effluent sample analysis using test biosensor.
Therefore, the system could be easily applied for the screening of disubstituted phenolic compounds in industrial waste waters.
Conclusion
Sensitive, rapid, and precise determination of phenols and its derivatives is important in environmental control and protection. The crucial issue in the development of enzyme-based electrochemical biosensors is immobilization of the enzyme on a conductive surface. The analytical performances of enzyme-based biosensors strongly depend on the immobilization procedure, accuracy and sensor-to-sensor reproducibility. Operational life time of enzyme based biosensor is also found to be drastically affected by enzyme stability (Sassolas et al. Citation2012). Since the immobilization process can produce an alteration of the 3D conformation of the enzyme that leads to a diminution of the catalytic activity, an adequate choice of the immobilization strategy plays a crucial role in the biosensor design and performance.
In this paper, the influence of different enzyme immobilization techniques, on nylon membrane, on the performances of laccase-based Clark-type electrodes have been evaluated. The analytical properties and operating stabilities of the resulting biosensors were tested with different disubstituted methyl and methoxy derivatives of phenol substrates. Results indicate that co-cross-linking method was superior to the other methods of immobilization in terms of sensitivity, limit of detection, response time, and operating stability. In co-cross-linking method of immobilization, laccase was mixed with BSA as protein-based stabilizing agent and glutaraldehyde as cross-linking agent. The concentration of these variables, for co-cross-linking method, was successfully modeled and optimized using a Box–Behnken design and RSM. RSM was based on three factor, three-variable design to evaluate the effect of variables (concentrations varied in the range (laccase (1–5 IU), BSA (1–4 mg), and gluteraldehyde-5% (10–20 μl)) on the response of biosensor. Analysis of variance indicated that the proposed quadratic model successfully interpreted the experimental data, with coefficients of determination R2=0.9834 and adjusted R2=0.9535. Furthermore, the optimal conditions achieved for the analysis of 2,6-dimethoxyphenol were: laccase – 5 IU, BSA – 2.5 mg, glutaraldehyde – 5%–20 μl. With these conditions, the predicted and actual experimental response values were 1.365 and 1.359 V respectively, for 50 μM 2,6-dimethoxy phenol, showing good agreement. Therefore, co-cross-linking with BSA and glutaraldehyde, on nylon membrane, was found to be better than earlier membrane-based biosensors in terms of its detection limit, linearity range, and sensitivity. Sensitivity of the disubstituted methyl and methoxy phenolic compounds was in this order: 2,6-dimethoxyphenol ≥ 2,6-dimethylphenol > 2,3-dimethoxyphenol ≥ 2,4-dimethoxyphenol >> 2,4-dimethylphenol ≥ 2,3-dimethylphenol >> 3,4-dimethoxyphenol ≥ 3,4-dimethylphenol.
The most efficient and economical conditions would be, to use the lowest concentrations of enzyme and all reagents for immobilization, and yet achieve maximal response. By using RSM, an attempt to understand the relationship between the important variables (enzyme, glutaraldehyde, and BSA) on response, was found to be quite useful to arrive at optimal use of enzyme and reagents, to obtain maximum biosensor response. Our results are hopefully a significant step, toward optimizing immobilization conditions of enzymes, directly onto a biosensor probe, enhancing their application in several areas involving immobilized enzymes.
The detachable membrane unit used by us, for these studies, has enabled a convenient method to follow the activity of the immobilized enzyme, over a long duration, using a number of enzyme membranes, but using a single dissolved oxygen probe. This has made relatively large number of analysis possible in a convenient and economical way. The biosensor technique has been useful to track the operational stability of the immobilized enzymes used this study. With combination of expertise in field enzyme stabilization and advances in methods used for predicting enzyme structural changes during the degradation process, it will become increasingly easy to predict, how to immobilize an enzyme for specific industrial application.
Acknowledgements
C. Sarika gratefully acknowledges the Junior Research Fellowship from Department of Science and Technology, Govt. of India. The authors acknowledge the support from Mr. Lokesh, Assistant Professor, Department of Biotechnology Engineering, MSRIT, Bangalore.
Declaration of interest
The present work was supported by the project fund “DST/TSG/ME/2009/65” from Department of Science and Technology, Govt. of India.
References
- Abhijith KS, Kumar PV, Kumar MA, Thakur MS. 2007. Immobilised tyrosinase-based biosensor for the detection of tea polyphenols. Anal Bioanal Chem. 389:2227–2234.
- Adamski J, Nowak P, Kochana J. 2010. Simple sensor for determination of phenol and its derivatives in water based on enzyme tyrosinase. Electrochim Acta. 55:2363–2367.
- Azizi SN, Asemi N. 2012. Box-Behnken design for determining the optimum experimental condition of the fungicide (Vapam) sorption onto soil modified with perlite. J Environ Sci Health. B. 47:692–699.
- Chawla S, Narang J, Pundir CS. 2010. An amperometric polyphenol biosensor based on polyvinyl chloride membrane. Anal Methods. 2:1106–1111.
- Chawla S, Rawal R, Shabnam, Kuhad RC, Pundir CS. 2011. An amperometric polyphenol biosensor based on laccase immobilized on epoxy resin membrane. Anal Methods. 3:709–714.
- Diaconu M, Litescu SC, Radu GL. 2010. Laccase-MWCNT-chitosan biosensor-a new tool for total polyphenolic content evaluation from in vitro cultivated plants. Sens Actuators B. 145:800–806.
- Duran N, Rosa MA, D’Annibale A, Gianfreda L. 2002. Applications of laccases and tyrosinases (phenoloxidases) immobilized on different supports: a review. Enzyme Microb Tech. 31:907–931.
- Eremia SA, Vasilescu I, Radoi A, Litescu SC, Radu GL. 2013. Disposable biosensor based on platinum nanoparticles-reduced graphene oxide-laccase biocomposite for the determination of total polyphenolic content. Talanta. 110:164–170.
- Freire RS, Duran N, Kubota LT. 2001. Effects of fungal laccase immobilization procedures for the development of a biosensor for phenol compounds. Talanta 54: 681–686.
- Freire RS, Duran N, Wang J, Kubota LT. 2002. Laccase-based screen printed electrode for amperometric detection of phenolic compounds. Anal Lett. 35:29–38.
- Ghindilis AL, Gavrilova VP, Yaropolov AI. 1992. Laccase-based biosensor for determination of polyphenols: determination of catechols in tea. Biosens Bioelectron. 7:127–131.
- Gianfreda L, Xu F, Bollag JM. 1999. Laccases: a useful group of oxidoreductive enzymes. Bioremed J. 3:1–25.
- Girelli AM, Mattei E, Messina A, Papaleo D. 2007. Immobilization of mushroom tyrosinase on controlled pore glass: effect of chemical modification. Sens Actuators B. 125:48–54.
- Gomes SASS, Rebelo MJF. 2003. A new laccase biosensor for polyphenol determination. Sensors. 3:166–175.
- Karolien DW, Stijn DB, Sanaz P, Geert VS, Wouter H, Hendrik AH. 2012. Enzyme-gelatin electrochemical biosensors: scaling down. Biosensors. 2:101–113.
- Kavlock RJ, Daston GP, De Rosa C, Fenner-Crisp P, Gray LE, Kaattari S, et al. 1996. Research needs for the risk assessment of health and environmental effects of endocrine disruptors: a report of the U.S. EPA-sponsored workshop. Environ Health Perspect. 104:715–740.
- Khan GF, Wernet W. 1997. Design of enzyme electrodes for extended use and storage life. Anal Chem. 69:2682–2687.
- Korkut S, Keskinler B, Erhan E. 2008. An amperometric biosensor based on multiwalled carbon nanotube-poly (pyrrole)-HRP nanobiocomposite film for determination of phenol derivatives. Talanta. 76:1147–1152.
- Krizman M, Baricevic D, Prosek M. 2007. Determination of phenolic compounds in fennel by HPLC and HPLC-MS using a monolithic reversed-phase column. J Pharm Biomed Anal. 43:481–485.
- Muna GW, Quaiserova-Mocko V, Swain GM. 2005. The analysis of chlorinated phenol solutions by capillary electrophoresis coupled with direct and indirect amperometric detection using a boron-doped diamond microelectrode. Electroanalysis. 17:1160–1170.
- Nadifiyine S, Haddam M, Mandli J, Chadel S, Blanchard CC, Marty JL, Amine A. 2013. Amperometric biosensor based on tyrosinase immobilized on to a carbon black paste electrode for phenol determination in olive oil. Anal Lett. 46:2705–2726.
- Narang J, Chawla S, Chauhan N, Dahiya M, Pundir CS. 2013. Construction of an amperometric polyphenol biosensor based on PVA membrane. Food measure. 7:22–28.
- Padilla-Sanchez JA, Plaza-Bolanos P, Romero-Gonzalez R, Barco-Bonilla N, Martinez-Vidal JL, Garrido-Frenich A. 2011. Simultaneous analysis of chlorophenols, alkylphenols, nitrophenols and cresols in wastewater effluents, using solid phase extraction and further determination by gas chromatography-tandem mass spectrometry. Talanta. 85:2397–2404.
- Park JS, Brown MT, Han T. 2012. Phenol toxicity to the aquatic macrophyte Lemna paucicostata. Aquat Toxicol. 106–107:182–188.
- Portaccio M, Di Martino S, Maiuri P, Durante D, De Luca P, Lepore M, et al. 2006. Biosensors for phenolic compounds: the catechol as a substrate model. J Mol Catal B: Enzym. 41:97–102.
- Pundir CS, Rawal R, Chawla S, Renuka, Kuhad RC. 2011. Development of an amperometric polyphenol biosensor based on fungal laccase immobilized on nitrocellulose membrane. Artif Cells Blood Substitues Biotechnol. 40:163–170.
- Rekha K, Thakur MS, Karanth NG. 2000. Biosensors for the detection of organophosphorous pesticide. Crit Rev Biotechnol. 20: 213–235.
- Renger G, Hanssum BM. 2009. Oxygen detection in biological systems. Photosynth Res. 102:487–498.
- Sanchez-Avila J, Fernandez-Sanjuan M, Vicente J, Lacorte S. 2011. Development of a multi-residue method for the determination of organic micropollutants in water, sediment and mussels using gas chromatography-tandem mass spectrometry. J Chromatogr A. 1218:6799–6811.
- Sarika C, Rekha K, Narasimha Murthy B. 2015. Studies on enhancing operational stability of a reusable laccase-based biosensor probe for detection of ortho-substituted phenolic derivatives. 3 Biotech. 5:1–14.
- Sassolas A, Blum LJ, Leca-Bouvier BD. 2012. Immobilization strategies to develop enzymatic biosensors. Biotechnol Adv. 30:489–511.
- Segovia-Martinez L, Moliner-Martinez Y, Campins-Falco P. 2010. Direct capillary liquid chromatography with electrochemical detection method for determination of phenols in water samples. J Chromatogr A. 1217:7926–7930.
- Shimomura T, Itoh T, Sumiya T, Hanaoka TA, Mizukami F, Ono M. 2011. Amperometric detection of phenolic compounds with enzyme immobilized in mesoporous silica prepared by electrophoretic deposition. Sens Actuators B. 153:361–368.
- Singh N, Srivastava G, Talat M, Raghubanshi H, Srivastava ON, Kayastha AM. 2014. Cicer α-galactosidase immobilization onto functionalized graphene nanosheets using response surface method and its applications. Food Chem. 142:430–438.
- Soares A, Jonasson K, Terrazas E, Guieysse B, Mattiasson B. 2005. The ability of white-rot fungi to degrade the endocrine-disrupting compound nonylphenol. Appl Microbio Biotechnol. 66:719–725.
- Solna R, Skladal P. 2005. Amperometric flow-injection determination of phenolic compounds using a biosensor with immobilized laccase, peroxidase and tyrosinase. Electroanalysis. 17:2137–2146.
- Solomon EI, Sundaram UM, Machonkin TE. 1996. Multicopper oxidases and oxygenases. Chem Rev. 96:2563–2606.
- Tanigawa T, Watabe Y, Kubo T, Hosoya K. 2011. Determination of bisphenol A with effective pretreatment medium using automated column-switching HPLC with fluorescence detection. J Sep Sci. 34:2840–2846.
- Tembe S, Kubal BS, Karve M, D’Souza SF. 2008. Glutaraldehyde activated eggshell membrane for immobilization of tyrosinase from amorphophallus companulatus: application in construction of electrochemical biosensor for dopamine. Anal Chim Acta. 612:212–217.
- Wu Y. 2009. Nano-TiO2/dihexadecylphosphate based electrochemical sensor for sensitive determination of pentachlorophenol. Sens Actuators B. 137:180–184.
- Yagar H, Kocaturk S. 2014. Comparison of some biochemical properties of artichoke polyphenol oxidase entrapped in alginate-carrageenan and alginate gels. Artif Cells Nanomed Biotechnol. 42:268–273.