
Abstract
Context: Tramadol is a centrally acting analgesic and requires frequent dosing. Hence, judicious selection of retarding formulations is necessary. Transdermal ethosomal gel delivery has been recognized as an alternative route to oral delivery.
Objective: The objective was to develop statistically optimized ethosomal systems for enhanced transdermal activity of tramadol vis-à-vis traditional liposomes.
Materials and methods: Box-Behnken design was employed for optimization of nanoethosomes using phospholipon 90G (A), ethanol (B), and sonication time (C) as independent variables while dependent variables were the vesicle size (Y1), entrapment efficiency (Y2), and flux (Y3). It was prepared by rotary evaporation method and characterized for various parameters including entrapment efficiency, size and transflux. Preclinical assessments were conducted on Wistar rats to measure the performance of developed formulations.
Results: The optimized formulation provided mean vesicles size, reasonable entrapment efficiency and enhanced flux when compared with liposome (control). In-vivo absorption study showed a significant increase in bioavailability (7.51 times) compared with oral tramadol. The average primary irritancy index was found to be 1.4, indicating it to be non-irritant and safe for use.
Discussion and conclusion: The results also demonstrated that encapsulated tramadol increases its biological activity due to the superior skin penetration potential. The preclinical study indicates a significant (P < 0.05) extended analgesic effect compared to oral solution using the hot plate test method. The overall results suggest that developed formulation is an efficient carrier for transdermal delivery of tramadol.
Introduction
Chronic pain is among the most disabling conditions in the current scenario (Tait et al. Citation1990). The market is flooded with number of drugs to combat such nociceptive stimuli. Tramadol is one of them used for the management of mild to moderate pain (Rosenblum et al. Citation2008). It is a centrally acting opoid analgesic with two different mechanisms of action (binding to μ-opioid receptors and inhibition of reuptake of norepinephrine and serotonin). The short half-life (4–6 h), hepatic metabolism and pain management in a subconscious patient were the main things of concern in this research. These aforementioned problems can be sidelined by developing a transdermal drug delivery system (TDDS). In a TDDS, the efficacy of a drug cannot be seen until it reaches to systemic circulation crossing the barrier, stratum corneum (SC). Ethosomes are innovative vesicular carriers composed of phospholipids, high concentration of ethanol, and water. The synergistic effects of these two combinations are responsible for deeper distribution as well as penetration in the lipid bilayers of skin. Ethosome differs from liposome is that it contains large amount of ethanol, which gives enhanced transdermal property for both hydrophilic as well as hydrophobic drugs (Keyao et al. Citation2011, Citation2013). Ethosomes are able to transport active substances more efficaciously through the SC into the deeper layers of the skin than conventional liposomes. Ethanol present in ethosomes is a well-known skin penetration enhancer, is thought to work by exerting a “push” or a “pull” on the intercellular region of the SC, leading to greater penetration (Komatsu et al. Citation1996, Magnusson et al. Citation1997). The high flexibility of vesicular membranes from the added ethanol permits the elastic vesicles to squeeze themselves through the pores, which are much smaller than their diameters; thus, ethosomal systems are considerably more efficient in delivering substances to the skin in terms of quantity and depth (Dubey et al. Citation2007a,b, Touitou et al. 2001).
Systematic optimization of formulations using design of experiments (DoE) has become a routine practice across the world, both in industrial and academic milieu. Development of such impeccable systems involves rational blending of a plethora of diverse excipients, like phospholipids, ethanol, etc. The systematic approach of ‘‘formulation by design (FbD)’’ is based on the salient principles of DoE and quality by design (QbD). It provides rationale of understanding the plausible interaction(s) among the variables and helps in selecting ‘‘the best’’ formulation with minimal expenditure of time (Beg et al. Citation2014, Singh et al. Citation2005). Box-Behnken design (BBD) is an independent, quadratic design having treatment combinations at the edges of the process space and, at the center (Ameeduzzafar et al. Citation2014, Chaudhary et al. Citation2013, Govender et al. Citation2005). The application of BBD has been reported in number of transdermal formulations using drugs like risperidone (Imam et al. Citation2014), valsartan (Ahad et al. Citation2012, Citation2013), diclofenac and curcumin transfersomes (Chowdhary et al. 2009, 2014), ibuprofen (Rhee et al. Citation2008) and findings have substantiated the use of BBD for efficient transdermal delivery of tramadol. The attempts, therefore, were made to prepare the nanoethosomes of tramadol, employing ethanol and specialized phospholipids. Further, the work endeavors to investigate the evaluation of the developed formulation for ex-vivo skin permeability studies, biopharmaceutical performance and preclinical study in rats.
Materials and Methods
Materials
Tramadol (TRM) and Phospholipon® 90G (PL90G) were received as gratis sample from Modi Mundi Pharma, (Meerut, India) and Phospholipid GmbH (Nattermannallee, Germany). Ethanol and carbopol® 934 were purchased from SD-fine chemicals (Mumbai, India). High performance liquid chromatography (HPLC) grade acetonitrile, methanol and water were purchased from Thomas Baker Chemicals Ltd., (Mumbai, India). All other chemicals used were of reagent grade and used as received.
HPLC conditions
HPLC system (Agilent Technologies, Waldbronn, Germany) used for this study was equipped with a model LC-LC-20AT pump and SPD-20A variable wavelength detector. The system equipped with Ezchrome software and a 20 μL rheodyne injection loop. Analysis was performed on a Shiseido C-18 column (250 mm × 4.6 mm, i.d. 5 μm) and prior to injection of the drug solution, column was equilibrated for at least 30 min with the mobile phase flowing through the system.
Animals
Albino Wistar rats (6–8 weeks/125–150 g) were received for the study from Central Animal House, Jamia Hamdard, New Delhi. The study was conducted under duly approved protocol and guidelines by the institutional animal ethics committee, Jamia Hamdard and CPSCEA (Committee for the purpose of control and supervision of experiments on animals) Govt. of India (Approval number 967). The animals were inhabited under standard laboratory conditions in 12 h light/dark cycle at 25 ± 2 °C. Pellet diet (Lipton, India) was fed to the animals and water was given adlibitum.
Preparation of skin
Wistar rats were sacrificed with prolonged ether anaesthesia and the abdominal skin of each rat was excised. Hair on the skin of animals were removed with electric clipper, subcutaneous tissues were surgically removed and dermis side was wiped with isopropyl alcohol to remove residual adhering fat. The skin (thickness ∼0.6 mm) was washed with phosphate buffer saline (pH 7.4), wrapped in aluminium foil and stored in a deep freezer at −20 °C till further use (used within 2 weeks of preparation) (Ahad et al. Citation2011).
Formulation and optimization
Nano-sized ethosomes were prepared by thin layer evaporation technique using three factor three-level Box-Behnken statistical designs (Ahad et al. Citation2013). Precisely, Phospholipon® 90G (PL90G) and tramadol were taken in a clean, dry, round bottom flask and dissolved in chloroform: methanol (2:1 v/v). The organic solvent was removed by rotary evaporation (Rotary Evaporator, Model-HS-2005V-N, Hahnshin Scientific Co., Korea) above the lipid transition temperature. The final traces of solvent were removed under vacuum overnight and deposited lipid film was hydrated with ethanolic–PBS (pH 6.5) mixture. The resulting vesicles were probe sonicated at 4 °C at 40% output frequency at 40 W) (Titanium probe, Ultrasonicator, Model-UP100H, Hielscher Ultrasonics GmbH, Berlin, Germany). Fifteen formulations were prepared according to the three factor three-level experimental design shown in . The TRM liposomes (Phospholipon® 90G: cholesterol; 75:25) that were used as a control in the present study were prepared by the aforesaid method (But in this case ethanol was not added). Similarly, Rhodamine red (RR) (0.03% w/v) loaded nanoethosomes and liposomes were prepared for confocal laser microscopy section.
Table I. Experimental runs obtained from Box–Behnken design and their actual and predicted responses for tramadol nanoethosomal formulations.
Experimental design
A 3-factor, 3-level Box Behnken design was used to explore the quadratic response surfaces and for constructing second order polynomial models using Design Expert® (Version 9.1.6, Stat-Ease Inc., Minneapolis, MN). A non-linear computer generated quadratic model for experimental runs were constructed.
(1)
where Y is the measured response associated with each factor level combination; b0 is constant; b1, b2, b3 are linear coefficients, b12, b13, b23 are interaction coefficients between the three factors, b11, b22, b33 are quadratic coefficients computed from the observed experimental values of Y from experimental runs. The variables phospholipid (X1), ethanol (X2), and sonication time (X3) with their dependent variables vesicle size (Y1), % entrapment efficiency (Y2), and transflux (Y3) were shown in . The design showed total of fifteen runs with triplicate center points were generated, further obtained models were evaluated in terms of statistically significant coefficients and R2 values. The optimized experimental values of the responses were quantitatively compared with that of the predicted values.
Characterization
Vesicles size, shape and size distribution
The vesicles size and size distribution were determined by dynamic light scattering (DLS) method, using a zetasizer system (HAS 3000; Malvern Instruments, Malvern, United Kingdom) at 25 ± 1 °C and at a scattering angle of 90°. The ethosomes was mixed with the appropriate medium (PBS, pH 7.4), and measurements were taken in triplicate. The morphology of vesicles was visualized by using TEM (Morgagni 268D, Fei Electron Optics, Eindhoven, Netherlands) at AIIMS, New Delhi, India and images were visualized by soft Imaging Viewer software. Samples were dried on a carbon-coated grid and negatively stained with an aqueous solution of phosphotungstic acid. After drying the specimens were viewed under the microscope.
Entrapment efficiency
Entrapment efficiency was expressed as a percentage of total amounts of TRM found in developed formulations at the end of the preparation. The unentrapped drug in vesicles formulations was separated by centrifugation method (14 000 rpm at 4 °C) using ultra centrifuges (Remi cooling ultracentrifuge, Mumbai, India) (Shumilov et al. 2010). The amount of drug entrapped in the vesicles was then determined by disrupting the vesicles using 0.1% Triton X-100 followed by filtration. The quantification of entrapped drug was done by UV-spectrophotometer at 271 nm (Ammar et al. Citation2009).
Ex-vivo skin transport study
The skin transport study of TRM was performed using transdermal diffusion cell sampling system, SFDC6 (LOGAN Instr. Corp, Somerset, NJ) with an effective permeation area (1 cm2) and receptor cell volume 10 mL phosphate buffer saline (pH 6.8). The skin was later mounted on receptor compartment with the SC side facing towards the donor compartment. An amount of nanoethosomes equivalent to 10 mg of TRM was placed in the donor compartment. Samples of 1 mL were withdrawn from the receptor compartment via the sampling port at different time intervals up to 48 h and analyzed for drug content by HPLC method (Tiwari et al. Citation2003). The receptor phase was immediately replenished with equal volume of fresh media. Similar experiments were performed with a control formulation to compare the enhancement ratio with nanoethosomes.
Confocal laser scanning microscopy study (CLSM)
CLSM study was used to scan fluorescence signal of formulation at different skin depths. Both the RR loaded control and test formulations were applied to skin as described in ex vivo skin permeation study. The skin was removed after 12 h and washed with distilled water. The treated area (6–10 μm) was cut and positioned on microscopic slide with the SC side facing the cover glass. Laser Confocal Microscope with Fluorescence Correlation Spectroscope-Olympus Fluo View FV1000 (OlympusFV1000, Melville, New York, USA) uses an argon laser beam with excitation at 488 nm and emission at 590 nm was used to measure the intensity and the extent of permeation.
Preparation of nanoethosomal gel
Carbopol® 934 (1% w/w) was added into the water and kept overnight for complete humectation of polymer chains. The optimized TRM nanoethosomal formulation (OTEF) was added into the carbopol solution with constant stirring (Ahad et al. Citation2014). Other ingredients, such as 15% w/v polyethylene glycol-400 (PEG-400) and triethanolamine (0.5% w/v), were added to obtain a homogeneous dispersion of gel. This optimized TRM nanoethosomal gel (OTEG) was further used for in-vivo studies.
Characterization of TRM loaded nanoethosomal gel
The prepared TRM nanoethosomal gel was characterized for pH, viscosity, spreadability, homogeneity and drug content.
In vitro drug release
The in vitro release profile of TRM from the nanoethosomal gel (OTEG) was compared with the liposomal gel formulation. The gel was placed in dialysis bag and fixed to the shafts. The study was performed with 500 ml of release medium (pH 6.8) with continuous stirring (100 rpm). After fixed time intervals, 5 ml samples were withdrawn and replaced with fresh medium to maintain sink condition (Chaudhary et al. Citation2013). The collected samples were filtered and analyzed using UV spectrophotometer at 271 nm. The release data were subjected to various kinetic mechanism treatments (Higuchi Citation1963).
Skin irritation study
The skin of rat was used for assessing any kind of skin irritation arising out of the application of transdermal preparation. The comparative irritancy study was carried out using two animal groups (n = 4), receiving 50 mg of 0.8% v/v aqueous formalin solution (standard irritant) and OTEG (Draize et al. Citation1944). After exposure, the animals were examined for signs of erythema and edema and the responses were recorded at 24 and 72h. The primary irritancy index (PII) was determined for each preparation and were accordingly classified as non-irritant if PII <2, irritant if PII = 2–5, and highly irritant if PII = 5–8. The skin irritation study was further confirmed by histopathological study. The samples of skin areas were taken, flattened and preserved in 4% buffered formaldehyde. Biopsies were embedded in paraffin, sectioned at 5 μm using cryostat microtome and stained with haematoxylin and eosin. Finally, sections of test and positive control were investigated under photomicrograph and compared relative to control skin (Dua et al. Citation2013). An adjacent area of untreated skin of each animal was used as a control for the both test.
Pharmacokinetic study
Study design
Rats weighing between 125 and 150 g were selected for this study. About 10 cm2 of skin was shaved on the dorsal side. Before application, rats were kept under observation for 24 h for any untoward effects of shaving. Rats were divided randomly into three groups of six animals each. Group I and Group II was received TRM ethosomal gel (OTEG) and TRM liposomal gel (TLG), and III received and TRM oral formulation (Tramazac® capsule, Zydus Alidac, Baddi, Himachal Pradesh, India) (5 mg/kg equivalent dose of tramadol), respectively. The rats were anesthetized using chloroform and blood samples (∼0.5 ml each) were drawn from the tail and transferred in micro-centrifuge tubes having an EDTA solution as an anticoagulant. The blood samples were centrifuged at 5000 rpm for 10 min and the supernatant plasma of each tube was collected in eppendorf tubes and stored at −80 °C in a deep freezer (New Brunswick Scientific, St. Albans, UK) until analysis. For the analysis of TRM in the stored plasma samples, the samples were allowed to thaw. The plasma samples were extracted suitably and the samples were analyzed by HPLC method (Yalda et al. Citation2007).
In-vivo absorption and statistical analysis
The plasma concentration of TRM at different time intervals was subjected to PK analysis to calculate various parameters: The maximum plasma concentration (Cmax) and time to reach maximum concentration (Tmax) were directly determined from the plasma concentration versus time profile. The area under the curve (AUC0–48), (AUC0–∞) and area under first moment curve (AUMC0–48), elimination rate constant (Kel) and elimination half-life (t1/2) were calculated. Pharmacokinetic parameters were calculated using WinNonlin version 4.0 (Pharsight Corp, Mountain view, CA). The PK data between different formulations was compared for statistical significance by one-way ANOVA followed by the Tukey–Kramer multiple comparisons test using Graph Pad InStat™ software (Graph Pad Software Inc., CA).
Preclinical study
The analgesic activity of developed OTEG was determined in rats using hot plate method (O’Neill et al. Citation1983, Woolfe et al. Citation1944). Latency time or reaction time was the key parameter for this study. The rats were randomly divided into control group, oral treated group (Tramazac® capsule), and transdermal treated group (OTEG) containing six rats in each group. The animal treated to transdermal formulation was shaved 24 h before the experiment and formulation was applied to the naked dorsal region of the rat. The analgesic efficacy was compared of all groups with rat received calculated dose of 5 mg/kg body weight. The latency time was evaluated on the basis of either hind paw lick or jump reaction of after keeping on the thermo controlled aluminum plate. The latency time was recorded at various time intervals 1, 2, 3, 4, 5, 6, 24, and 48 h after drug administration. The mean and standard deviation were calculated for each group. The time taken until the responses occurs (latency time) is prolonged after administration of, centrally acting analgesics (Ammar et al. Citation2009). The latency time and % increase of latency time were calculated by following formula:
(2)
Stability study
For the stability study, OTEG was kept at 4 ± 2 °C and 25 ± 2 °C/60 ± 5% RH. The samples were withdrawn at regular time intervals of 0, 1, 2 and 3 months and were analyzed for drug content. The amount of drug degraded and remained at each time interval was determined. The degradation rate constant (K) was determined from the slope of the Log C versus time curve using following formula:
(3)
The shelf-life (T0.9) for each formulation was determined by using the following formula:
(4)
Results and discussion
Fitting of data to the model
It was observed that the best-fitted model for all dependent variables is quadratic. A positive value in nonlinear polynomial (regression) equation for a response represents an effect that favors the optimization (synergistic effect) while negative value indicates an inverse relationship (antagonistic effect) between the factor and the response as observed from the polynomial equation (Eq. Equation2(2) , Equation3
(3) and Equation4
(4) ). From , it is evident that the independent variable phospholipid has shown the positive effect, whereas ethanol and sonication time have shown negative effects on the responses Y1 and Y2 (Eq. Equation2
(2) and Equation3
(3) ). The size of the vesicles was found to vary between 75.78 ± 2.54 nm to 133.37 ± 5.6 nm. It was observed that vesicles size has a direct positive relationship with the phospholipid concentration (). We have also observed an initial decrease in the vesicle size with increasing ethanol concentration and sonication time. The polynomial equation Equation3
(3) showed a direct relationship between the phospholipid concentrations on EE% of TRM loaded vesicles. The EE was least found with 39.45 ± 2.14% for the formulation F11 and maximum was found 68.53 ± 1.54% for F9. Initially EE of TRM increases with an initial increase in ethanol concentration after that there is a gradual decrease in EE due to rupture of the vesicle wall (). Response Y3 (flux) was negatively affected by phospholipid, ethanol and sonication time (Eq. Equation4
(4) ), it can be retarded if their concentration further increased beyond the optimum limits. An interaction relationship between phospholipid, ethanol and sonication time on transdermal flux has been shown in (). A dome shaped plot was observed, where with increasing concentration of phospholipid and ethanol, initial increase in flux was observed, after that increase in concentration led to gradual decrease in flux. A possible explanation for lower flux at a high ethanol concentration may be that the ethanol at high concentration disrupted the lipid membrane of ethosome so that it becomes leakier to the entrapped drug, this will in turn reduce the flux.
Figure 1. 3D-Response surface plots showing the influence of independent variables (Cholesterol, Span60, and phospholipid) on size (A–B), entrapment efficiency (C–D) and flux (E–F) for TRM ethosomes.
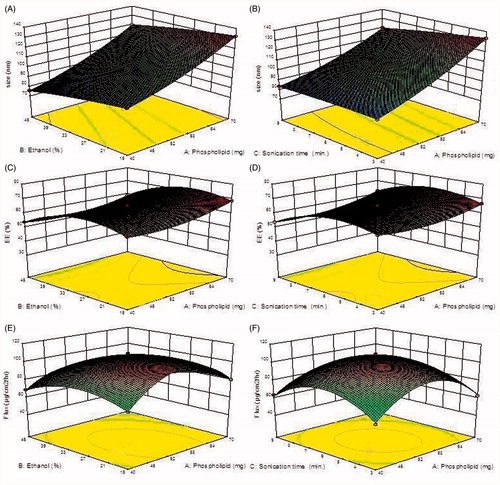
Table II. Summary of regression analysis for responses Y1 [Size (nm)], Y2 [Entrapment efficiency (%)], and Y3 [Flux (μg/cm2/h)] for fitting to different models.
Optimization
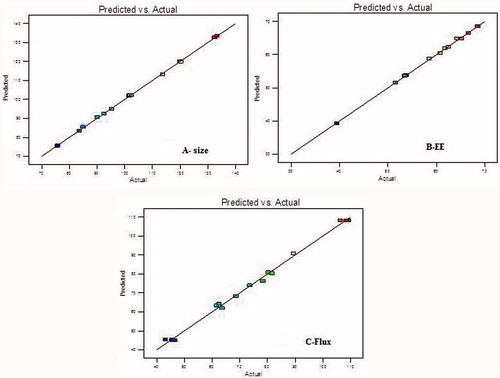
Total 15 formulations were prepared as per the experimental design and characterized for different responses like size, entrapment efficiency and transdermal flux as shown in . The mathematical relationships showed that size, EE and transflux were found to be quadratic and statistically very significant (P < 0.001). The linear correlation plots between the actual and predicted values were plotted and shown with high values of R2 for all the three responses as shown in . The coefficients of the polynomials fit well to the data, with the values of R2 ranging from 0.9958 to 0.9997 (P < 0.05 in all the cases) as shown in . The optimized TRM-loaded nanoethosomal formulation was selected based on optimum vesicle size, % EE and maximum transflux by applying point prediction method of the software. The optimized formulation had phospholipid (57 mg), ethanol (25 ml), and sonication time (6 min). The optimized formulation and control formulation (liposome) have shown vesicle size 108.6 ± 4.45 nm and 567 ± 3.24, %EE 65.87 ± 3.24 and 61.44 ± 2.76 and flux 129.65 ± 15.87 μg/cm2/h and 29.76 ± 17.65 μg/cm2/h across rat skin.
Figure 2. Linear correlation graph of actual versus predicted value, (A) particle size, (B) entrapment efficiency, (C) flux.
Quality evaluation of developed formulation
Vesicles size and morphology
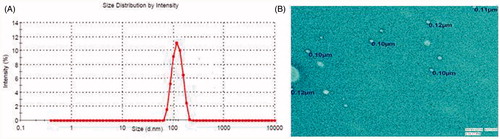
The vesicle size distribution was determined by dynamic light scattering. The mean vesicle size of developed nanoethosomal formulations was shown in . The least mean vesicle size of TRM loaded nanoethosomal formulations is 75.78 ± 1.46nm, while maximum vesicle size 133.37 ± 3.12 nm. These variations in vesicle size were highly significant (P < 0.001). The low polydispersity index showed the unimodal size distribution, which favors transdermal delivery of the drug. The TEM micrographs of OTEF showed the outline and the core of well-identified spherical vesicles, displaying sealed vesicular structure .
Figure 3. (A) Size distribution of optimized TRM ethosomes (B) Transmission electron micrography following negative staining (80,000×).
Ex-vivo skin transport study
The ex-vivo permeation profile of TRM nanoethosomal formulations showed transflux ranges from 43.23 to 109.34 ± 27.43 μg/cm2/h, whereas control formulation showed flux value of 29.76 ± 7.65 μg/cm2/h across rat skin. The better performance of nanoethosomal formulations was due to the presence of a penetration enhancer i.e. ethanol.
Confocal laser microscopy
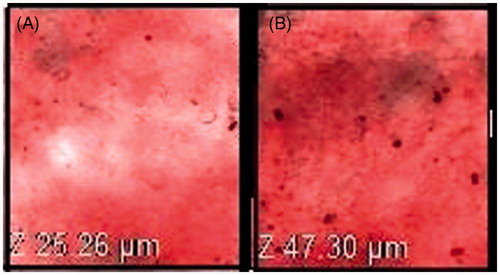
The extent of penetration across the skin was measured by CLSM after application of 0.03% RR loaded nanoethosome formulation and control formulation explained the potential of vesicular carrier (). The results revealed that penetration of OTEF inside the skin was evenly distributed throughout the SC, with high fluorescence intensity. Nanoethosomes penetrated into the skin to a maximum possible depth (up to 47.30 μm, ) while control formulation was confined to few micrometers (up to 25.26 μm) depth only (). This prominently efficient delivery of RR by nanoethosomes suggests their enhanced penetration in the depths of the skin supporting the hypothesis of many researchers (Ahad et al. Citation2012, Dayan et al. Citation2000).
Figure 4. Confocal laser microscopy of Rhodamine loaded (A) liposome formulation (B) nanoethosome formulation (100×).
Characterization of TRM loaded nanoethosomal gel
The nanoethosomal gel was characterized for pH, viscosity, spreadibility, consistency and homogeneity and drug content. The developed OTEG was clear and homogenous, no phase separation. The pH and viscosity were found to be good i.e. 6.84 and 36.45PaS respectively, which indicates that formulation, was compatible to skin pH and had good consistency. The spreadibility of gel formulation was found to be 14.3 ± 1.03 g cm/sec. which indicates gel is easily spreadable by small amount of shear. The percentage of drug content was found to be 91.45 ± 3.24.
In-vitro drug release
This release profile could be important for transdermal delivery to achieve high concentration gradient required for blood (Csoka et al. Citation2007). The in-vitro release profile of TRM from OTEG showed apparently biphasic release pattern. The faster drug release was found during the initial hour (21.65 ± 2.43%, 2 h) followed by slow and constant release (87.86 ± 3.27%, 24 h). The faster release was found due to desorption of TRM from the surface, while the slow and constant drug release was regulated by diffusion of TRM from the nanoethosomal gel matrix. The best fit with highest regression coefficient values (R2) was predicted by zero order model (R2 = 0.9343) rather than for Higuchi (R2= 0.8956) and first order (R2=0.9136) models. This clearly indicated that the release of TRM from the carbopol gel follows zero order kinetics. Since the value of release exponent for the proposed model was >1 (n > 1), the release mechanism was found to be a non-Fickian super case II (typical zero order).
Skin irritation studies
For comparative skin irritation study, OTEG and 0.8% aqueous formalin solution (positive control) was applied to the rat skin. After application of developed formulation and the formalin solution the scores of erythema and edema rating are shown in . The formalin solution was found to be significantly irritant [PII > 2] (P < 0.001), while the developed transdermal formulation was nonirritant [PII <2]. Histopathological examination of the skin sections at the site of the transdermal treatment did not reveal any change in the state of the skin versus normal untreated rat skin. The formulation did not cause either infiltration of inflammatory cells or cyst and bubble formation in the skin. The formalin treated skin showed marked damage to the skin, which was confirmed by erythema and edema scores ().
Figure 5. Histopathological image of (A) Control (B) formalin treated (C) TRM loaded nanoethosomal gel (400×).
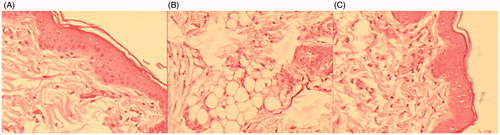
Table III. Comparative skin irritation score after application of test formulation and standard irritant.
In-vivo absorption analysis
The comparative absorption study was performed to quantify bioavailability of TRM after application of the optimized TRM nanoethosomal gel (OTEG), TRM liposomal gel (TLG) and TRM capsule formulation (TCF). The Cmax and Tmax for oral formulation (TCF) were found to be 676.29 ± 35.63 ng/mL and 1.0 ± 0.15 h, respectively. Whereas OTEG and TLG showed Cmax of 491.93 ± 43.87 ng/mL, 83.41 ± 11.12 ng/mL and Tmax of 4.0 ± 0.32 h, 6.0 ± 0.91 h, which were significantly greater (P < 0.001) compared to the oral formulation. It was also observed that AUC0–48, AUC0–∞, AUMC0–48 and AUMC0-∞ of OTEG formulation was 10047.02 ± 350.54 ng/mL/h, 10800.16 ± 405.98 ng/mL/h, 139463.80 ± 603.68 ng/mL/h2 and 187121.20 ± 587.67 ng/mL/h2 respectively, and were found to be extremely significant (P < 0.0001) to both TLG and TCF oral formulation. The oral formulation (TCF) and liposomal gel (TLG) showed AUC0–48, AUC0–∞, AUMC0–48 and AUMC0-∞ values as 1336.31 ± 207.98 ng/mL/h, 1414.91 ± 327.59 ng/mL/h, 5196.75 ± 439.39 ng/mL/h2 and 6445.19 ± 421.48 ng/mL/h2, respectively (). The AUC0–48 of OTEG was significantly (P < 0.001) 7.51 times higher than the oral formulation of same dose. It clearly indicates that bioavailability of TRM from developed ethosomal gel (OTEG) is higher than TLG and TCF. The OTEG provided higher half-life as compared to TCF so, it indicates that nanoethosomal gel follows slow and significantly (P < 0.001) constant release of drug in blood. This may cause longer duration of action via the transdermal system.
Table IV. Absorption profile of tramadol in rats after administration different formulations (mean ± SD, n = 6).
Preclinical study
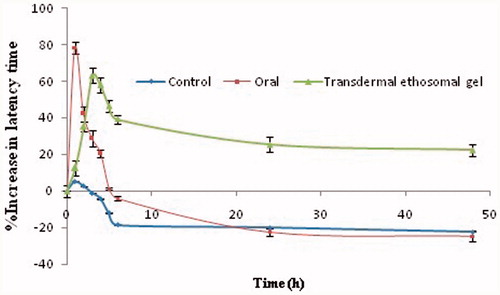
The percentage latency time data of all groups were shown in . The data of percentage increase in latency time in oral group revealed rapid onset (Emax = 2 h) of efficacy. Then there is a sudden decline in analgesic action which reaches to basal latency time after about 4.5 h. The action may be reduced to basal values due to decrease in heat tolerability after the drug elimination from the body. In transdermal treated group (OTEG), the latency time remained above the basal values up to 48 h. The graph showed a slow onset in the analgesic effect of the OTEG. It showed a reasonably gradual increase in latency time till reaching peak effect, which then decreased slowly and gradually. The slow effect can be attributed to the time taken by the drug to permeate the stratum corneum barrier. The drug effect slowly increased and the maximum effect was seen at 6 h (Emax= 6 h). The comparison of analgesic efficacy curves showed that OTEG provided sustained action in comparing to oral formulation. These results attributed a good correlation with in-vitro results vis-à-vis permeation profiles.
Figure 6. In vivo analgesic activity of optimized TRM loaded nanoethosomal gel and oral solution (Mean ± SD, n = 6).
Stability study
The stability study was done as per International Conference on Harmonization (ICH) guidelines. After 3 months of storage at different temperatures, no significant change (P > 0.05) in physical state, particle size, pH, viscosity, spreadibility, drug content was found. The developed formulation was found to be unstable at higher temperature, because at higher temperature, the degradation of the phospholipid may take place. So it is recommended to store the formulation at lower temperature. The formulation showed negligible degradation (<5%) and followed the first order rate kinetics. The shelf life of OTEG was recorded as 17.54 months.
Conclusion
Nanoethosomal formulations were prepared using rotary evaporation technique. Constraints like particle size (minimum), entrapment efficiency (maximum) and flux (maximum) were kept in mind to conclude an optimized formulation. This optimized nanoethosomal formulation of TRM was converted into gel using carbopol as a gelling agent. The developed formulation showed increased permeability due to small particle size. Enhanced analgesic efficacy of OTEG was significant (P < 0.05) compared to an oral marketed formulation of same dose. Overall, these results indicate that nanoethosomal gel can be successfully used for the enhancement of skin permeation and bioavailability of TRM, while sustained release of TRM avoids frequent dosing which in turn improves patient compliance.
Declaration of interest
These authors declare that they have no conflict of interest. Shakeeb Ahmed is thankful to UGC for providing Junior Research Fellowship.
References
- Ahad A, Aqil M, Ali A. 2014. Investigation of antihypertensive activity of carbopol valsartan transdermal gel containing 1, 8-cineole. Int J of Bio Macromol. 64:144–149.
- Ahad A, Aqil M, Kohli K, Sultana Y, Mujeeb M, Ali A. 2011. Interactions between novel terpenes and main components of rat and human skin: mechanistic view for transdermal delivery of propranolol hydrochloride. Curr Drug Del. 8:213–224.
- Ahad A, Aqil M, Kohli K, Sultana Y, Mujeeb M. 2013. Enhanced transdermal delivery of an antihypertensive agent via nanoethosomes: statistical optimization, characterization and pharmacokinetic assessment. Int J of Pharm. 443:26–38.
- Ahad A, Aqil M, Kohli K, SultanaY, Mujeeb M, Ali A. 2012. Formulation and optimization of nanotransfersomes using experimental design technique for accentuated transdermal delivery of valsartan. Nanomed. 8:237–249.
- Ameeduzzafar, Ali J, Khan N, Ali A. 2014. Development and optimization of carteolol loaded corboxymethyl tamarind kernel polysaccharide nanoparticles for ophthalmic delivery: Box-Behnken design, in vitro, ex vivo assessment. Sci Adv Mat. 6:1–13.
- Ammar HO, Ghorab M, El-Nahhas SA, Kamel R. 2009. Polymeric matrix system for prolonged delivery of tramadol hydrochloride, part I: physicochemical evaluation. AAPS Pharm Sci Tech. 1:7–20.
- Ammar HO, Ghorab M, El-Nahhas SA, Kamel R. 2009. Polymeric matrix system for prolonged delivery of tramadol hydrochloride, part II: biological evaluation. AAPS Pharm Sci Tech. 10:1065–1070.
- Beg S, Sandhu PS, Batra RS, Khurana RK, Singh B. 2014. QbD-based systematic development of novel optimized solid self-nanoemulsifying drug delivery systems (SNEDDS) of lovastatin with enhanced biopharmaceutical performance. Drug Deliv. 22: 765–784.
- Chaudhary H, Kohli K, Amin S, Permender R, Vikash K. 2009. Optimization and formulation design of gels of diclofenac and curcumin for transdermal drug delivery by Box-Behnken statistical design. J of Pharm Sci. 100:580–593.
- Chaudhary H, Kohli K, Vikash K. 2014. A novel nano-carrier transdermal gel against inflammation. Int J of Pharm. 465:175–186.
- Chaudhary H, Rohilla A, Rathee P, Kumar V. 2013. Optimization and formulation design of carbopol loaded Piroxicam gel using novel penetration enhancers. Int J of Biol Macromol. 55:246–253.
- Csoka G, Marton S, Zelko R, Otomo N, Antal I. 2007. Application of sucrose fatty acid esters in transdermal therapeutic systems. Eur J of Pharm and Biopharm. 65:233–237.
- Dayan N, Touitou E. 2000. Carriers for skin delivery of trihexyphenidyl HCl: ethosomes vs. liposomes. Biomaterials. 21:1879–1885.
- Draize J, Woodward G, Calvery H. 1944. Methods for the study of irritation and toxicity of substances applied topically to the skin and mucous membranes. J of Pharmacol and Exp Therap. 82:377–389.
- Dua, K, Chakravarthi, S, Kumar, D, Sheshala, R, Gupta, G. 2013. Formulation, characterization, in vitro, in vivo, and histopathological evaluation of transdermal drug delivery containing norfloxacin and Curcuma longa. Int J Pharm Investig. 3:183–187.
- Dubey V, Mishra D, Jain NK. 2007. Melatonin loaded ethanolic liposomes: physicochemical characterization and enhanced transdermal delivery. Eur J of Pharm and Biopharm. 67:398–405.
- Govender S, Pillay V, Chetty DJ, Essack SY, Dangor CM, Govender T. 2005. Optimization and characterization of bioadhesive controlled release tetracycline microspheres. Int J of Pharm. 306:24–40.
- Higuchi T. 1963. Mechanism of sustained-action medication: theoretical analysis of rate of release of solid drugs dispersed in solid matrices. J of Pharm Sci. 52:1145–1149.
- Imam SS, Aqil M, Akhtar M, Sultana Y, Ali A. 2014. Formulation by designbased proniosome for accentuated transdermal delivery of risperidone: in vitro characterization and in vivo pharmacokinetic study. Drug Deliv. 1 -12. DOI: 10.3109/10717544.2013.870260.
- Keyao A, Sun Y, Xu L, Cui X. 2011. Preparation and in vitro evaluation of simvastatin ethosome. Artif Cells Blood Substit Immobil Biotechnol. 39:347–350.
- Keyao A, Yong Sun Y, Yan Wu Y, Haicheng Yuan H, Zhaoyuan Cui Z, Xu L. 2013. Preparation and in vitro percutaneous penetration of simvastatin ethosome gel. Artif Cells Nanomed Biotechnol. 41:315–318.
- Komatsu H, Okada S. 1996. Ethanol enhanced permeation of phosphatidyl choline/phosphatidylethanolamine mixed liposomal membranes due to ethanol induced lateral phase separation. Biochim Biophys Acta. 1283:73–79.
- Magnusson BM, Runn P, Karlsson K, Koskinen L. 1997. Terpenes and ethanol enhance the transdermal permeation of the tripeptide thyrotropin releasing hormone in human epidermis. Int J Pharm. 157:113–121.
- Mura S, Manconi M, Sinico S, Valenti D, Fadda, AM. 2009. Penetration enhancer containing vesicles (PEVs) as carriers for cutaneous delivery of minoxidil. Int J of Pharm. 380:72–79.
- O’Neill KA. 1983. An automated, high-capacity method for measuring jump latencies on a hot plate. J of Pharmacol Meth. 10:13–18.
- Rhee Y, Chang S, Park E. 2008. Optimization of ibuprofen gel formulations using experimental design technique for enhanced transdermal penetration. Int J of pharm. 364:14–20.
- Rosenblum A, Marsch LA, Joseph H, Portenoy RK. 2008. Opioids and the treatment of chronic pain: controversies, current status, and future directions. Exp and Clin Psychopharm. 16:405–416.
- Singh B, Kumar R, Ahuja N. 2005. Optimizing drug delivery systems using systematic design of experiments Part I: Fundamental aspects. Crit Rev in Ther Drug Carrier Sys. 22:27–105.
- Tait RC, Chibnall JT, Krause S. 1990. The pain disability index: psychometric properties. Pain. 40:171–182.
- Tiwari SB, Murthy TK, Pai MR, Mehta PR, Chowdary PB. 2003. Controlled release formulation of tramadol hydrochloride using hydrophilic and hydrophobic matrix system. AAPS Pharm Sci Tech. 4:1–6.
- Touitou E, Dayan N, Bergelson L, Godin B, Eliaz M. 2000. Ethosomes-novel vesicular carriers for enhanced delivery: characterization and skin penetration properties. J of Cont Rel. 65:403–418.
- Verma P, Pathak K. 2010. Therapeutic and cosmeceutical potential of ethosomes: an overview. J of Adv Pharm Tech Res. 1:274–282.
- Woolfe G, MacDonald AD. 1944. The evaluation of the analgesic action of pethidine hydrochloride. J of Pharmac Exp Ther. 80:300–307.
- Yalda HA, Mohammad-Reza R. 2007. Improved liquid chromatographic method for the simultaneous determination of tramadol and its three main metabolites in human plasma, urine and saliva. J of Pharm Biomed Anal. 44:1168–1173.