
Abstract
We aimed to detect the expressions of stem cell transcription factors Nanog and Oct4 in renal cell carcinoma (RCC) tissues. Nanog and Oct4 mRNA expressions in RCC tissues significantly exceeded those in paracancerous tissues (p < 0.01 and p < 0.05), being positively correlated with histological grade (p < 0.01 and p < 0.05) and TNM stage (p < 0.05). With increasing TNM stage (p < 0.01) and lymphatic metastasis (p < 0.05), the positive expression rate of Nanog protein increased. RCC patients with low Nanog and Oct4 expressions in tumor tissues had significantly higher survival rates (p < 0.05). High Nanog and Oct4 expressions may be potential therapeutic targets.
Introduction
Renal cancer is one of the common malignant tumors in the urinary system. The Chinese patients suffering from renal cancer have the highest mortality rate among those who have urinary tumors, with the five-year survival rate of below 20% (Gansler et al. Citation2010). Renal cell carcinoma (RCC), as the most common type of renal cancer, accounts for about 85-90%. Renal cancer cells are insensitive to chemotherapy or radiotherapy, and immunotherapy only works for 10-20% of the patients, so the post-operative recurrence and metastatic rate is as high as 40% (Yaycioglu et al. Citation2013). For renal cancer patients at the later stage, treatment methods are limited and the effects are unsatisfactory because this cancer occurs and progresses following a multi-factor, multi-step procedure with an elusive mechanism.
As early as 1989, a series of factors have been detected in the tissues and embryos at different developmental stages of adult mice, which were referred to as Oct4 by binding octamer motif sites in gene promoter or enhancer region (Radzisheuskaya and Silva Citation2014). Located in human on chromosome 6p21.3, Oct4 is indispensable to the maintenance of pluripotency and involved in the regulation of multidirectional differentiation during embryo development (Kim et al. Citation2013). In 2003, Mitsui et al. discovered a new transcription factor in embryonic stem cells and named it as Nanog. Embryo-specific genes Oct4 and Nanog, which are homeodomain transcription factors, play key roles in the cell differentiation of many organisms. Oct4, Nanog and SOX2 coded transcription factors are crucial to maintaining the multipotency and self-renewal of embryonic stem cells, essentially controlling the stem cell types during the differentiation of three blastocyst lineages (Hattori et al. Citation2007). It has previously been reported that stem cells of adult humans expressing Oct4 and Nanog genes may belong to the target cells for cancerous origin (Ezeh et al. Citation2005, Tai et al. Citation2005). Up to now, whether Nanog and Oct4 genes are expressed in human renal cancer tissues and the correlations with clinical pathological factors have seldom been reported. In this study, the expression levels of Nanog and Oct4 in renal cancer tissues were detected by real-time fluorescence quantitative PCR and immunohistochemical staining method, respectively. Correlations between such expressions and clinical pathological characteristics, such as age, gender, tumor size, TNM stage, lymphatic metastasis, survival and prognosis were retrospectively analyzed.
Materials and methods
Subjects
A total of 86 RCC patients who were diagnosed (by symptoms, clinical signs and imaging data) in our hospital from January 2007 to December 2010 were selected, including 45 males and 41 females aged 42-73 years old, 61.4 in average. All patients were surgically treated, and the resected tumors were frozen, prepared into pathological sections and confirmed as clear cell RCC. The tumors were immediately put into liquid nitrogen after being resected and stored at −80 °C thereafter. Corresponding paracancerous tissues (n = 86) were collected 0.5 cm from the neoplastic foci and pathologically confirmed as normal tissues. TNM stages were classified according to the criteria stipulated in the 7th edition of the American Joint Committee on Cancer (AJCC) Cancer Staging Manual. This study has been approved by the ethics committee of our hospital, and written consent has been obtained from all patients. Major underlying diseases were excluded (vital organs, such as the heart, liver and lungs were free from diseases, and the liver and renal functions were normal). All patients did not receive chemotherapy or targeted drug treatment before surgery. After discharge from hospital, they were followed up until December 2012, with the average time of (3.1 ± 0.5) years. The overall 1-, 3-year survival times and survival rates, as well as the metastasis-free survival time and survival rate were calculated.
Main reagents
Rabbit anti-human Nanog and Oct4 polyclonal antibodies were purchased from Santa Cruz (Dallas, TX) and diluted by 1:200. Cy3-labeled goat anti-rabbit secondary antibody and SP immunofluorescence kit were bought from Abcam (Cambridge, MA). TRIzol, reverse transcription kit and real-time fluorescence quantitative PCR kit were obtained from Life Technologies (Grand Island, NY). Nanog, Oct4 and β-actin primers were synthesized by Sangon Biotech Co., Ltd. (Shanghai, China).
Detection of Nanog and Oct4 mRNA expressions by real-time fluorescence quantitative PCR
Total RNA was extracted from tissue samples by using TRIzol and reverse-transcribed into cDNA with the reverse transcription kit. By using cDNA as the template, the mRNA expression levels of Nanog and Oct4 were detected with real-time fluorescence quantitative PCR kit. Primers were designed according to the cDNA sequences of Nanog and Oct4 in GenBank. Upstream primer of Nanog: 5′-TCGAATTCATGAGTGTGGATCCAGCTTGTCC-3′, downstream primer: 5′-ACAGATCTTCACACGTCTTCAGGTTGCATG-3′, size of amplified product: 170 bp. Upstream primer of Oct4: 5′-AACAATGAGAACCTTCAGGAGA-3′, downstream primer: 5′-CTGGCGCCGGTTACAGAACCA-3′, size of amplified product: 135 bp. Upstream primer of internal reference β-actin: 5′-TGGAATCCTGTGGCATCCATGAAAC-3′, downstream primer: 5′-TAAAACGCAGCTCAGTAACAGTCCG-3′, size of amplified product: 348 bp. The total volume of the PCR reaction system was 25 μL. Reaction condition: pre-denaturation at 95 °C for 30 s, at 95 °C for 5 s, at 60 °C for 20 s, 45 cycles in total. Melting curve analysis was performed after PCR amplification: denaturation at 95 °C for 1 min, cooling down to 55 °C within 20 min, maintenance for 15 s until double DNA duplexes fully integrated. Fluorescence was continuously detected. The experiment was conducted in triplicate. Relative expression level of target gene was calculated: ΔCt = (Cttarget gene) − (Ct β-actin), ΔΔCt = ΔCttarget gene in tumor tissues − ΔCttarget gene in paracancerous tissues. Since the expression level of target gene in paracancerous tissues was 1 that in tumor tissues was 2−△△Ct.
Detection of Nanog and Oct4 protein expressions by immunofluorescent staining method
Tissues were fixed in 4% paraformaldehyde solution, routinely paraffin-embedded and prepared into sections with the thicknesses of 4-5 μm. The sections were deparaffinized, hydrated, treated in freshly prepared 3% H2O2 solution at room temperature for 10 min, washed three times with distilled water (5 min each time), repaired by microwave and washed three times with 0.1 mol/L PBS (5 min each time). After dropping of normal goat serum, the sections were blocked at room temperature for 30 min. After excess liquid was removed, rabbit anti-human Nanog and Oct4 antibodies (primary antibodies were replaced with PBS as control) were dropped, and the sections were washed three times with PBS (5 min each time) after incubation at 4 °C overnight. Then fluorescence-labeled goat anti-rabbit IgG was added, and then sections were reacted at 37 °C for 60 min, washed three times with PBS (5 min each time), added 4',6-diamidino-2-phenylindole, stained at room temperature for 30 min, rinsed three times with PBS at room temperature (10 min each time), blocked, and finally observed and photographed under a fluorescence microscope. The staining results were determined by a double-blind method. Each section was independently observed by two pathologists, and the results on which they agreed were eventually used. Five visual fields (×400) were randomly selected for each section that was scored based on fluorescence intensity and percentage of positive cells (%). Scoring based on fluorescence intensity: Shining fluorescence, 3 points; bright fluorescence, 2 points; weak but obvious fluorescence, 1 point; extremely weak or unobvious fluorescence, 0 point. Scoring based on percentage of positive cells: percentage of positive cells in each visual field: ≤5%, 0 point; 6-25%, 1 point; 26-50%, 2 points; 51-75%, 3 points; 76-100%, 4 points. Product of the two scores was used as the score of fluorescent staining, with the average score ≥6 points as positive and <6 as negative.
Statistical analysis
All data were analyzed by SPSS18.0. The data conforming to the normal distribution were expressed as x±s. Comparisons between cancer and paracancerous tissues were performed by t test. Means of other samples were compared by using independent samples t-test. Frequency data were compared by χ2 test. Since histological grade and TNM stage were ordinal data, correlations between the expressions of target genes and these pathological characteristics were analyzed with Spearman's rank correlation test. Kaplan-Meier survival curve and log-rank test were used for survival analysis. Meanwhile, Nanog and Oct4 expressions and other data were subjected to analysis with a multivariate Cox's regression model to calculate hazard ratio (HR) and 95% confidence interval (CI). p < 0.05 was considered statistically significant.
Results
Correlations between Nanog and Oct4 mRNA expressions in RCC tissues and clinical pathological characteristics
Real-time fluorescence quantitative PCR showed that the expression levels of Nanog and Oct4 mRNA in tumor tissues were significantly higher than those in paracancerous tissues (p < 0.05, p < 0.01; ). Besides, differences between Nanog and Oct4 mRNA expressions in the groups with different ages, genders, histological grades and TNM stages were detected. Such expressions did not show significant differences with regard to gender, age or tumor size (p>0.05). However, the expression levels were significantly positively correlated with histological grade (r = 0.405, p = 0.042; r = 0.571, p=0.005) and TNM stage (Cr = 0.420, p = 0.025; r = 0.48, p = 0.037) ().
Figure 1. Nanog and Oct4 mRNA expressions in RCC and paracancerous tissues detected by real-time fluorescent quantitative PCR (n=86).
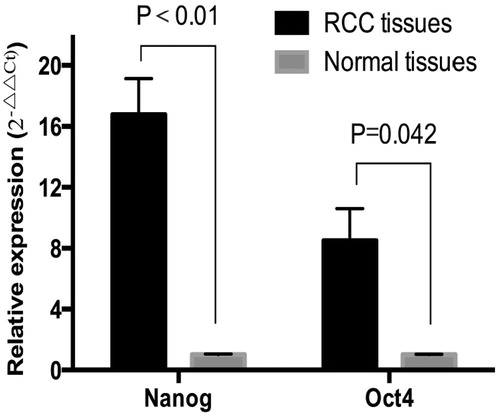
Table I. Correlations between Nanog and Oct4 expressions in RCC tissues and clinical pathological characteristics (n=86).
Correlations between Nanog and Oct4 protein expressions in RCC tissues and clinical pathological characteristics
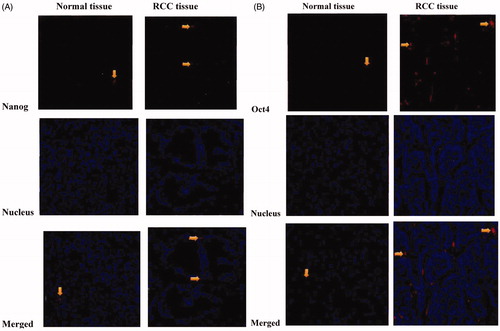
Immunofluorescent staining showed that Nanog protein was mainly expressed in the cell nucleus and cytoplasm, sighted on the cell membrane. Oct4 protein, however, was mainly expressed on the cell membrane and in the cell nucleus, slightly in the cytoplasm (). Nanog was positively expressed in 80.2% (69/86) tumor tissues (there were red, specific fluorescent dots in the cell nucleus and cytoplasm), whereas the positive rate in normal tissues was only 9.3% (8/86), with a statistically significant difference (p < 0.01). The positive expression rate of Nanog in RCC tissue samples with Stage I-II was 74.3% (26/35), and that of samples with Stage III-IV was 84.3% (43/51), which were also significantly different (p=0.003). As RCC progressed (p=0.003) and lymphatic metastasis occurred (p=0.014), the positive expression rate of Nanog protein was gradually up-regulated, with significant inter-group differences (). Oct4 was positively expressed in 66.3% (57/86) tumor tissues, which significantly exceeded that in paracancerous tissues (p < 0.01). The positive expression rate of Oct4 in RCC tissue samples with Stage I-II was 57.1% (20/35), and that of samples with Stage III-IV was 72.5% (37/51), which were significantly different (p=0.014). The Oct4 expressions also differed significantly regarding histological grade (p=0.034). The positive expression rate was not significantly correlated with T stage or lymphatic metastasis (p=0.057, p=0.164) ().
Figure 2. Nanog (A) and Oct4 (B) protein expressions in RCC and paracancerous tissues detected by immunofluorescent staining method.
Correlations between Nanog and Oct4 protein expressions as well as survival and prognosis of RCC patients
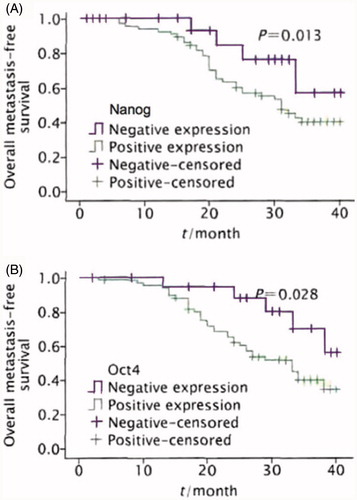
The average follow-up time of the 86 patients was 37.4 months. The 1- and 3-year overall survival rates after radical surgery were 77.9 and 49.1%, respectively; and the 1- and 3-year metastasis-free survival rates were 60.4 and 45.4%, respectively. The Kaplan-Meier survival analysis showed that the patients with positive Nanog and Oct4 expressions had significantly lower survival time and metastasis-free survival rate than those of the negative expression group (p < 0.05). The metastasis-free survival time median of the patients with positive Nanog expression was 13.7 months, and the 3-year metastasis-free survival rate was 40.5%, which were both significantly lower than those of the negative expression group (24.5 months, 59.3%) (p=0.013). The metastasis-free survival time median of the patients with positive Oct4 expression was 15.3 months, and the 3-year metastasis-free survival rate was 38.7%, which were both significantly lower than those of the negative expression group (29.2 months, 56.8%) (p=0.028, ).
Figure 3. Overall metastasis-free survival curves of patients with positive Nanog (A) and Oct4 (B) protein expression and negative results.
Meanwhile, univariate and multivariate Cox’ regression models were used to analyze the correlations between Nanog and Oct4 protein expressions and clinical pathological data. Nanog expression was an important independent prognostic factor (HR = 4.411, 95% CI: 1.215-7.707, p=0.022), suggesting that stem cell marker gene Nanog was a potential biomarker for evaluation on RCC prognosis and was thus of great clinical significance ().
Table II. Univariate and multivariate analyses of prognostic factors.
Discussion
Homeobox protein Nanog, as a transcription factor stably expressed in embryonic stem cells, inner cell mass of blastocysts and primordial germ cells, can be found in early developed embryos, such as human fetal ovaries, primitive stem cells in testes, embryonic germ cells and embryonal carcinoma cells. Nanog plays a crucial role in maintaining the multidifferentiation of embryonic stem cells. Du et al. (Citation2013) found Nanog gene in tumor cells that may be analogous to stem cells; and thus, postulated that this gene was highly related with tumor onset and progression. Li et al. (Citation2013) reported that Nanog was highly expressed in germ cell line-derived tumors and non-small-cell lung carcinoma. By transfecting Nanog gene in human fibroblasts with retrovirus, You et al. (Citation2009) found that the highly differentiated cells re-entered the S phase due to the promoting effects of positive Nanog expression. Up to now, the role of Nanog in renal cancer has rarely been studied.
In this study, the expression level of Nanog in tumor tissues was significantly higher than that of paracancerous tissues, which was similar to the studies on germ cell tumors and pancreatic cancer. Besides, Nanog expression in tumor tissues was positively correlated with histological grade and TNM stage, suggesting that such expression was up-regulated with increasing degree of malignancy and stage. The results were also consistent with those reported about ovarian cancer and pancreatic cancer. Moreover, Nanog was not significantly differently expressed in the tissues from patients with different ages, genders or tumor sizes, so stem cell-related molecule Nanog was ubiquitous in the tumor tissues.
As one of the factors maintaining the pluripotency of embryonic stem cells, Oct4 gene is located on chromosome 6q21.3, encoding a protein as POU transcription factor (Tai et al. Citation2005). The expression level of Oct4 determines how embryonic stem cells differentiate and if they keep on proliferating (Teng et al. Citation2010). Oct4 is a key stem cell transcription factor, with its expression level closely correlated with malignant epithelial tumors, such as bladder cancer and pancreatic cancer as well as affecting the biological behaviors (e.g. metastasis, recurrence, treatment and prognosis) of these tumors. The patients with high Oct4 expressions are prone to fast progression, metastasis and poor prognosis (Chang Citation2006, Kruse et al. Citation2006). In addition, the expression level of Oct4 evidently increases in gastric cancer cells, being associated with their histological grade (Chen et al. Citation2009). In this study, Oct4 was positively expressed in tumor tissues, but the positive expression rate was not significantly correlated with T stage or lymphatic metastasis.
Stem cell-related molecules, which are specifically expressed in undifferentiated cells, such as stem cells and progenitor cells, are essential to the maintenance of the undifferentiated state and the regulation of self-repair. Stem and tumor cells are both typified by self-repair. Oct4, Sox2, c-myc, Nanog and Lin28 are a group of key molecules regulating the self-repair of stem cells, four out of which, after being introduced, allow formation of pluripotent stem cells that are capable of self-repair and multipotential differentiation. The network regulated by Nanog and Oct4 includes many target genes that participate in the Wnt/transforming growth factor β-signaling pathway. Once activated abnormally, this network may disorder many signaling pathways and even lead to cascade effect, finally promoting tumor onset and progression (Yuan et al. Citation2010). In the meantime, Nanog and Oct4 expressions in many human malignant tumors are up-regulated and related with their invasion capacity (Hoei-Hansen et al. Citation2006, Ben-Porath et al. Citation2008, Siu et al. Citation2008).
At present, origin of renal cancer and whether related stem cells exist remain elusive. In this study, Nanog and Oct4 expressions in RCC cells were abnormally activated, indicating that RCC stem cells remain stable in the number probably by continuously secreting related inducible factors. Given that part of cancer stem cells facilitate tumor growth through redifferentiation, renal cancer stem cells may exist indeed. Applying stem cell-related molecules to renal cancer studies may be conducive to analyzing the interaction between them. For example, there are complicated feedforward regulation, feedback regulation and self-regulation between Oct4 and Nanog, forming a network that co-regulates the transcription of target genes. It has previously been reported that close to 20% of target genes are co-regulated by Oct4 and Nanog (Lin et al. Citation2005, Pan et al. Citation2006, Shi et al. Citation2006).
Recently, target treatment has been highlighted in cancer research. Currently, renal cancer has mainly been treated by targeting epidermal growth factor receptor and vascular endothelial growth factor. These drugs, such as gefitinib and bevacizumab, although therapeutically effective, fail to prolong the survival time. Stem cell-related molecules are not only involved in regulating the differentiation and proliferation of normal stem cells, but also abnormally expressed in many human malignant tumors (Huang et al. Citation2005). Nanog and Oct4 expressions were significantly up-regulated herein, with the former positively correlated with the malignant degree of RCC. The Kaplan-Meier survival analysis showed that the patients with positive Nanog and Oct4 expressions had lower survival time and metastasis-free survival rate than those without. Based on previous literatures that linked the two molecules with the onset and progression of renal cancer through multiple pathways, we postulated that they may by promising treatment targets for renal cancer. Hence, down-regulating their expressions or antagonizing their effects may inhibit the growth of renal cancer cells and angiogenesis as well as decrease the possibility of recurrence and metastasis, even inducing tumor cell apoptosis by promoting partial or complete differentiation of these cells. This strategy may be potentially applicable to clinical practice.
Acknowledgements
This study was finally supported by Nanjing Science and Technology Program (No. 201201087).
Declaration of interest
The authors report no declarations of interest. The authors alone are responsible for the content and writing of the paper.
References
- Ben-Porath I, Thomson MW, Carey VJ, Ge R, Bell GW, Regev A, Weinberg RA. 2008. An embryonic stem cell-like gene expression signature in poorly differentiated aggressive human tumors. Nat Genet. 40:499–507.
- Chang CC. 2006. Recent translational research: stem cells as the roots of breast cancer. Breast Cancer Res. 8:103.
- Chen Z, Xu WR, Qian H, Zhu W, Bu XF, Wang S, et al. 2009. Oct4, a novel marker for human gastric cancer. J Surg Oncol. 99:414–419.
- Du Y, Ma C, Wang Z, Liu Z, Liu H, Wang T. 2013. Nanog, a novel prognostic marker for lung cancer. Surg Oncol. 22:224–229.
- Ezeh UI, Turek PJ, Reijo RA, Clark AT. 2005. Human embryonic stem cell genes OCT4, NANOG, STELLAR, and GDF3 are expressed in both seminoma and breast carcinoma. Cancer. 104:2255–2265.
- Gansler T, Ganz PA, Grant M, Greene FL, Johnstone P, Mahoney M, et al. 2010. Sixty years of CA: a cancer journal for clinicians. CA Cancer J Clin. 60:345–350.
- Hattori N, Imao Y, Nishino K, Hattori N, Ohgane J, Yagi S, Tanaka S, Shiota K. 2007. Epigenetic regulation of Nanog gene in embryonic stem and trophoblast stem cells. Genes Cells. 12:387–396.
- Hoei-Hansen CE, Sehested A, Juhler M, Lau YF, Skakkebaek NE, Laursen H, Rajpert-de Meyts E. 2006. New evidence for the origin of intracranial germ cell tumours from primordial germ cells: expression of pluripotency and cell differentiation markers. J Pathol. 209:25–33.
- Huang Q, Wang AD, Dong J, Wang F, Sun JY, Lan Q. 2005. [Molecular researches on neural stem cell differentiation and malignant progression of ganglioglioma]. Tumor. 25:15–18.
- Kim SY, Kang JW, Song X, Kim BK, Yoo YD, Kwon YT, Lee YJ. 2013. Role of the IL-6-JAK1-STAT3-Oct-4 pathway in the conversion of non-stem cancer cells into cancer stem-like cells. Cell Signal. 25:961–969.
- Kruse C, Kajahn J, Petschnik AE, Maass A, Klink E, Rapoport DH, Wedel T. 2006. Adult pancreatic stem/progenitor cells spontaneously differentiate in vitro into multiple cell lineages and form teratoma-like structures. Ann Anat. 188:503–517.
- Li XQ, Yang XL, Zhang G, Wu SP, Deng XB, Xiao SJ, et al. 2013. Nuclear beta-catenin accumulation is associated with increased expression of Nanog protein and predicts poor prognosis of non-small cell lung cancer. J Transl Med. 11:114–125.
- Lin T, Chao C, Saito S, Mazur SJ, Murphy ME, Appella E, Xu Y. 2005. p53 induces differentiation of mouse embryonic stem cells by suppressing Nanog expression. Nat Cell Biol. 7:165–171.
- Mitsui K, Tokuzawa Y, Itoh H, Segawa K, Murakami M, Takahashi K, et al. 2003. The homeoprotein Nanog is required for maintenance of pluripotency in mouse epiblast and ES cells. Cell. 113:631–642.
- Pan G, Li J, Zhou Y, Zheng H, Pei D. 2006. A negative feedback loop of transcription factors that controls stem cell pluripotency and self-renewal. FASEB J. 20:1730–1732.
- Radzisheuskaya A, Silva JC. 2014. Do all roads lead to Oct4? The emerging concepts of induced pluripotency. Trends Cell Biol. 24:275–284.
- Shi W, Wang H, Pan G, Geng Y, Guo Y, Pei D. 2006. Regulation of the pluripotency marker Rex-1 by Nanog and Sox2. J Biol Chem 281:23319–23325.
- Siu MK, Wong ES, Chan HY, Ngan HY, Chan KY, Cheung AN. 2008. Overexpression of NANOG in gestational trophoblastic diseases: effect on apoptosis, cell invasion, and clinical outcome. Am J Pathol. 173:1165–1172.
- Tai MH, Chang CC, Kiupel M, Webster JD, Olson LK, Trosko JE. 2005. Oct4 expression in adult human stem cells: evidence in support of the stem cell theory of carcinogenesis. Carcinogenesis. 26:495–502.
- Teng HF, Kuo YL, Loo MR, Li CL, Chu TW, Suo H, et al. 2010. Valproic acid enhances Oct4 promoter activity in myogenic cells. J Cell Biochem. 110:995–1004.
- Yaycioglu O, Eskicorapci S, Karabulut E, Soyupak B, Gogus C, Divrik T, et al. 2013. A preoperative prognostic model predicting recurrence-free survival for patients with kidney cancer. Jpn J Clin Oncol. 43:63–68.
- You JS, Kang JK, Seo DW, Park JH, Park JW, Lee JC, et al. 2009. Depletion of embryonic stem cell signature by histone deacetylase inhibitor in NCCIT cells: involvement of Nanog suppression. Cancer Res. 69:5716–5725.
- Yuan F, Zhou W, Zou C, Zhang Z, Hu H, Dai Z, Zhang Y. 2010. Expression of Oct4 in HCC and modulation to wnt/beta-catenin and TGF-beta signal pathways. Mol Cell Biochem. 343:155–162.