
Abstract
Conventional chemotherapy majorly lacks clinical application attributed to its inspecificity, adverse effects and inability to penetrate into tumor cells. Hence, the aim of the study was to prepare oxaliplatin solid lipid nanoparticles (OP-SLN) by microemulsion method optimizing it by Box–Behnken design and then covalently conjugated to TRAIL (CD-253) monoclonal antibody (TR-OP-SLN) for targeting colorectal cancer cells. The optimized OP-SLN3 has shown an appreciable particle size (121 ± 1.22 nm), entrapment efficiency (78 ± 0.09%) and drug loading (32 ± 1.01%). Fluorescence study and the Bradford assay further confirmed the binding of the protein. A 1.5-fold increase in cytotoxicity of immuno-nanoparticles (4.9 μM) was observed.
Introduction
Colorectal cancer is the third leading cause of death in the cancer diseases followed by lung and breast cancer. Various diseases occur at the colon region apart from the colorectal cancer such as Crohn’s disease, ulcerative colitis and amoebiasis (Jain et al. Citation2007, Citation2010). Hence, drug targeting and localization at the target site plays an important part in the design of a dosage form.
Among the various treatments available for colorectal cancer (radiation, surgery), chemotherapy comes along as the most applicable treatment strategy where it induces cell death in cancer cells by the employment of anti-cancer agents. However, the adverse effects caused to healthy cells with chemotherapy mainly deprive its appreciable efficacy. This is the consequence of antineoplastics lack of site specificity leading to improper biodistribution. Other limitations of chemotherapy include multi-drug resistance, gradual development of resistance along with the requirement of high dose to induce the desired effect (Colotta Citation2008, Feng Citation2011, Vivek et al. Citation2014).
Most often, dose size needs to be increased due to the inability of the desired concentration of drug to reach tumor site there by leading to undesired toxic effects to healthy cells (Krishnaiah and Satyanarayana Citation2001, Michor et al. Citation2005). This situation paved the way for the formulators to develop a drug delivery system with a novel approach so as to target the tumors specifically and deliver the drug inside the tumor rather than localization. Previous researches conclude the possibility of drug delivery into the tissues rather than through the tissues (Ciftci and Groves Citation1996).
Nanotechnology-based approach is one of the promising approach in the treatment of cancer due to their ability to enhance the drug delivery inside the tumor imparting intended therapeutic effect and decrease in the adverse effects to healthy cells (Feng and Chien Citation2003, Feng et al. Citation2007, Jia et al. Citation2009, Lehár et al. Citation2009, Mitsiades et al. Citation2011, Woodcock et al. Citation2011). The main rationale behind opting for the nanoparticles apart from their targeting approach is their reduction in the particle size (PS) of the active pharmaceutical ingredient (API) that allows the drug to enter easily into the tumors (Anari et al. Citation2015). Nanoparticulate drug delivery also offers various benefits such as delivering high drug concentration at the target site, controlled release of the drug, prevent the drug from enzymatic degradation, prevent covalent conjugation of the drugs directly to the therapeutic agents (Cirstoiu-Hapca et al. Citation2010). Recently, nanoparticles prepared of solid lipid are gaining attention as colloidal drug carriers for mainly intravenous application. Generally, the nanoparticles are in the submicron range ranging from 50 to 1000 nm. These solid lipid nanoparticles (SLNs) decrease the mobility of the incorporated drug there by controlling its release along with imparting stability attributed to the usage of non-toxic surfactants (Cavalli et al. Citation1995, Domb et al. Citation1996, Muller et al. Citation2000, Siekmann and Westesen Citation1992).
But along with the drug localization at the target site, the intracellular delivery of the drug is preferable which can be achieved by active targeting of the nanoparticles with targeting moiety such as an antibody specific to certain antigens over expressing at the colon tumors. Monoclonal antibodies (mAbs) are generally used as targeting moiety mainly with nanoparticles. The majority of the primary tumors over express certain proteins (such as growth factor proteins, tumor necrosis factor-related apoptosis-inducing ligand (TRAIL), etc.), for which mAb has to be selected for receptor-mediated internalization of the drug. This conjugation of the antibody with the SLNs leads to the formation of immuno SLNs, which is shown pictorially in .
Figure 1. The pictorial hypothesis of the development of oxaliplatin immuno solid lipid nanoparticles and their targeting and intracellular accumulation inside the tumor.
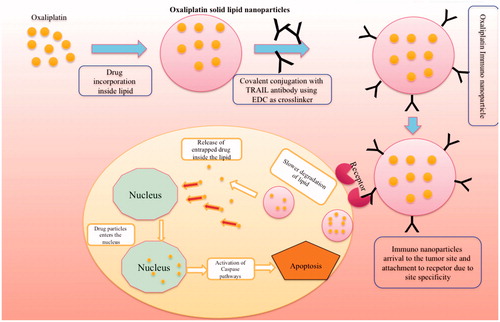
Going in depth of the mechanism of drug release through immuno SLNs, once the immuno-nanoparticles enter the tumor surface, it binds to the over expressing receptor present on the cell surface mainly due to their site specificity. Binding to the receptor leads to the generation of membrane potential and formation of clathrin coats around the nanoparticles. This coat gets opsonized once it enters the inside of the tumor leading to the formation of the vesicle. This vesicle binds with the other free ones to form an endosome. The endosome releases the SLNs outside from the endosome and antibody is further sent to the lysosome for processing. Once the SLNs enter the environment outside the nucleus, it releases the drug slowly and enters the nucleus and acts by its own mechanism of inducing apoptosis. The antibody acts by its own pathway of inducing apoptosis if it is having any apart from the site specificity. The reason behind the separation of covalent conjugation between the antibody and the nanoparticles is due to the fact that amine bond of the antibody gets dissociated mainly due to the acidic pH (4.5) inside the tumor there by causing separation. The following mechanism can be observed in pictorial form in .
Oxaliplatin (OP) (oxalate(translate-1,2-diaminocyclohexane) belongs to third-generation anti-tumor compound and is one of the compounds at present used for the first-line chemotherapy along with 5-fluorouracil for the treatment of colorectal cancer in advanced stages. OP, although similar in activity to other platinum compounds when compared, it differs among the properties that can be attributed to the presence of an oxalate “leaving group” and the diaminocyclohexane (DACH) carrier ligand, which are responsible, at least in part, for its unique properties. Replacement of amine group by DACH in cisplatin differs OP from it. The presence of oxalate group that helps in the non-enzymatic transformation into a reactive compound in plasma by its displacement supports our rationale in selecting OP due to its better pharmacokinetic profile compared to cisplatin. OP, as therapeutically effective it can be, but still posing side effects such as peripheral distal neurotoxicity and acute dysesthesia limiting its dose and clinical activity. Lack of site specificity of OP leading to its distribution to healthy pushes for the development of dosage form with enhanced targeting to the tumor site and drug release inside the tumor rather than localization. So active targeting of OP minimizes its limitations by intracellular accumulation of the drug only into the tumor tissues by receptor-mediated endocytosis.
TRAIL (or Apo-2L or CD-253) and TRAIL death receptor antibodies are clearly distinguished themselves as successful biologically targeted anti-tumor proteins. It belongs to the tumor necrosis factor family and can induce apoptosis in only human cancer cells there by excluding healthy cells (Holoch and Griffith Citation2009, Walczak et al. Citation1999). This feature of TRAIL helps in targeting only cancer cells as it is expressed in cancer cells only. Upon TRAIL overexpression during cancer, it interferes with TRAIL-induced apoptosis there by leading to the multiplication of cancer cells. Generally, TRAIL-R1 and TRAIL-R2 are death receptors that are commonly known as DR4 and DR5, respectively. The main property of these receptors is their ability to transduce death signals to the intracellular apoptotic machinery. This property of TRAIL allows us to select it as a targeting ligand along with its cytotoxicity activity there by helping the drug in a synergistic way (LeBlanc and Ashkenazi Citation2003, Sheikh and Huang Citation2004).
Working on the rationale, in this study, we formulated TRAIL-targeted OP immuno SLNs for preferential receptor-mediated targeting of drug and synergistic activity. Hence, the main aim behind the work is to achieve synergistic apoptotic activity for OP by conjugating it with TRAIL attributed to TRAIL individual apoptotic activity paving the way for clinical therapeutic efficacy. OP-SLNs were prepared by microemulsion method with varying ratios of lipid (designed by Design of experimentation using Minitab version 16, Coventry, United Kingdom) using Box–Behnken design (Maleki Dizaj et al. Citation2015). The prepared SLNs were covalently conjugated (amine conjugation) with the TRAIL antibody using ethyl di-carbodiimide (EDC) as a cross-linker to achieve desired immuno SLNs. We reported on the supposed drug delivery of immuno-nanoparticles into the tumors mainly by active targeting.
Materials and methods
Materials
OP was obtained as a gift sample from Cipla Limited, Bangalore, India. Stearic acid, soy lecithin, pluronic F68 were purchased from HiMedia Laboratories (Mumbai, India). Anti-TRAIL (CD-253) antibody (T3067), secondary antibody anti-mouse IgG (whole molecule)–Fluorescein isothiocyanate (FITC) antibody produced in goat, EDC and fluorescein were purchased from Sigma-Aldrich, Mumbai, India.
Formulation of SLNs by microemulsion method
Dilution of microemulsion forms the basic technique in employing microemulsion method. As OP is hydrophilic, it is mixed in the aqueous phase along with surfactant soya lecithin to form an aqueous solution at 75–80 °C. The lipid was dissolved at 75 °C, which is higher than its melting point (69.3 °C). Both the lipid phase and aqueous phase was maintained at the same temperature. The drug containing aqueous phase was added slowly to the lipid phase drop by drop under constant stirring on the magnetic stirrer. After complete transfer of the oil phase to aqueous phase, it was allowed to stir for 30 min leading to the formation of an emulsion. The emulsion formed was transferred to the water, which is maintained at 2 °C under constant stirring at 10,000 rpm for 5 h. Soya lecithin (0.5%, 1.5% and 2.5%) and stearic acid (at different drug:lipid ratios of 1:1, 1:2, 1:3 and 1:4) were selected at different ratios (by Box–Behnken design) and the one which shows optimum PS, drug loading and entrapment efficiency (EE) will be selected. The main idea behind selecting stearic acid as the lipid is the presence of free carboxyl group that help it’s linking with the cross-linker. The composition of the various SLNs can be seen in for different ratios of lipid and keeping the concentration of soya lecithin as 1.5% and co-surfactant as 1%. So, as to show the brief final composition of the SLNs with altered lipid ratios, this table kept surfactant and co-surfactant values constant which are already optimized by us and shown in the below article.
Table 1. Composition of oxaliplatin solid lipid nanoparticles with different ratios of drug:lipid.
Optimization of SLNs using Box-Behnken design (Jain et al. Citation2014, Sood et al. Citation2014)
Drug:lipid ratio (A), surfactant (%) (B) and co-surfactant (%) (C) were selected as the main three independent variables and evaluate the interaction effects, contour plot and optimization plots of these formulation ingredients on the dependent variables PS and EE which are regarded as response y1 and y2. Minitab version 16.0 software was used to conduct the study. Seventeen experiments were run in random order with five center points for allowance of pure error. Experiments were established based on Box–Behnken design with three factors at three levels. All the three independent variables were coded at three levels between −, 0 and +. The un-coded values for factors A, B and C and the random design of Box–Behnken can be seen in .
Table 2. Randomized design table for Box–Behnken design for total 17 experiments (uncoded units for −, 0 and + for are 1, 3 and 5 for factor A, 0.5, 1.5 and 2.5% for factor B and 0.5, 1.0 and 1.5% for factor C).
Freeze drying of nanoparticles
Lyophilization plays an important role in assessing the stability of the SLNs. The SLN dispersions were frozen in aqueous cryoprotectant solution at −20 °C for about 24 h and then the samples were transferred to the freeze-dryer (Christ, Alpha 2-4 LD plus, Osterode, Germany) operated at −40 °C and pressure of 0.001bar for 72 h to obtain the SLN powders for further experiments. One percent cryoprotectant, mannitol was added along with the formulation which protect the intactness of particles in injectable products.
Characterization of nanoparticles
Fourier transform infrared spectroscopy (FTIR) studies
Infrared spectra matching approach was used for detection of any possible chemical interaction between the drug, lipid and surfactants. A physical mixture of drug and lipid was prepared and mixed with a suitable quantity of potassium bromide (KBr). This mixture was compressed to form a transparent pellet using a hydraulic press at 15 tons pressure. It was scanned from 4000 to 400 cm−1 in an FTIR spectrophotometer (FTIR 8400S, Shimadzu, Marol Andheri, India). The IR spectrum of the physical mixture was compared with those of pure drug, lipid and peak matching was done to detect any appearance or disappearance of peaks. The FTIR studies were also done for immuno-nanoparticles for their preliminary confirmation of attachment of the antibody to the nanoparticles.
Differential scanning calorimetry (DSC) (Jain et al. Citation2010)
The amorphous of OP in SLN were studied using a Thermal Analysis System TA-60WS (Shimadzu Co., Ltd.) in order to evaluate lipid crystallinity. An empty pan was used as a reference; samples were analyzed in standard aluminum sample pans under a nitrogen purge. A heating rate of 10 °C/min was employed in the 30–300 °C temperature range. Thermograms were obtained for OP, stearic acid, a physical mixture of OP and stearic acid and OP-SLNs (lipid melts).
X-ray diffraction (XRD) (Jain et al. Citation2010)
Molecular arrangements of drug OP in SLNs were performed on an X-ray diffractometer (PANalytical X'pert PRO; Lelyweg, Almelo, The Netherlands) using CuKα radiation. Data has been obtained from a range of 3–50° 2θ in continuous mode using a step size of 0.02 degree 2θ and a step time of 5 s. Diffractograms were obtained for OP, stearic acid, a physical mixture of OP and stearic acid and OP-SLNs.
PS and zeta potential analysis
The mean PS was determined by dynamic light scattering (DLS) with a NicompTM 380 (Precision System Science Co., Ltd., Livermore, CA). The zeta potential (ξ) was determined using Malvern Zetasizer. All samples were diluted with double distilled water to a suitable scattering intensity prior to the measurements. PS and zeta potential were obtained for different batches (OPSLN1, OPSLN2, OPSLN3 and OPSLN4) formulated using various ratios of lipid.
Drug content and EE (Muller et al. Citation2000)
Nanoparticles (20 mg) after freeze drying were added to their specific solvent (10 ml) to facilitate the coat of the nanoparticles to get dissolved. The suspension formed was subjected to evaporation causing removal of the solvent prior to filtration. Then, the residue was washed and diluted appropriately with phosphate buffer of pH 6.8 to determine drug content and EE. Samples were measured at an absorbance of 264 nm in double beam UV spectrophotometer. Drug content loading and EE of OP in nanoparticles were determined by the following equations:
Scanning electron microscopy (SEM) (Mohideen et al. Citation2013)
Scanning electron microscopy (SEM) was used to verify the uniformity of particle shape and size. Freeze-dried nanoparticles were re-suspended in distilled water and were later dropped onto a silicon grid and dried under room temperature. The nanoparticle suspension was vacuum coated with gold for 3 min. The surface morphology of the samples was observed under an SEM (JEOL, Welwyn garden city, United Kingdom) operated at 15-keV pulse at different resolutions.
Statistical analysis
Statistical analysis was performed for different formulae by applying the one-way analysis of variance (ANOVA) test. The differences were considered statistical significant based on the P value whether it is equal or less than 0.05.
In vitro release study
Dialysis test was performed for in vitro release studies. Phosphate buffer solution of pH 7.4 and acetate buffer of pH 4.5 were used (Kurd et al. Citation2015). One hundred milliliters was poured into a closed glass vessel as the dissolution medium. The total volume of 5 ml of SLN was applied to a dialysis bag (molecular weight cut-off 3000–6000 kDa) and placed into the glass vessel. Incubator shaker was used to shake the samples horizontally at 37 °C and 100 rpm. One millimeter of the sample was taken which was replaced with fresh buffer at definite time intervals and filtered through a 0.22 μm filter membrane. The filtrate was measured using high-performance liquid chromatography (HPLC). The samples were taken at various time intervals till 48 h in order to evaluate its sustained release property. The experiments were performed in triplicates so as to minimize the error.
Based on the results of the in vitro release studies of the SLNs, the best formulation was optimized and was further used for the remaining studies. The optimized formulation was cross-linked with the antibody for the formation of immuno-nanoparticles.
Formulation of immuno-nanoparticles
In order to retain the drug properties, it was not conjugated with the antibody directly. As the SLNs were formulated using stearic acid (containing free carboxylic group) as the lipid, it allows it to conjugate with the cross-linker. The method followed for the formulation of immuno-nanoparticles is covalent conjugation.
Covalent conjugation
EDC is the cross-linker which was selected for the conjugation process (Kocbek et al. Citation2007). The main rationale behind selecting EDC as the cross-linker, as it is a zero space cross-linker containing zero functional groups. Also, it can react with the carboxylic group to form highly reactive o-acylisourea intermediate followed by its reaction with primary amines to form an amide. Use of EDC also eliminates the use of an organic solvent as it can be added directly to the mixture of nanoparticles and antibody, which can be attributed to its high water solubility (Hermanson Citation2013). 7.5 μg of EDC was added to 500 μl of a mixture of 450 μg nanoparticles and 450 μg TRAIL mAb. The molar ratio of EDC to mAb was approximately 8. The molar ratio was optimized by using various ratio of the cross-linker and the antibody. Upon addition of cross-linker to the mixture, it was subjected for stirring at room temperature for 2 h. Then, centrifugation was done at 10,000 rpm in order to remove the excess cross-linker. Sediment settled was washed five times with phosphate buffer.
After conjugating with the antibody, determination of the surface properties of the immuno-nanoparticles for conforming its attachment and its internalizing capacity.
Characterization of immuno-nanoparticles
Determination of mAbs on the surface of the prepared nanoparticles
Detection of mAbs on the surface of the prepared nanoparticles was performed according to the method reported previously (Kocbek et al. Citation2007). A secondary antibody, FITC-labeled goat anti-mouse IgG was used to identify the presence of mAb on the surface of nanoparticles. 0.5 μl of secondary antibody was made to react with immuno-nanoparticle at room temperature for 2 h. The volume ratio between dispersion of immuno-nanoparticles and solution of antibody is 1000:1. Samples were centrifuged at 10,000 rpm for 30 min and washed twice with 1 ml phosphate buffer in order to eliminate unbound secondary antibody, which was considered to be excess. After thorough washing, the sediment was re-dispersed in PBS at pH 7.2. The fluorescence intensity of fluorescein (494 nm) and TRAIL (540) was measured using microplate reader (Safire2™ Tecan, Männedorf, Switzerland).
FTIR studies
FTIR studies were performed for the prepared immuno SLNs using FTIR spectrophotometer (FTIR 8400S, Shimadzu) from 4000 to 400 cm−1. KBr mixture preparation of the sample was followed as above mentioned for the SLNs. The IR spectrum of the immuno-nanoparticles was compared with those of unconjugated SLNs and peak matching was done to detect any appearance or disappearance of peaks.
PS, zeta potential, EE and drug loading
Procedures for evaluation of PS, zeta potential, EE and drug loading were done for OP immuno-nanoparticles in the same manner as for unconjugated nanoparticles which were mentioned above. Every evaluation of these parameters has its own importance, as the PS of the immuno-nanoparticles has to below 200 nm range, in order to prevent its escape by the reticuloendothelial system (RES). Also, any change in the zeta potential by attachment of antibody can be observed by zeta potential evaluation. Any changes in the drug EE and drug loading after attachment of antibody was evaluated for the immuno-nanoparticles using HPLC comparable to unconjugated nanoparticles.
In vitro drug release
Dialysis test was performed for in vitro release studies. Phosphate buffer solution of pH 7.4 and acetate buffer of pH 4.5 were used. One hundred milliliters was poured into a closed glass vessel as the dissolution medium. The total volume of 5 ml of immuno SLNs (TR-OP-SLN) was applied to a dialysis bag and placed into the glass vessel. Incubator shaker was used to shake the samples horizontally at 37 °C and 100 rpm. One millimeter of the sample was taken which was replaced with fresh buffer at definite time intervals and filtered through a 0.22 μm filter membrane. The filtrate was measured using HPLC. The samples were taken at various time intervals till 48 h in order to evaluate its sustained release property. The experiments were performed in triplicates so as to minimize the error.
The reason behind selecting pH 4.5 and 7.4 is to evaluate the drug release inside the tumor and outside the tumor. As immuno-nanoparticles are mainly formulated for active targeting approach and site specificity, drug should be released inside the tumor (pH 4.5) rather than outside (pH 7.4). Hence, the drug release conforms the ability of the formulated immuno-nanoparticles in releasing the drug at the targeted site.
Protein assay (Kocbek et al. Citation2007)
The aim of the protein assay is to quantify the amount of mAb bound to nanoparticles. The Bradford method with Coomassie dye, which was reported earlier, was followed. mAb-coated or non-coated nanoparticle dispersion of 10 μl was taken and to that dye reagent of 300 μl was added and left for 15 min of incubation time. The absorbance was measured at 540 nm using a microplate reader (Tecan GENios). The results obtained were interpreted by comparing it to standard curve of bovine serum albumin (BSA) at different concentrations. The controls were taken where nanoparticles with coating of EDC and without EDC and TRAIL. Once the presence of the nanoparticle is confirmed, the immuno-nanoparticles are evaluated for their cellular uptake and internalization studies.
In vitro cytotoxicity assay
MTT (3-(4,5-dimethylthiazol-2-yl)-2,5-diphenyltetrazolium bromide) assay was performed for OP immuno-nanoparticles, unconjugated nanoparticles and pure OP. HT-29 cells were seeded onto a 96-well plate at a seeding density of 1 × 10⁴ cells/well. It was then left overnight with incubation for attachment of cells to the plate. In each well, the culture medium was replaced with 100 μl of medium with serial dilutions of the samples (mentioned above) for treatment. All the treatment samples were given with concentration of 1–20 μg/ml and were left for 48 h. Ten microliter of MTT (5 mg/ml in phosphate buffer saline) was added at particular time intervals, which was followed by incubation for 4 h and removal of the culture solution. One hundred microliter of dimethy sulfoxide (DMSO) was then added to each of the well separately in order to dissolve the formazan crystals while shaking the plates vigorously. Then, the absorbance was determined for each well on a microplate reader (Thermo Scientific, Pittsburgh, PA) at a wavelength of 570 nm. The experiment was conducted in triplicate in parallel. IC50 is the concentration that can inhibit 50% of cell growth was calculated by SPSS version 19.0 software (SPSS, Chicago, IL). Along with that relative cell viability was calculated for different concentrations for all the samples, which was compared to the untreated control.
Results and discussion
FTIR studies
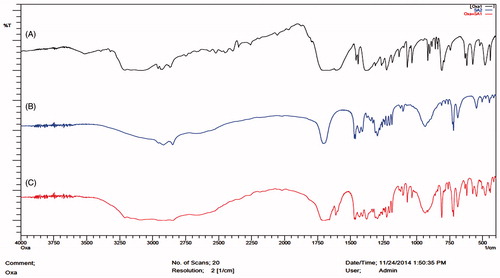
The FTIR analysis was performed for the pure drug OP, lipid stearic acid, physical mixture of drug and lipid and also for lipid melts which can be observed in . The main reason for taking the lipid melts is due to the melting of the lipid during the microemulsion method so as to determine the interaction. FTIR studies helps to determine the compatibility between the drug and the lipid in the initial phases and also after formulation. FTIR spectra of OP has shown –NH peak at 3507.67 cm−1 and C = O at 1711.88 cm−1. The shift in the peaks was observed when the drug was taken as a physical mixture and lipid melts. Stearic acid has shown C = O peak at 1699.34 cm−1 and –CH at 2917.43 cm−1. Shift of the –NH stretch from 3507.67 to 3581.23 cm−1 for physical mixture and 3595.11 cm−1 for lipid melts was observed. Shift of the C = O stretching from 1711 cm−1 to 1721 cm−1 in the physical mixture and 1713 cm−1 in case of lipid melts confirms the drug compatibility with the lipid both in the physical mixture and also with the drug lipid melts. The magnitude of the peak stretching also plays an important role in determining the interaction of the drug with the lipid, as significant stretching is observed both in the case of –NH and C = O pushing the selection of stearic acid as the lipid. Also, the shift indicates the positive interaction of the drug with lipid, which also helps in improving the drug entrapment as well as preventing the drug expulsion upon addition to the lipid during microemulsion method.
Figure 2. FTIR spectra of: (A) oxaliplatin, (B) stearic acid and (C) physical mixture of oxaliplatin and stearic acid.
DSC studies
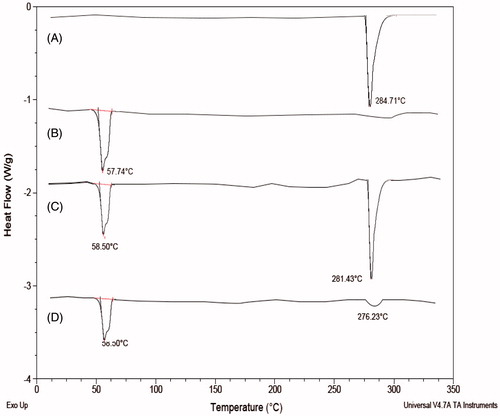
Differential scanning calorimetry (DSC) studies were performed for the drug, physical mixture of the drug, lipid and as well as drug lipid melt which are shown in . DSC thermogram of OP has shown a peak at 281.43 °C and enthalpy of 328.3 J/g. DSC thermogram of stearic acid has shown a peak at 58.50 °C and an enthalpy of 168.1 J/g. Physical mixture of drug and lipid has shown a peak at 284.71 °C corresponding to OP and 57.74 °C corresponding to stearic acid. Drug lipid melts thermograms has shown a peak at 58.21 °C corresponding to the stearic acid, but the peak at 280 °C was found decreased attributing to the fact that drug may get entrapped into the lipid nanoparticle. Also, the change in enthalpy for both the physical mixture and the drug lipid melts was observed and found it was more in the case of drug lipid melts when compared to the physical mixture. This attributes to the conclusion that use of the stearic acid as a lipid also helps in more drug incorporation because of the formation of more imperfections on melting of the stearic acid. Also, the decrease in the height of the peak in the drug lipid melts is due to the lipid. Moreover, it also helps in confirming the stability, as compatibility of the drug and the lipid helps in imparting stability to the prepared formulation.
Figure 3. Overlaid DSC diffractogram of: (A) oxaliplatin, (B) stearic acid, (C) physical mixture of oxaliplatin and stearic acid and (D) oxaliplatin solid lipid nanoparticles.
XRD studies
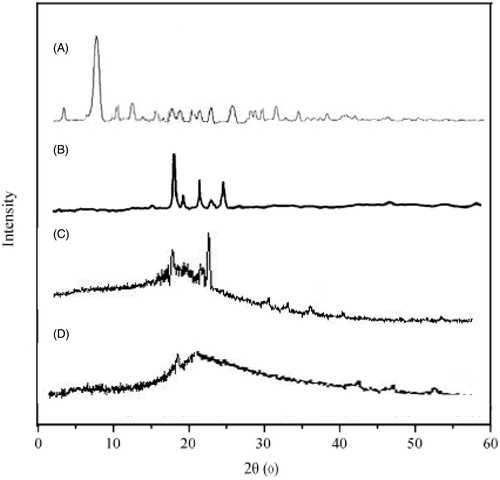
An XRD peak mainly depends on the crystal size as they indicate the crystalline nature at particular value at 2θ range. In this study, API OP had shown a sharp single peak and the highest one at 2θ equals 7.5° that indicates its crystalline nature. Lipid stearic acid has shown peaks at 21.8° with various minor peaks at 23°, 24° and 10°, which can be seen in . The diffractograms of stearic acid was found to be different from the OP SLNs, as we noticed a little decrease in the intensity of the peak which can be attributed to the lower level of detection of the encapsulated drug as it was dispersed in molecular level and moreover the slight disappearance of the OP peak indicates the entrapment of drug inside the stearic acid and also indicates the amorphous state of the OP. Hence, by this study, it has concluded the chances of entrapment of the drug and also its transition to amorphous state.
Figure 4. Overlaid XRD diffractograms of: (A) oxaliplatin, (B) stearic acid, (C) physical mixture of oxaliplatin and stearic acid and (D) oxaliplatin solid lipid nanoparticles.
Microemulsion method
The microemulsion method was selected as it evades the use of organic solvent, which improper removal may cause toxicity. In this microemulsion method, design of experimentation was done using Minitab 16 using Box–Behnken design. The results were also screened by using Minitab there by obtaining contour plots, surface plots and interactions plot. Different drug:lipid ratios as 1:1, 1:2, 1:3 and 1:4 were chosen to determine the effect of the lipid on the formulation parameters such as PS, EE, drug loading. Surfactant plays an major role in imparting the stability to the SLNs, so soya lecithin in different ratios (0.5%, 1%, 1.5% and 2%) were chosen and was optimized based on the various evaluation parameters. 1.5% w/v of soya lecithin was optimized which enables us to use the same for different ratios of lipid. The reason behind opting for the 1.5% w/v of soya lecithin as the drug is hydrophilic, it needs to be incorporated inside the lipid and the optimum amount of surfactant reduces the surface tension along with providing the stability to the formulation. Pluronic F68 was used as co-surfactant, which enhances the surfactant property there by helping the formulation stability. By optimizing the concentration of the surfactant and co-surfactant, we can keep them constant and optimized by the batch for different ratios of lipid.
PS and zeta potential
The mean PS of OP-SLNs was found to be smaller than 188 nm. So the nanoparticles size range was found to be satisfactory and was according to the specifications. PS plays an important role in the optimization process as increase in the PS more than 200 nm causes it to be recognized by RES and can be eliminated. So lesser the PS, more beneficial it was. The formulation with lower PS should be selected as PS gets increased once it was conjugated to the antibody. The PS evaluation was performed in triplicates to minimize the error and also to ensure the reproducibility. Also, system has shown relatively narrow size distribution that can be attributed to their lower PDI values (<0.2). Zeta potential was found to be in the limit supporting the rationale of preparing stable nanoparticles that can be easily dispersible and in turn enhancing solubility. Negative zeta potential was observed which could be attributed to the negative surface charge of the surfactant soya lecithin used rather than stearic acid, which is a neutral lipid. So zeta potential remains almost the same with the increase of the lipid, as we kept concentration of surfactant as constant further confirming the effect soya lecithin has on the zeta potential. The PSs were shown for drug:lipid in . The PSs were found satisfactory for OPSLN1, OPSLN2 and OPSLN3, which were 141 ± 0.23 nm, 152 ± 0.12 nm and 121 ± 1.22 nm, respectively. OPSLN4 has shown a PS closer to 180 nm and was found to be unsatisfactory, as it shows an increase in the PS after binding to the antibody, which enhances its non-applicability in this study. Further, the formulations with different ratios will be optimized based on their EE and drug loading. PS and zeta potential by DLS method and Malvern Zetasizer was shown in ).
Figure 5. (A) Size distribution by the intensity of oxaliplatin solid lipid nanoparticles by DLS. (B) Zeta potential of oxaliplatin solid lipid nanoparticles by Malvern Zetasizer.
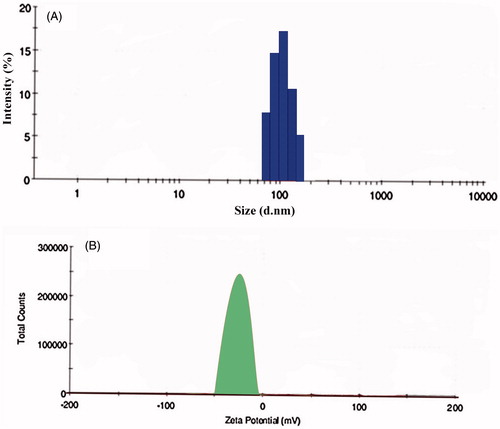
Table 3. Particle size, zeta potential and PDI values of the various composition of solid lipid nanoparticles.
Drug loading and EE studies
The reason behind selecting the SLNs is their ability to get penetrated easily into the tumor as they contain an outer lipophilic surface and their ability to incorporate both hydrophilic and lipophilic drugs. There are reported literatures regarding the inability of SLNs to have satisfactory drug loading. But, in contrary, we have achieved drug-loading percentage of up to 32%, which was found to be more than satisfactory. EE (78 ± 0.09%) and drug loading (32 ± 1.01%) was found to be higher for OPSLN3 with a drug:lipid ratio of 1:3. EE and drug loading was found to be increased with the increase in the ratio of the lipids till the ratio of 1:3 which may be attributed to the use of surfactant helping in its incorporation. Beyond that the drug loading and EE was decreased for drug:lipid ratio of 1:4 (20 ± 0.17% and 54 ± 1.27%, respectively) that can be attributed to the fact that may have formed a more compact coat outside the nanoparticles. The PSs of OPSLN1, OPSLN2 and OPSLN3 was found to be satisfactory but only OPSLN3 showed proper EE and drug loading when compared to others. So the OPSLN3 formulation was optimized, as improper entrapment leads to some part of the drug outside the coat leading to burst release and also leads to lower intended therapeutic effect. The EE and drug loading of SLNs of drug:lipid ratios were shown in . Also, the use of the surfactant soya lecithin may have increased the capacity of the drug loading and also forms a sufficient covering to the lipid and prevents its escape along with imparting stability. Surfactant concentration was optimized at ratio of 1.5% w/w and that was used for all the formulations with different lipid ratios keeping drug as constant. So, the optimized formulation OPSLN3 was used for further SEM studies, in vitro and also for formulation of immuno-nanoparticles. The reason behind optimizing the particular formulation was explained thoroughly in the optimization using Box–Behnken design later.
Table 4. Entrapment efficiencies and drug loading of various compositions of oxaliplatin solid lipid nanoparticles.
Positive drug-lipid interactions observed during the FTIR studies supports the enhancement in drug loading by preventing the drug from expulsion, when the hot microemulsion was poured into the cold water for preparing SLNs by microemulsion method. Observation of DSC thermograms and XRD diffractograms helps us to find one more attribute to the improvement of drug loading and EE as we found a decrease in crystallinity of the drug-lipid formulation when compared alone with the drug which can be seen in . Once the drug starts losing its crystallinity there by generating imperfections with spaces that can accommodate the drug helps in improving drug loading.
Optimization using Box–Behnken design
The effect of the formulation variables on PS and EE was carried by a total of 17 experiments with five center points. Response y1 (PS) and response y2 (EE) was observed within a range of 109.2–195.8 nm and 20–78%, respectively. The ratio of maximum to a minimum for response y1 is 1.91 and 3.9, respectively, so the transformation of values is not considered. The above statement can be further strengthened by the fact that power transformation is required when the ratio of maximum to minimum response is more than 10, where as if it is less than 3 it shows a little effect.
Interaction plots were obtained to study the effect of one factor on the other. In the interaction plots for response y1 (PS) and response y2 (EE), we observed steep difference in slope for lipid at ratio of 3 (indicated by red line) and surfactant at 1.5% which shows their higher interaction effect on the responses which was shown in ).
Figure 6. Interaction plot of response (A) y1(PS) for factor A and B and (B) y2(EE) for factor A and B. Contour plot of response (C) y1(PS) for factor A and B and (D) y2(EE) for factor A and B.
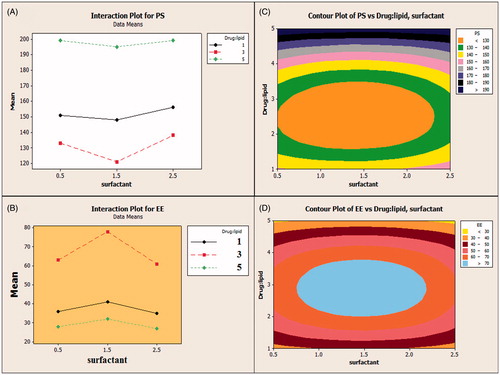
The relationship between variables was further studied using contour plots which are shown in ). Contour plots further elaborate the relationship between variables and shows the effect of the factors on response y1 and y2. It can be evident from the plot that EE of the nanoparticles increases with increase in the drug:lipid ratio until 3 and later on keep on decreasing. At a higher ratio of the lipid, EE was decreased due to the formation of thicker lipid coat preventing the drug entrapment. Also, EE was observed to be higher at surfactant soya lecithin 1.5%, as it was concluded as the desired concentration to permit required surface tension. A co-surfactant factor was considered negligible as it showed no effect on the formulation. PS (y1) followed the same path for the formulation variables as for the EE (y2), as an increase in the concentration of the lipid till ratio (1:3) showed a decrease in the PS and later on kept increasing till 199 nm. Also, the surfactant concentration of 1.5% was found to be optimized for appreciable PS.
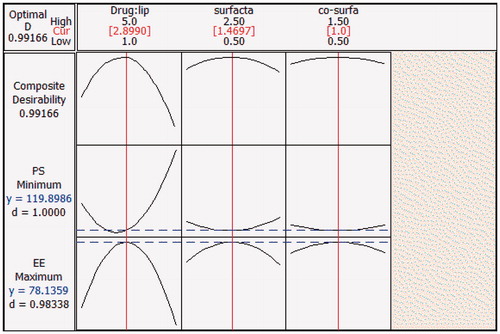
Finally optimization plot of SLN was obtained, which shows y1 (PS) and y2 (EE) in the range of 119–199 nm and 27.25–78.13%, respectively followed by optimized minimum as 119.89 nm at lipid ratio as 2.9 and surfactant as 1.46% for both which can be seen in . The above-mentioned optimized value denotes the predicted values; the actual values noted was 121 nm for PS and 78% for EE which were in close agreement to the predicted values. In the optimization plot, the red line refers to the current factor level settings denoted by values on the top and the blue lines in the plot refers to responses for the current factor level which can be seen on the left side of the plot. Optimization plot shows the composite desirability (D) value of 0.99166, which indicates the settings seems to achieve favorable results for all responses as a whole as the value is close to 1. Individual desirability (d) in the plot optimizes the settings for a single response. d value in the plot for PS and EE was found to be 1.0 and 0.9833 respectively, which are close to 1 achieved a proper result for individual responses.
Figure 7. Optimization plot for Box–Behnken design showing optimal values. The red color line indicates the current factor settings and the blue color line indicates the response to the current settings. Composite desirability value (D) near to 1 indicates the settings seem to achieve favorable responses for all responses and individual desirability value (d) indicates the value close to 1 there by optimizing the settings for each individual response. The middle values on the top represent the current settings that are optimized.
ANOVA of the data confirms the significant formulation factors affecting the responses. For PS and EE, drug:lipid ratio and surfactant were considered as significant terms as they showed p < 0.01 and co-surfactant was termed to be non-significant as it showed a p > 0.05. The final regression equation for y1(PS) shows that positive coefficient of drug:lipid and surfactant indicate that increase in the factor increases the PS and negative coefficient value of co-surfactant indicates that PS decreases with increase in its concentration. Final regression equation of y2 (EE) shows that positive coefficient of drug:lipid indicates that increase in the factor increases the EE and negative coefficient value of surfactant and co-surfactant indicates that EE decreases with increase in its concentration.
Final regression equation in terms of coded factors for response y1 (PS) and y2 (EE) are:
Scanning electron microscopy
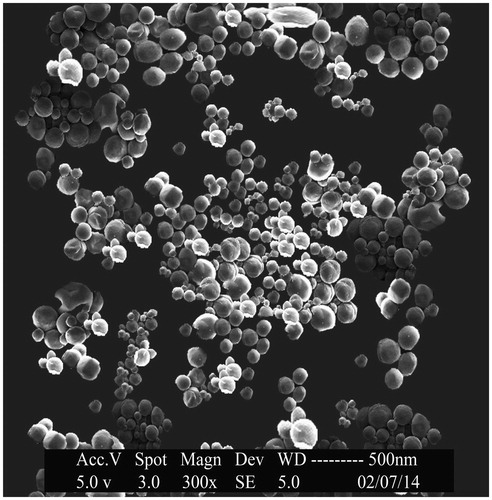
SEM was performed for SLNs with the drug:lipid ratio of 1:3 (OPSLN3) to obtain more information on surface morphology. The photos of OP-SLNs had shown that they were of spherical shape with a size range from 102 to 139 nm that can be seen in . The smooth surface of the nanoparticles observed helped us to conclude the fact that sustained release of the drug can be achieved as opposed to the nanoparticles having a rough surface.
Figure 8. SEM image of oxaliplatin solid lipid nanoparticles.
In vitro release studies
In vitro release studies of the release of OP from the OPSLN3 showed a biphasic pattern with initial burst release followed by sustained release at pH 4.5. The sustained release of the SLNs can be attributed to the smooth surface of the nanoparticles along with the release of the drug from the lipid core. The initial burst release can be attributed to the unentrapped drug present with the nanoparticles and also the drug that was absorbed followed it on the surface of the nanoparticles rather than inside the lipid. Drug release was found to be 65 ± 0.01% and 22 ± 0.21% within 24 h for pH 4.5 and 7.4, respectively, which is far more satisfactory as we developed this formulation for targeting rather than sustaining its release and shown in . Sustained release of the drug also acts as an added benefit to the formulation, which helps in decreasing the dosage frequency. The presence of amine functional groups in OP promotes the release of drug in acetate buffer. Once it enters the acidic pH it gets protonated, so it causes increase in solubility there by enhancing its drug release. This conforms to our rationale, as pH inside the tumor is acidic, so we can conclude the efficient release of the drug inside the tumors rather than outside.
Figure 9. In vitro cumulative drug release of OP-SLN3 at pH 4.5 and 7.4 till 24 h.
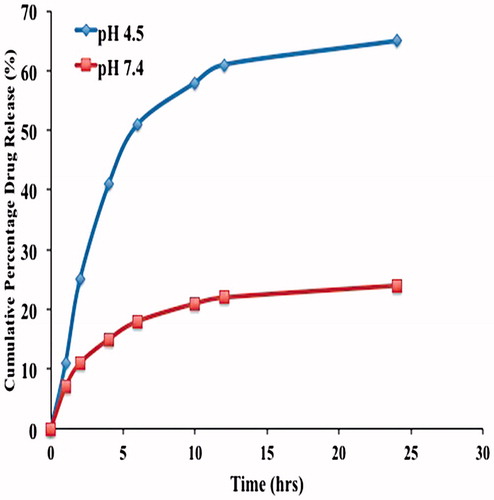
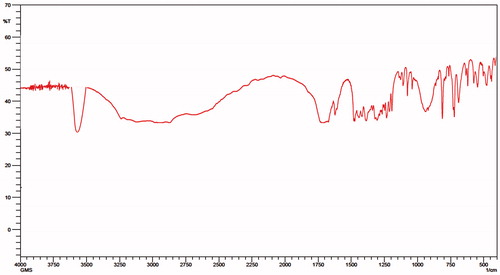
Figure 10. FTIR spectra of oxaliplatin immuno-nanoparticles (TR-OP-SLN3).
Immuno-nanoparticles characterization
Determination of mAb on the nanoparticle surface
The antibody was covalently linked to the SLNs, an FITC-labeled goat anti-mouse IgG coupling to the anti-TRAIL antibody was performed in order to observe the increase in the fluorescence intensity of the immuno-nanoparticles when compared to the unconjugated nanoparticles. The values can be seen in . Upon observation of the fluorescence intensity, it was clear that the immuno-nanoparticles have shown a vast increase in the intensity comparable to the unconjugated nanoparticles and secondary antibody. This further proves the conjugation of the TRAIL antibody to the OP-SLNs.
Table 5. Fluorescence intensity values of immunoglobulin and nanoparticles.
FTIR studies
FTIR studies were performed as a preliminary test to identify the antibody binding to the nanoparticles, which can be confirmed by the presence of amide bonding. As we mentioned earlier that the covalent conjugation was done leading to the amine conjugation, it was confirmed by the amine stretching at 3500 cm−1 along with retaining of other groups. It can be clearly seen in . A slight change in the peak shifts of OP was observed which can be attributed to its encapsulation. Amide bond formation was also confirmed by the presence of a peak at 1651 cm−1, which was formed by the linkage of lipid nanoparticles intermediate with the antibody. So this conforms the attachment of antibody along with fluorescence intensity enhancing its feasibility and applicability in formulation approach.
PS, EE, zeta potential of immuno-nanoparticles
The PS plays an important role in the immuno-nanoparticles as it determines the toxicity, biodistribution and targeting properties of the nanoparticles. OPSLN3 was formulated into immuno-nanoparticles by covalent conjugation method described previously. The PS was found to be 183 ± 0.19 nm, which was found to be beneficiary as preparations with PS less than 200 nm can escape elimination by RES in the body. The pore size in tumor vasculature varies between 100 and 780 nm (Steinhauser et al. Citation2006). PS of below 400 nm for the nanoparticles was recommended based on the previous studies conducted (Hobbs et al. Citation1998). Comparable to that, immuno-nanoparticles achieved a satisfactory PS conforming to its easy penetrability into the tumor tissue along with escaping by RES. The reason for the larger size of immuno-nanoparticles when compared to the SLNs can be attributed to the conjugation and several steps of freeze drying and centrifugation during the preparation process (Ishida et al. Citation1999). PS and zeta potential of TR-OP-SLN3 can be observed in and .
Figure 11. Size distribution by the intensity of TR-OP-SLN3 by DLS.
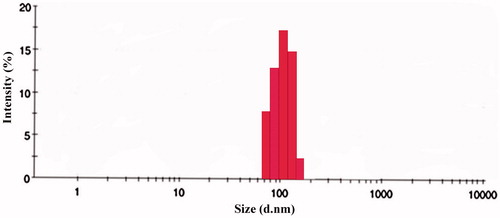
Figure 12. Zeta potential of TR-OP-SLN3 by Malvern Zetasizer.
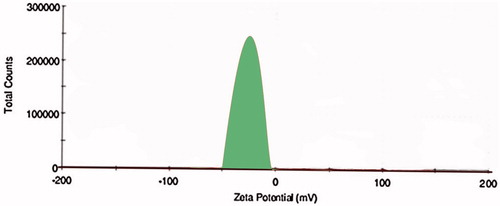
EE and drug loading of the immuno-nanoparticles was found to be 62 ± 0.91% and 26 ± 0.01%, respectively compared to the 81 ± 0.02% and 32 ± 0.41% of SLNs without antibody which can be seen in . The decrease in the EE and drug loading of the immuno-nanoparticles may be attributed to the conjugation of the nanoparticles to the antibody, as covalent conjugation leads to the formation of the intact complex there by decreasing the EE and drug loading. Zeta potential of the immuno-nanoparticles was observed to be with higher negative charge (−15 ± 0.03 mV) than that of the SLNs which shows a less negative charge (−21 ± 0.09 mV) that can be attributed to the fact that the attachment of antibody imparts more negative charge to the prepared nanoparticles there by increasing its negative charge.
Table 6. Particle size, zeta potential, entrapment efficiency and drug loading values of oxaliplatin immuno-nanoparticles.
In vitro drug release of immuno-nanoparticles
The drug release from the immuno-nanoparticles (TR-OP-SLN) were observed at pH 4.5 and 7.4. As it was with the SLNs without antibody, it has shown a biphasic pattern of drug release with an initial burst release attributed to the unentrapped drug and the drug absorbed on the surface. Initial burst phase was followed by much slower release for next 24 h conforming to the sustained release property of the drug entrapped inside the lipid rather than absorbed outside. The reason behind opting for different pH is due to the fact that drug passes inside the tumors by receptor-mediated endocytosis mainly by releasing the drug in early endosomes or secondary endosomes by pH controlled hydrolysis. Endosomes have pH in the range from 5 to 7.2, whereas lysosomes ranges from pH 4–5 (Maya et al. Citation2013, Ulbrich and Subr Citation2004). An extracellular layer having pH close to basic causes limited swelling which inhibits the sudden diffusion of the drug from the nanoparticles. As the drug reaches inside the intracellular area of tumor tissues where pH is 4.5, this acidic nature permits more swelling due to the protonation of amine groups there by developing the repulsive force causing the drug to get ejected outside at an improved rate from the lipid (Prabaharan et al. Citation2007). But there is a minute decrease in the drug release observed in immuno-nanoparticles when compared to the OP-SLN 3, which can be due to the more highly conjugated complex matrix around the drug with the presence of TRAIL antibody as opposed to the control. The cumulative drug release was found to be about 60 ± 0.01% at the end of 24 h and 81 ± 0.02% at the end of 48 h at pH 4.5. The cumulative drug release at pH 7.4 was found to be 14 ± 0.13% and 27 ± 0.07% at the end of 24 h and 48 h, respectively. This can be observed in .
Figure 13. In vitro cumulative drug release of TR-OP-SLN3 at pH 4.5 and 7.4 till 48 h.
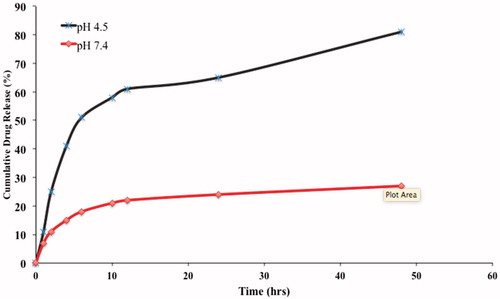
So, here by, we can conclude from the in vitro drug release studies that the immuno-nanoparticles released at a constant and sufficient rate at acidic pH rather than basic pH, which elevates the fact that drug release may occur inside the tumor tissues by receptor-mediated endocytosis.
Protein assay
A protein assay was performed in order to quantify the covalently bound amount of mAb to the nanoparticle surface. This was mainly useful in case of covalent conjugation as it is important to determine the covalently bound antibody contrary to the absorbed antibody in case of absorption on to the surface. According to our observation, it has shown to be approximately 53.2 μg protein per 100 mg of nanoparticles. The amount of protein bound was calculated with the help of standard calibration curve done by BSA. Three samples, one with protein as control, immuno-nanoparticles with EDC and the other without EDC. The protein content was found to be higher (52%) in the presence of the EDC compared to the (6%) in the absence of EDC and TRAIL. So, by this Bradford method, we can further confirm the presence of the antibody on the surface of the nanoparticles along with quantification of the amount present.
In vitro cytotoxicity effect of immuno-nanoparticles
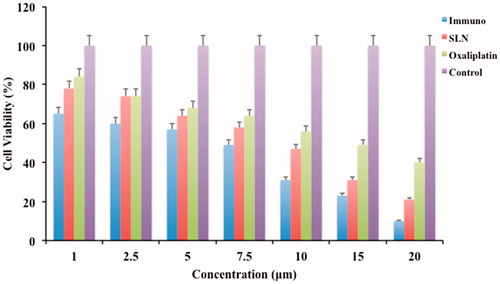
HT-29 cell lines were selected in order to evaluate the cell toxicity activity of formulated immuno-nanoparticles, nanoparticles, OP and untreated control. These can be observed in . Immuno-nanoparticles have shown a considerable decrease in the amount of cell viability when compared to the free OP. Unconjugated solid lipid nanoparticles (OP-SLN 3) also shown a decrease in the amount of cell viability closer to TR-OP-SLN. The reason attributed to the decrease in the amount of cell viability of both conjugated and unconjugated nanoparticles are may be due to the better uptake of cells by endocytosis. In case of immuno-nanoparticles as HT-29 cells were specific for the particular antigen, it helps more in internalization of the drug by receptor-mediated endocytosis. A 1.5-fold increase in cytotoxicity of immuno-nanoparticles (at 7.5 μm) showed nearly 50% cell viability at the end of 48 h. The decrease in cell viability of TR-OP-SLN, OP-SLN 3 and OP at the end of 48 h when given in the concentration range of 1–20 μg/ml was found to be 65–10%, 78–21% and 84–40%, respectively. So, we can conclude the predominance in the cytotoxic activity of the immuno-nanoparticles when compared with others (p < 0.05). IC50 value (4.6 μm) of immuno-nanoparticles has shown eight times decrease in IC50 value when compared to OP. 4.6 μm of immuno-nanoparticles is equivalent to 1.3 μm of OP that was well below the IC50 value of a pure drug that highlights its enhanced anti-cancer activity. Also, the increased cytotoxicity of immuno-nanoparticles compared to the OP-SLN 3 shows the synergistic activity of immuno-nanoparticles with preferential receptor-mediated targeting. This concludes site specificity along with synergistic apoptotic activity attributed to the individual apoptotic pathways of TRAIL-mediated death receptor activation and OP general cytotoxic activity as it is a potent inhibitor of survivin (generally, a downstream protein of apoptotic pathways).
Figure 14. Cell viability plot of HT-29 cells by MTT assay after 24 h incubation with immuno-nanoparticles, unconjugated nanoparticles and pure drug.
Conclusion
OP immuno SLNs (TR-OP-SLN) were formulated by covalent conjugation of nanoparticles (OP-SLN 3) with TRAIL antibody having the site specificity ability attributed to the recognition of specific antigens on the colorectal cancer cell lines. Site specificity of the immuno-nanoparticles helps in reducing the side effects to healthy cells, which may benefit cancer patients in a big way. Immuno-nanoparticles formulated were successfully characterized for their attachment with an antibody, particles size, EE and found to be in the appreciable range which paves the way for their drug release studies. Immuno-nanoparticles were optimized by Box–Behnken design for response y1(PS) and response y2(EE) as dependent variables. This method optimizes the proper effect of formulation variables on the responses by optimization plot denoting the effect of current factor settings on the responses by D and d value. ANOVA further confirmed their significance by p value. As the immuno-nanoparticles were designed to be released inside the tumor rather in systemic circulation attributed to their active targeting, cumulative drug release inside the tumor was found to be more than appreciable with 60 ± 0.01% at the end of 24 h and 81 ± 0.02% at the end of 48 h at pH 4.5 along with sustained release. Immuno-nanoparticles were evaluated successfully for their synergistic activity compared to the OP-SLN3 by cytotoxicity activity, which were 1.5-fold higher than the free OP. This conforms the successful attainment of synergistic activity for OP by TRAIL antibody along with its site-specific nature. This conforms the successful formulation and characterization of OP immuno-nanoparticles for successful binding to the antibody and enhanced drug release at the targeted area. This targeted immuno nano particulated approach can be useful to deliver various anti-cancer drugs to specific targets there by benefitting the society. So, we can conclude that nanoparticles prepared by this method using the same composition with the optimized ratio can represent as potential drug delivery approach for synergistic delivery of the API to the colorectal tumors with preferential receptor-mediated targeting.
Future studies
Evaluation of cell uptake and internalization studies along with the determination of apoptotic activity quantitatively and qualitatively. Also, biodistribution studies and protein expression studies have to be performed.
Acknowledgements
Dr. M. N. Satish Kumar, professor guided my study in all areas to achieve the desired results and to ensure that the study was carried out in a proper way. Dr. K. Gowthamarajan supported the study with his kind help during the formulation stage.
Declaration of interest
The authors report no conflicts of interest.
References
- Anari E, Akbarzadeh A, Zarghami N. 2015. Chrysin-loaded PLGA-PEG nanoparticles designed for enhanced effect on the breast cancer cell line. Artif Cells Nanomed Biotechnol. [Epub ahead of print]. doi:10.3109/21691401.2015.1029633.
- Cavalli R, Morela S, Gasco MR, Chetonib AP, Saettoneb MF. 1995. Preparation and evaluation in vitro of colloidal lipospheres containing pilocarpine as ion pair. Int J Pharm. 117:243–246.
- Ciftci K, Groves MJ. 1996. Delivery of antitumor compounds to the rat colon: in vitro and in vivo evaluation. Int J Pharm. 145:157–164.
- Cirstoiu-Hapca A., Buchegger F, Lange N, Bossy L, Gurny R, Delie F. 2010. Benefit of anti-HER2-coated paclitaxel-loaded immuno-nanoparticles in the treatment of disseminated ovarian cancer: therapeutic efficacy and biodistribution in mice. J Control Release. 144:324–331.
- Colotta F. 2008. Anticancer drug discovery and development. In: Colotta F and Mantovani A, Eds. Targeted Therapies in Cancer, Springer, pp. 19–42.
- Domb AJ. 1996. Lipospheres for controlled delivery of substances. Drugs Pharm Sci. 73:377–410.
- Feng SS. 2011. Chemotherapeutic engineering: concept, feasibility, safety and prospect – a tribute to Shu Chien’s 80th birthday. Cel Mol Bioeng. 4:708–716.
- Feng SS, Chien S. 2003. Chemotherapeutic engineering: application and further development of chemical engineering principles for chemotherapy of cancer and other diseases. Chem Eng Sci. 58:4087–4114.
- Feng SS, Zhao L, Zhang Z, Bhakta G, Win KY, Dong Y, Chien S. 2007. Chemotherapeutic engineering: vitamin E TPGS-emulsified nanoparticles of biodegradable polymers realized sustainable paclitaxel chemotherapy for 168h in vivo. Chem Eng Sci. 62:6641–6648.
- Hermanson GT. 2013. Bioconjugate Techniques. San Diego (CA): Academic Press.
- Hobbs SK, Monsky WL, Yuan F, Roberts WG, Griffith L, Torchilin VP, Jain RK. 1998. Regulation of transport pathways in tumor vessels: role of tumor type and microenvironment. Proc Natl Acad Sci USA. 95:4607–4612.
- Holoch PA, Griffith TS. 2009. TNF-related apoptosis-inducing ligand (TRAIL): a new path to anti-cancer therapies. Eur J Pharmacol. 625:63–72.
- Ishida O, Maruyama K, Sasaki K, Iwatsuru M. 1999. Size-dependent extravasation and interstitial localization of polyethyleneglycol liposomes in solid tumor-bearing mice. Int J Pharm. 190:49–56.
- Jain A, Gupta Y, Jain SK. 2007. Perspectives of biodegradable natural polysaccharides for site-specific drug delivery to the colon. J Pharm Pharm Sci. 10:86–128.
- Jain A, Jain SK, Ganesh N, Barve J, Beg AM. 2010. Design and development of ligand-appended polysaccharidic nanoparticles for the delivery of oxaliplatin in colorectal cancer. Nanomedicine. 6:179–190.
- Jain K, Sood S, Gowthamarajan K. 2014. Optimization of artemether-loaded NLC for intranasal delivery using central composite design. Drug Deliv. 22:940–954.
- Jia J, Zhu F, Ma X, Cao Z, Li Y, Chen YZ. 2009. Mechanisms of drug combinations: interaction and network perspectives. Nat Rev Drug Discov. 8:111–128.
- Kurd K, Khandagi AA, Davaran S, Akbarzadeh A. 2015. Cisplatin release from dual-responsive magnetic nanocomposites. Artif Cells Nanomed Biotechnol. [Epub ahead of print]. doi:10.3109/21691401.2015.1008513.
- Kocbek P, Obermajer N, Cegnar M, Kos J, Kristl J. 2007. Targeting cancer cells using PLGA nanoparticles surface modified with monoclonal antibody. J Control Release. 120:18–26.
- Krishnaiah Y, Satyanarayana S. 2001. Colon-specific drug delivery systems. In: Jain NK, Ed. Advances in Controlled and Novel Drug Delivery. New Delhi, India: CBS Publishers and Distributors, pp. 89–119.
- LeBlanc H, Ashkenazi A. 2003. Apo2L/TRAIL and its death and decoy receptors. Cell Death Differ. 10:66–75.
- Lehár J, Krueger AS, Avery W, Heilbut AM, Johansen LM, Price ER, et al. 2009. Synergistic drug combinations tend to improve therapeutically relevant selectivity. Nat Biotechnol. 27:659–666.
- Maleki Dizaj S, Lotfipour F, Barzegar-Jalali M, Zarrintan MH, Adibkia K. 2015. Application of Box–Behnken design to prepare gentaicin-loaded calcium carbonate nanoparticles. Artif Cells Nanomed Biotechnol. [Epub ahead of print]. doi:10.3109/21691401.2015.1042108.
- Maya S, Kumar LG, Sarmento B, Sanoj Rejinold N, Menon D, Nair SV, Jayakumar R. 2013. Cetuximab conjugated O-carboxymethyl chitosan nanoparticles for targeting EGFR overexpressing cancer cells. Carbohydr Polym. 93:661–669.
- Michor F, Iwasa Y, Lengauer C, Nowak MA. 2005. Dynamics of colorectal cancer. Semin Cancer Biol. 15:484–93.
- Mitsiades CS, Davies FE, Laubach JP, Joshua D, San Miguel J, Anderson KC, Richardson PG. 2011. Future directions of next-generation novel therapies, combination approaches, and the development of personalized medicine in myeloma. J Clin Oncol. 29:1916–1923.
- Mohideen B, Ezhilmuthu RP, Dhanalekshmi UM, Neelakanta Reddy P. 2013. Formulation and in-vitro characterization of gliclazide loaded polymeric nanoparticles. Int J Biol Pharm Res. 4:533–540.
- Muller RH, Mäder K, Gohla S. 2000. Solid lipid nanoparticles (SLN) for controlled drug delivery – a review of the state of the art. Eur J Pharm Biopharm. 50:161–177.
- Prabaharan M, Reis RL, Mano JF. 2007. Carboxymethyl chitosan-graft-phosphatidylethanolamine: amphiphilic matrices for controlled drug delivery. React Funct Polym. 67:43–52.
- Sheikh MS, Huang Y. 2004. Death receptors as targets of cancer therapeutics. Curr Cancer Drug Targets. 4:97–104.
- Siekmann B, Westesen K. 1992. Submicron-sized parenteral carrier systems based on solid lipids. Pharm Pharmacol Lett. 1:123–126.
- Sood S, Jain K, Gowthamarajan K. 2014. Optimization of curcumin nanoemulsion for intranasal delivery using design of experiment and its toxicity assessment. Colloids Surf B Biointerfaces. 113:330–337.
- Steinhauser I, Spänkuch B, Strebhardt K, Langer K. 2006. Trastuzumab-modified nanoparticles: optimisation of preparation and uptake in cancer cells. Biomaterials. 27:4975–4983.
- Ulbrich K, Subr V. 2004. Polymeric anticancer drugs with pH-controlled activation. Adv Drug Deliv Rev. 56:1023–1050.
- Vivek R, Thangam R, NipunBabu V, Rejeeth C, Sivasubramanian S, Gunasekaran P, Muthuchelian K, Kannan S. 2014. Multifunctional HER2-antibody conjugated polymeric nanocarrier-based drug delivery system for multi-drug-resistant breast cancer therapy. ACS Appl Mater Interfaces. 6:6469–6480.
- Walczak H, Miller RE, Ariail K, Gliniak B, Griffith TS, Kubin M, et al. 1999. Tumoricidal activity of tumor necrosis factor-related apoptosis-inducing ligand in vivo. Nat Med. 5:157–163.
- Woodcock J, Griffin JP, Behrman RE. 2011. Development of novel combination therapies. N Engl J Med. 364:985–987.