
Abstract
Purpose Colon-specific drug delivery systems (CDDS) can improve the bio-availability of drugs through the oral route. A novel formulation for oral administration using ligand coupled chitosan nanoparticles bearing 5-Flurouracil (5FU) encapsulated in enteric coated pellets has been investigated for CDDS. Method The effect of polymer concentration, drug concentration, stirring time and stirring speed on the encapsulation efficiency, and size of nanoparticles were evaluated. The best (or optimum) formulation was obtained by response surface methodology. Using the experimental data, analysis of variance has been carried out to evolve linear empirical models. Using a new methodology, polynomial models have been evolved and the parametric analysis has been carried out. In order to target nanoparticles to the hyaluronic acid (HA) receptors present on colon tumors, HA coupled nanoparticles were tested for their efficacy in vivo. The HA coupled nanoparticles were encapsulated in pellets and were enteric coated to release the drug in the colon. Results Drug release studies under conditions of mimicking stomach to colon transit have shown that the drug was protected from being released in the physiological environment of the stomach and small intestine. The relatively high local drug concentration with prolonged exposure time provides a potential to enhance anti-tumor efficacy with low systemic toxicity for the treatment of colon cancer. Conclusions Conclusively, HA coupled nanoparticles can be considered as the potential candidate for targeted drug delivery and are anticipated to be promising in the treatment of colorectal cancer.
Introduction
Colorectal cancer is one of the most frequent causes of cancer deaths. In USA, more than 140,000 patients develop this disease and almost half of them die in a year (internet Resource Citation2014). Due to erratic oral bioavailability, intravenous administration of this drug is currently in clinical practice (Hahn et al. Citation1975). However, on intravenous administration, 5FU is rapidly distributed and eliminated with an apparent terminal half-life of 8-20 min and produces severe systemic toxic effects of gastrointestinal, hematological, neural, cardiac and dermatological origin. Most of these systemic side effects are due to the cytotoxic effect of 5FU after it reaches unwanted sites (Diasio and Harris Citation1989). Targeted delivery of 5FU not only reduces systemic side-effects, but also provides an effective and safe therapy for colon cancer with reduced dose and reduced duration of therapy. Therefore, to obtain a long-term and constant therapeutic effect, an oral colon-specific drug delivery system (CDDS) is desirable. Authors have discussed in the past regarding the different approaches involved and the problems encountered during colon-specific drug delivery (Basit Citation2005, Jain et al. Citation2006, Citation2007a, Citation2007b).
Chitosan is a partially deacetylated polysaccharide obtained by alkaline treatment of chitin, and has been gaining increasing importance in the pharmaceutical field owing to its good biocompatibility, low toxicity and biodegradability (Knapczyk et al. Citation1989, Hirano et al. Citation1990). In drug delivery applications, chitosan has been used as a vehicle for drug, protein and gene delivery (Chen et al. Citation2004, Sinha et al. Citation2004, Hallan et al. Citation2014). The degraded products of chitosan are non-toxic, non-immunogenic and non-carcinogenic.
Hyaluronic acid (HA), a linear polysaccharide of alternating d-glucuronic acid (GlcUA) and N-acetyl-d-glucosamine (GlcNAc) units, serves a variety of functions within the extracellular matrix (Zeng et al. Citation1998, Peterson et al. Citation2000, Prestwich Citation2001). In addition to elevated HA in the environment surrounding tumors, most malignant cell-types overexpress the HA receptors viz. CD44 and RHAMM. Isoforms of HA receptors, CD44 and RHAMM are overexpressed in colorectal carcinoma (Wang et al. Citation1996, Samuelsson and Gustafson Citation1998, Yamada et al. Citation1999, Bel et al. Citation2004), and other cancers (Culty et al. Citation1994, Catterall et al. Citation1999, Bourguignon et al. Citation2000, Matsubara et al. Citation2000). As a result, malignant cells with the highest metastatic potential often show enhanced binding and internalization of HA (Hua et al. Citation1993).
To study the effects of a large number of formulation variables, it requires many experiments, which are often costly and time consuming. It is therefore prudent to minimize the total number of experiments performed in the optimization process, without sacrificing quality. The linear and polynomial models were fitted to the experimental results using software called ‘“Design Expert’. The experimental results were then compared with the results obtained from these models. By conducting analysis of variance (ANOVA), significance of the models as well as that of different independent variables was evaluated (Myers and Montgomery Citation2002).
The objective of this study was to evaluate the potential of a high throughput statistical screening method in optimizing the unit process parameters that influence the preparation of chitosan nanoparticles (NPs), which were further encapsulated in enteric-coated pellet to deliver the drug directly to the site of colon tumor. It was also aimed to investigate the applicability of the predictive statistical empirical models by conducting minimum number of experiments on chitosan NPs.
Preparation and coating of nanoparticles
Chitosan (purified viscosity grade: 50cps, molecular weight: 150 kDa, deacetylation degree: 85%), Fermentation derived HA (Sodium salt, Mr: 1.5 MDa), Fluorouracil (5FU), Triethylcitrate and Dialysis membrane (MWCO 3500) and Eudragit S100 were procured from the vendors/manufacturers. Double distilled water was used throughout the study.
Preparation of chitosan TPP nanoparticles
Chitosan TPP nanoparticles (CTNPs) were prepared by ionotropic gelation of chitosan with tri-polyphosphate (TPP) according to the procedure developed by Calvo et al. (Citation1997). Briefly, CHI was dissolved (2.0 mg/ml) in aqueous acetic acid (pH 4.0) solution and TPP was dissolved in purified water at the concentration of 1.0 mg/ml. Drug (10.0%) was added to the TPP solution and stirred for 5 min. Finally, 1.5 ml of drug containing TPP solution was added to 4 ml of the CHI solution through a syringe needle under magnetic stirring at room temperature thereby leading to the formation of drug-loaded chitosan nanoparticles at room temperature. The milky dispersion so formed was centrifuged at 10,000 rpm for 30 min maintaining 4 °C temperature. The supernatant was discarded and sediment was poured in to dialysis bag and dialyzed three times with phosphate buffer saline (pH 7.4) under strict sink conditions for 10 min to remove free drug from the formulation, which was then estimated spectrophotometrically at 266 nm for 5FU to determine indirectly the amount of drug loaded within the system. The dialyzed formulation was lyophilized and used for further characterization. These blank and 5FU-loaded chitosan nanoparticles were termed as CTNP and CTNPF, respectively (for abbreviations, see ).
Table I. Abbreviations used in the manuscript.
Conjugation of nanoparticles with HA
Covalent coupling of carboxyl group of HA with free amino group of chitosan present on the surface of nanoparticles using EDC as coupling agent is performed according to the procedure reported with little modifications as reported by Jain et al. (Jain and Jain Citation2008, Jain et al. Citation2010). Drug-loaded lyophilized NPs were suspended into PBS (pH 7.4) containing HA (NPs/HA ratio: 100:10 w/w). EDC (20 mg/ml of NPs/HA mixture) was added, vortexed and incubated for 1.5 h at room temperature. The ligand anchored nanoparticles were separated from unconjugated ligand using minicolumn centrifugation (Sephadex G-75 packed column) technique and washed thrice with deaerated distilled water. The nanoparticles were collected after ultracentrifugation at 60,000 rpm for 45 min. The resultant nanoparticulate pellet was redispersed in distilled water and subsequently preserved after lyophilization at 4 °C. These nanoparticles were termed as blank and 5FU-loaded HA-coupled chitosan nanoparticles termed as HACTNP and HACTNPF, respectively. The amount of HA coupled to the surface of the NPs was assessed by a change in the zeta potential. The two process variables (incubation time and total nanoparticulate formulation to HA weight ratio) were optimized by measuring the change in zeta potential (the surface charge density) of the dispersion. For photometric determination of HA, the modified uronic acid carbazole reaction of Bitter and Muir (Citation1962) was performed as described previously by Jain and Jain (Citation2008), and therefore has not been discussed in this paper.
Preparation of enteric coated nanoparticulate pellets
Preparation of nanoparticulate pellets
5FU pellets of hyaluronan coupled (HACTNPFP) and uncoupled (CTNPFP) nanoparticles were prepared using an extrusion-spheronization technique. Avicel (25%) and 5FU-loaded nanoparticles (75%) were first mixed for 5 min and deionized water was added with further mixing (10 min). This wet mass was extruded and then spheronization of the slug was done (at 2200 rpm for 5 min). Pellets of 1.1–1.4 mm (greater than 75% yield in this size range) were dried for 4 h at 40 °C.
Coating of nanoparticulate pellets
The pellets were subjected to enteric coating using conventional coating pan, and were termed as 5FU-loaded hyaluronan coupled (HACTNPFEP) and uncoupled (CTNPFEP) enteric pellets. The enteric coating solution was prepared (Huyghebaert et al. Citation2005) as follows. Milky latex of Eudragit S100 using 1 M ammonia (1.5%) was prepared and stirred for 1 h using a magnetic stirrer; TEC (20%) was added to it and stirring continued for the next 30 min. The talc was added as an anti-tacking agent. The enteric coating dispersion was filtered before use. The film coating was done at pan rotating speed: 20 rpm; atomizing air pressure: 2 bar; inlet air temperature: 60–70 °C; outlet air temperature: 35-40 °C; and pellets bed temperature: 38 °C. The film-coated pellets were not removed from the pan until complete weight gain was achieved. All the pellets were stored in vacuum desiccator at room temperature until used. A series of coated products with different film thicknesses were produced, quantified by the % total weight gain, by varying the amount of coating solution sprayed. The coated pellets were removed from the coating chamber and cured in an oven for 1 h at 50 °C to ensure coalescence of the film coat. The film thickness is expressed (EquationEq. 1(1) ) as the percentage theoretical weight gained (% TWG).
(1)
where, UP and CP are the weights of the uncoated and coated pellets, respectively.
Characterization of nanoparticles
Particle analysis and % encapsulation efficiency
The nanoparticles were characterized for their shape and morphology by scanning electron microscopy (SEM) (resolution of 3.5 nm). The nanoparticles were coated with gold-palladium alloy (150–250 Å) using a sputter coater. The particle size, size distribution and polydispersity index of the drug-loaded nanoparticles were assessed by photon correlation spectroscopy using Zeta Sizer (Malvern Instruments, Malvern, PA). The morphological examination of the nanoparticles was also performed by transmission electron microscopy (TEM). The samples were stained with 2% w/v phosphotungstic acid for 10 s. The entrapment of 5FU in nanoparticulate formulation was determined as discussed by Fry et al. (Citation1978) after suitable modifications. The un-entrapped drug from nanoparticulate suspension was removed by passing the formulation through a sephadex G-50 mini column and centrifuged at 10,000 rpm for 5 min. The nanoparticles were then lysed using methanol, and drug content was determined spectrophotometrically at 266 nm for 5FU. All measurements were performed three times and their average is reported. The percentage drug encapsulation efficiency was calculated using EquationEq. (2)(2) .
(2)
Experimental design
To develop an accurate mathematical model, a large number of experiments are required to be performed which may not be feasible from time, money and effort point of view. For example, if the experiments are to be conducted with five independent variables at five levels then it will require 55 = 3125 experiments to produce the total effects (linear, interaction and higher order). It becomes still more undesirable to conduct so many experiments when it involves the experimentation to assess different drug formulation effects on the rodents. Hence, use of ‘design of experiments’ technique becomes very useful, where the same magnitude of information can be extracted from the much lesser number of experiments (say, 32 in this case).
Most formulation studies involve variation of one factor (or variable) at a time, keeping other factors constant. Factorial design enables all factors to be varied simultaneously, allowing quantification of the effects caused by independent variables and their interactions. In this study, experimental design was introduced to optimize the formulation of nanoparticles by choosing the chitosan concentration (C), TPP concentration (TP), drug concentration (D), stirring speed (SS), and stirring time (ST) as independent variables. Three levels of each variable were selected and the experiments were conducted. At each experimental level, two batches of nanoparticles were prepared. The results were expressed as mean ± S.D., and statistical evaluation of data was performed using analysis of variance (ANOVA) technique. A probability level of P<0.05 was considered as significant.
Results
Preparation and characterization of chitosan nanoparticles
Scanning electron microscopy and TEM revealed the spherical shape of HA anchored chitosan nanoparticles (). The mean diameter of HACTNP and CTNP formulations were 150 ± 3.4 nm and 135 ± 5.4 nm, respectively. A low polydispersity index of 0.182 and 0.114 obtained for these two formulations indicate a narrow size distribution and homogeneous distribution. The zeta potential of CTNP and HACTNP formulations was observed to be 42.6 ± 2.4 mV and 31.1 ± 6.3 mV, respectively ().
Figure 1. Photomicrographs of placebo chitosan nanoparticles (A) SEM analysis; (B) TEM analysis of uncoupled nanoparticles; (C) TEM analysis of HA coupled nanoparticles.
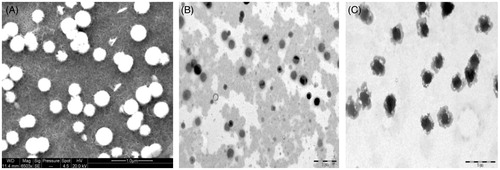
Table II. Characterization of 5FU-loaded uncoupled and coupled nanoparticles.
Coupling efficiency: optimization ratio of nanoparticles and hyaluronic acid
Hyaluronic acid coupled chitosan nanoparticles (HACTNP) were prepared by incubating the predrug loaded optimized nanoparticle formulations with hyaluronic acid (HA) in the presence of EDC. The HA conjugation to the amine groups present on the surface of nanoparticles was assessed as a function of the carbodiimide concentration and the reaction time (incubation time between the carbodiimide reagent and nanoparticle dispersion). Therefore, the concentration of cross-linking agents EDC, incubation time and HA:NP ratios were optimized in order to ensure effective coupling of a ligand to the nanoparticle surface. These coupled nanoparticle systems were characterized for the particle size, shape, percent encapsulation efficiency and in vitro drug release, and were compared with the non-coupled nanoparticles.
The two process variables (incubation time and total nanoparticulate formulation to HA weight ratio) were optimized as previously (Jain et al. Citation2010). The concentration of the HA coupled on the surface of the nanoparticles by the formation of amide linkage between the –COOH group of hyaluronan and –NH2 group, on the nanoparticles in the presence of EDC was determined as described (Jain et al. Citation2010, Gupta et al. Citation2007).
Empirical linear model development and analysis
The experiments were conducted by varying single variable at a time approach. The empirical linear models were developed to represent the responses [particle size (PS), entrapment efficiency (EE) and polydispersity index (PI)] in terms of variations in the independent factors, namely, C, TP, D, SS and ST. Since, the design of experiments was done by adopting ‘one variable at a time approach’, interaction effects and higher order effects could not be obtained to represent it as a polynomial equation. Hence, the linear models represented, as EquationEq. (3)(3) was developed,
(3)
where, Y is a response (PS, EE or PI), k is a constant, and a, b, c, d, e are coefficients of the independent variables C, T, D, SS, ST, respectively.
gives the values of the constants and coefficients of EquationEq. (3)(3) for 5FU CTNP nanoparticles. These models (EquationEq. 3
(3) ) can be used to predict the value of one of the responses at a time. The regression analysis to develop these linear models was carried out by using the ‘Design Expert’ software. As an example for drug 5FU, the models extracted from are as follows:
(4a)
(4b)
(4c)
Table III. Constant and coefficients of independent parameters of the linear models for CTNPs.
It is found from ANOVA that some parameters are having insignificant effect, which means that statistically their effect is not substantial but it does not mean zero effect. For accurate computation, it is recommended that the insignificant parameters are also taken into account. Different ANOVA parameters are given in . The ‘Predicted RV’ value, which is a measure of how good a model predicts the response value, of 0.3529 is not as close to the ‘Adjusted R2’ of 0.6113 as one might normally expect. The adjusted RV and predicted RV should be within approximately 0.20 of each other.
Table IV. Other ANOVA parameters for EE1 of 5FU in CTNPs formulation.
EquationEquation (5)(5a) gives a reduced model for Entrapment Efficiency for 5FU of formulation CTNP. gives the reduced model and it shows that the value of ‘F’ ratio has gone up, which means it represents the process better than the earlier model but one has to be careful that it is ignoring the effect of two variables, which are although small but they have some effect and for very precise analysis they should be incorporated. This model reduction operation can be performed on the other models also whenever the approximate results and easy understanding are required.
Table V. ANOVA after model reduction for response EE1 of 5FU in CTNPs.
Equations in terms of actual factors after model reduction for 5FU are as follows:
(5a)
(5b)
(5)
Optimization
During optimization, PS and PI were minimized while EE was maximized. To limit the number of experiments due to time constraint, the range over which these independent parameters were varied was small hence theoretically these models are usually not supposed to be used for extrapolation. Further, the optimum values obtained are ‘local optimums’, not the ‘universal optimums’. Secondly, while setting the objectives of optimization, equal weightage is given to all the three goals (PS, EE and PI) in the present work (i.e. W1ps = ⅓; W1ee = ⅓; W1pi = ⅓). The Design Experts system gave around 30 solutions out of which higher rank (higher desirability) eight solutions are reproduced in . Please note that once the weights of PS, EE and PT are changed then the optimum solution () also changes. Thus, it can also be used to select the optimum values of variables while the importance of one variable is more than the others.
Table VI. Optimization of 5FU for CTNPs with equal weightage to PS1, EE1 and PI1.
A set of optimum parameters is given () from which one has to choose the most appropriate one under the given conditions. All these results are with desirability of 1.0. Desirability ranges from zero to one for any given response. A value of one represents the ideal case. A value of zero indicates that one or more responses fall outside the desirable limits. In , serial no. 3 gives the minimum particle size and reasonably high EE2, which makes it a genuine candidate for the optimum conditions. Solution # 3 in Table VI can be accepted because the desirability is 1 and the values of PS1 and PI1 are minimum. However, with combination of PS1 and PI1, we could not get the maximum EE1. Therefore, the values corresponding to Sol. No. 3 are bold faced in Table # VI.The analysis was also carried out by giving unequal weights for three responses. During the development of drug delivery system, the particle size is as important as entrapment efficiency. If the particle size is too large then the particles will not reach to the target cancer cells. EE is also important, if EE value is too low then even though the particle size may be small enough to reach to the cell, but the sufficient drug will not be released to the target. However, the importance of PI is comparatively less. Hence, the optimization has also been done with unequal weights as given below () to explore the effect of weights on these responses:
Table VII. Optimization for CTNPs formulation for 5FU with unequal weightage (PS1 = 40%, EE1 = 40%, and PI1 = 20%).
From (Sr. No.3) and (Sr. No. 6, (both bold faced)), it is clear that the lower particle size and slightly higher EE values are obtained from the equal weights model () as compared to the unequal weights model (). In the same way, optimization can be carried out with different weights for different responses. However, from the comparison of these two optimum results ( and ), Sr. No. 3 of seems to give better results. Hence, it is concluded that equal weight may be given to all the three responses in this particular case only.
From the experiments, the minimum particle size obtained is 120 nm, maximum value of EE obtained is 48%, and minimum value of PI observed is 0.110. While comparing these values with those predicted by the models, it is found that the model prediction gives different solution compared to that obtained experimentally under the given conditions. It can be attributed to the fact that all independent parameters were not varied simultaneously, hence the best/accurate optimum conditions could not be achieved experimentally. From , it is found that the model with equal weights to PS, EE and PI is giving the results which are more to our understanding of the responses (PS, EE, PI). Hence, it is concluded that it requires further work to set the weights for different responses for getting a better optimum solution. It is also to be noted that one cannot get the best combination of all the three responses at the same time, hence one has to have a ‘trade off’ between the weights for three responses.
By comparison of the reduced model () with the full model (), it is found that the optimum results are quantitatively better in case of the full model than the reduced model. Hence, it is concluded that for an accurate prediction of the responses and optimization of the variables, full scale model should be used even though it may be a bit difficult to interpret. Secondly, with the present day’s high speed computational capabilities, the difference in the computational time is insignificant in case of the full scale model and reduced model.
Table VIII. Optimization for 5FU for formulation CTNPs with equal weights to PS1, EE1 and PI1 using reduced model.
Table IX. Non-linear model coefficients values for formulation of CTNPs.
Non-linear modeling and comparison with experimental results
Based upon the non-linear analysis, following type of exponential model (EquationEq. 6(6) ) was found to be best fitting for all the cases of 5FU using the ‘Data Fit’ software.
(6)
where, a, b, c, d, e are coefficients, k is a constant and Y is a response (PS, EE or PI). For the CTNP formulation of drug 5FU, following models (EquationEq. 7–9) for EE, PS and PI were obtained.
(7)
(8)
(9)
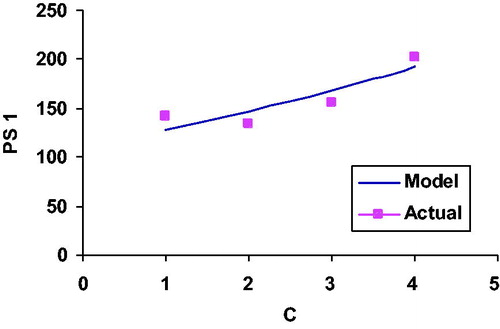
Using the exponential model, the relationships between various variables and responses were plotted (). It was found that some deviations exist between the experimental and theoretical results. It is quite evident that the model is able to predict the values of the responses, which are reasonably close to the experimental ones but it is not able to capture very fine variations which are visible in the experimental results. The deviation can be attributed to the fact that the proposed model is not able to account for the interaction and higher order effects of the independent parameters. Hence, it was decided to develop polynomial models, which are capable to capture interaction and higher order effects.
Figure 2. Relationship between particle size and change in chitosan concentration in case of drug bearing CTNPs.
In the previous section, an exponential model (EquationEq. 6(6) ) was developed to represent the experimental results. Using this model, the desired 32 computational experiments have been conducted to calculate the related responses and to develop a polynomial equation for each response with the help of ‘Design of Experiments’ software. The polynomial equation developed was of the following form:
(10)
Here, ‘k’ is a constant, coefficients ‘bi’ represent linear effects, ‘bii’ represent higher order effects, and bij represent interaction effects. Different models were developed for different cases. It is to be noted that insignificant (obtained from the ANOVA) terms from these models were omitted. For formulation 1 and Drug 5FU, following models were developed:
(11)
(12)
(13)
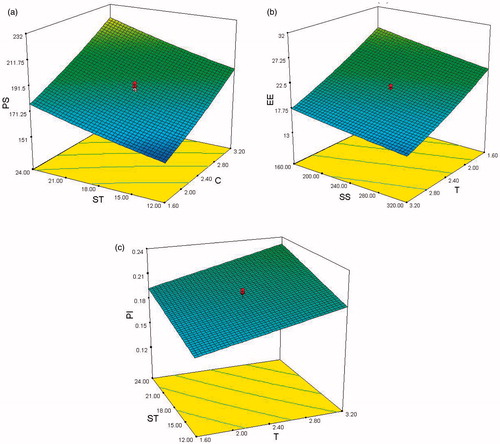
A comparison of the experimental results with the exponential and polynomial models results is presented. It demonstrates the accuracy of the models with reference to the experimental results. It is seen () that in majority of the cases, polynomial models fit better than the linear models while in other cases linear models are closer to the experimental results. shows 3-D variation of two independent parameters with one response at a time. For example, in , effect of ST and C on particle size is presented.
Figure 3. Relationship between experimental, linear and polynomial model results for CTNP nanoparticles. Effect of (a) Chitosan on PS for 5FU, (b) Stirring speed on PS for 5FU, (c) Chitosan on PI for 5FU.
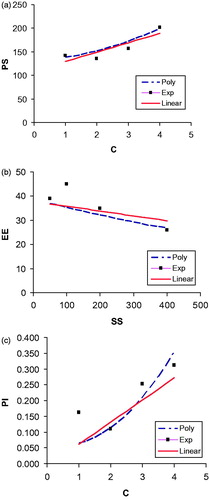
Figure 4. 3-D relationship of different independent parameters with the responses obtained from the polynomial model for CTNP Nanoparticles formulation. (a), (b), (c) are for drug 5FU.
Discussion
The results obtained in the preceding sections are discussed as follows.
Preparation and characterization of chitosan nanoparticles
The main goal of this work was to investigate the potential of chitosan nanoparticles for colon delivery of anticancer drug on oral administration. Therefore, it was expected to have information not only about the potential of chitosan nanoparticles for increasing concentration of anticancer drug to the site of colon tumors but also for their selective and preferential localization at tumor cells for effective treatment of cancer.
5FU-loaded nanoparticles were prepared and their surface was coupled with hyaluronan using carbodiimide chemistry. The carboxylic group of the hyaluronic acid was covalently coupled in the presence of EDC with amine group present at the surface of amino groups forming an amide linkage. The EDC concentration was optimized in order to ensure that coupling of HA does not result in particle-particle aggregation or extensive crosslinking. The zeta potential was found to decrease on coupling of HA with chitosan. This may be due to the masking of cationic surface charge by hyaluronan coating. Entrapment efficiency was found to be less in HA anchored chitosan nanoparticles as compared to uncoupled nanoparticles; this may be due to the leaching of drug during HA coating.
The HA-coupled nanoparticle preparation was already confirmed by different techniques like IR, DSC and XRD and described (Jain et al. Citation2010). From the IR data it is clear that HA-coupled nanoparticles (HACTNP) had characteristic peaks of amide bond, which is effective evidence of successful coupling reaction taking place between the HA group and the CHI amine group. DSC and XRD data suggested that drug was molecularly dispersed in the polymer matrix.
Linear empirical model development and analysis
It is always essential to statistically check the significance of the developed models. For this purpose, the ANOVA was carried out for the above models, and as a representative results for the Entrapment Efficiency (EE1) for 5FU of CTNP formulation are given in . It is clear from this table that the model is significant (P<0.05). The significance can also be decided from the model’s ‘F’ value. It is significant only when the computed ‘F’ value is greater than the tabulated ‘F’ value. As shown in , the model F-value of 7.29 implies that the model is significant. There is only 0.12% chance that this large ‘Model F-value’ could occur due to noise. If the values of ‘Prob > F’ is less than 0.05 (significance level) then it indicates that the model is significant. In the present case, it is 0.0012 < 0.05. In this case C, T, D are significant variables. The ‘Lack of Fit F-value’ of 1.08 implies that the Lack of Fit is not significant relative to the pure error. Non-significant lack of fit is good, because we want the model to fit.
Table X. ANOVA for response EE1 of 5FU of formulation CTNPs.
Optimization and non-linear analysis
The optimization is a process that searches for a combination of factor levels/values that simultaneously satisfy the requirements placed on each of the responses and factors. To use optimization, one must first analyze each response to establish the appropriate model. Using the simple linear models discussed earlier, optimization was carried out using ‘Design Expert’ (Myers and Montgomery Citation2002).
A complex drug system as discussed in this paper cannot be accurately represented by the linear models; however, these models are good enough for simple interpretation of the system. Hence, a set of the non-linear models were fitted to the data. From this set, the most appropriate one was chosen based upon the value of coefficient of multiple determinations (RV). ‘Higher the value of RV better it is’ strategy was followed.
Conclusions
From the above factorial analysis, results and comparison of the experimental results with linear model predictions and polynomial model predictions, it is observed that in most of the cases polynomial model of the type represented by EquationEq. (10)(10) fits better than the linear model represented by EquationEq. (3)
(3) . Polynomial model predictions are closer to the experimental results than the linear model predictions. From the ANOVA, it is also clear that some factors are having more significant effect as compared to others. Optimization for the various responses reveals that one can have many local optimum solutions. Depending upon the requirements, one can choose the best for the prevailing conditions. This factorial analysis also helped in the in-depth understanding of the process.
Acknowledgements
Authors acknowledge with thanks the help of Dr. Ajay M. Sidpara, Department of Mechanical Engineering, Indian Institute of Technology Kharagpur (India) for his help in the optimization analysis of this paper.
Declaration of interest
The authors report no declarations of interest. The authors alone are responsible for the content and writing of the paper.
References
- Basit AW. 2005. Advances in colonic drug delivery. Drugs. 65:1991–2007.
- Bel MK, Weichert W, Well KC, Schmitt WD, Lautenschlager C, Hauptmann S. 2004. Epithelial hyaluronic acid and CD44v6 are mutually involved in invasion of colorectal adenocarcinomas and linked to patient prognosis. Virchows Arch. 445:456–464.
- Bitter T, Muir HM. 1962. A modified uronic acid carbozole reaction. Anal Biochem. 4:330–334.
- Bourguignon LYW, Zhu HB, Shao LJ, Chen YW. 2000. CD44 interaction with Tiam1 promotes Rac1 signaling and Hyaluronic acid-mediated breast tumor cell migration. J Biol Chem. 275:1829–1838.
- Calvo P, Remuñán-López C, Vila-Jato JL, Alonso MJ. 1997. Novel hydrophilic chitosan-polyethylene oxide nanoparticles as protein carriers. J Appl Polymer Sci. 63:125–132.
- Catterall JB, Jones LMH, Turner GA. 1999. Membrane protein glycosylation and CD44 content in the adhesion of human ovarian cancer cells to hyaluronan. Clin Exp Metastas. 17:583–591.
- Chen SC, Wu YC, Mi FL, Lin YH, Yu LC, Sung HW. 2004. A novel pH-sensitive hydrogel composed of N,O-carboxymethyl chitosan and alginate cross-linked by genipin for protein drug delivery. J Control Release. 96:285–300.
- Culty M, Shizari M, Thompson EW, Underhill CB. 1994. Binding and degradation of hyaluronan by human breast cancer cell lines expressing different forms of CD44: correlation with invasive potential. J Cell Physiol. 160:275–286.
- Diasio RB, Harris BE. 1989. Clinical pharmacology of 5-fluorouracil. Clin Pharmacokinet. 16:215–237.
- Fry D, White J, Goldman I. 1978. Rapid separation of low molecular weight solutes from liposomes without dilution. Anal Biochem. 90:809–815.
- Gupta Y, Jain A, Jain P, Jain SK. 2007. Design and development of folate appended liposomes for enhanced delivery of 5-FU to tumor cells. J Drug Target. 5:231–240.
- Hahn RG, Moertel CG, Schutt AJ, Bruckner HW. 1975. A double-blind comparison of intensive course 5-fluorouracil by oral vs. intravenous route in the treatment of colorectal carcinoma. Cancer. 35:1031–1035.
- Hallan SS, Kaur P, Kaur V, Mishra N, Vaidya B. 2014. Lipid polymer hybrid as emerging tool in nanocarriers for oral drug delivery. Artif Cells Nanomed Biotechnol [Epub ahead of print]. doi: 10.3109/21691401.2014.951721
- Hirano S, Seino H, Akiyama I, Nonaka I. 1990. Chitosan: a biocompatible material for oral and intravenous administrations. In: Gebelein CG, Dunn RL, Eds. Progress in Biomedical Polymers. New York: Plenum, pp. 283–289.
- Hua Q, Knudson CB, Knudson W. 1993. Internalization of hyaluronan by chondrocytes occurs via receptor-mediated endocytosis. J Cell Sci. 106:365–375.
- Huyghebaert N, Vermeire A, Remon JP. 2005. In vitro evaluation of coating polymers for enteric coating and human ileal targeting. Int J Pharm. 298:26–37.
- Internet Resource. 2014. Available at: Internet website:http://www.cancer.gov/cancertopics/types/colon-and-rectal [Accessed on 25 October 2014].
- Jain A, Ganesh N, Bharve J, Shekh A, Jain SK. 2010. Design and development of ligand appended polysaccharidic nanoparticles for the delivery of oxaliplatin in colorectal cancer. Nanomedicine. 6:179–190.
- Jain A, Gupta Y, Jain SK. 2006. Azo-chemistry and its potential for colonic delivery. Crit Rev Ther Drug Carrier Syst. 23:349–400.
- Jain A, Gupta Y, Jain SK. 2007a. Perspectives of biodegradable natural polysaccharides for site-specific drug delivery to the colon. J Pharm Pharma Sci. 10:86–128.
- Jain A, Gupta Y, Jain SK. 2007b. Potential of calcium pectinate beads for target specific drug release to colon. J Drug Target. 15:285–294.
- Jain A, Jain SK. 2008. In vitro and cell uptake studies for targeting of ligand anchored nanoparticles for colon tumors. Eur J Pharm Sci 35:404–416.
- Knapczyk J, Krówczynski L, Krzek J, Brzeski M, Nurnberg E, Schenk D, Struszcyk H. 1989. Requirements of chitosan for pharmaceutical and biomedical applications. In: Skåk-Bræk G, Anthonsen T, Sandford P, Eds. Chitin and Chitosan: Sources, Chemistry, Biochemistry, Physical Properties and Applications. London: Elsevier, pp. 657–663.
- Matsubara Y, Katoh S, Taniguchi H, Oka M, Kadota J, Kohno S. 2000. Expression of CD44 variants in lung cancer and its relationship to hyaluronan binding. J Int Med Res. 28:78–90.
- Myers RH, Montgomery DC. 2002. Response Surface Methodology, 2nd ed. New York: John Wiley and Sons Inc.
- Peterson RM, Yu Q, Stamenkovic I, Toole BP. 2000. Perturbation of hyaluronan interactions by soluble CD44 inhibits growth of murine mammary carcinoma cells in ascites. Am J Pathol. 156:2159–2167.
- Prestwich GD. 2001. Biomaterials from chemically-modified hyaluronan. Glycoforum. Available at: http://glycoforum.gr.jp.
- Samuelsson C, Gustafson S. 1998. Studies on the interaction between hyaluronan and a rat colon cancer cell line. Glycoconjugate J. 15:169–175.
- Sinha VR, Singla AK, Wadhawan S, Kaushik R, Kumria R, Bansal K, Dhawan S. 2004. Chitosan microspheres as a potential carrier for drugs. Int J Pharm. 274:1–33.
- Wang C, Tammi M, Guo H, Tammi R. 1996. Hyaluronan distribution in the normal epithelium of esophagus, stomach, and colon and their cancers. Am. J. Pathol. 148:1861–1869.
- Yamada Y, Itano N, Narimatsu H, Kudo T, Hirohashi S, Ochiai A, et al. 1999. Receptor for hyaluronan-mediated motility and CD44 expressions in colon cancer assessed by quantitative analysis using real-time reverse transcriptase-polymerase chain reaction. Jpn J Cancer Res. 90:987–992.
- Zeng CX, Toole BP, Kinney SD, Kuo JW, Stamenkovic I. 1998. Inhibition of tumor growth in vivo by hyaluronan oligomers. Int J Cancer. 77:396–401.