
Abstract
Context Inherited hemoglobin diseases are the most common single-gene disorders. Induction of fetal hemoglobin in beta hemoglobin disorders compensate for abnormal chain and ameliorate the clinical complications. Sodium butyrate is used conventionally for fetal hemoglobin induction; it can be replaced by safer therapeutic tools like microRNAs, small non-coding RNAs that control number of epigenetic mechanisms. Objective In this study, we compared the changes in the microRNAs of differentiated erythroid cells between control and sodium butyrate treated groups. The objective is to find significant association between these changes and gamma chain up regulation. Materials and methods First, CD133+ hematopoietic stem cells were isolated from cord blood by magnetic cell sorting (MACS) technique. After proliferation, the cells were differentiated to erythroid lineage in culture medium by EPO, SCF, and IL3. Meanwhile, the test group was treated with sodium butyrate. Then, gamma chain upregulation was verified by qPCR technique. Finally, microRNA profiling was performed through microarray assay and some of them confirmed by qPCR. Result Results demonstrated that gamma chain was 5.9-fold upregulated in the treated group. Significant changes were observed at 76 microRNAs, in which 20 were up-regulated and 56 were down-regulated. Discussion Five of these microRNAs including U101, hsa-miR-4726-5p, hsa-miR7109 5p, hsa-miR3663, and hsa-miR940 had significant changes in expression and volume. Conclusion In conclusion, it can be assumed that sodium butyrate can up-regulate gamma chain gene, and change miRNAs expression. These results can be profitable in future studies to find therapeutic goal suitable for such disorders.
Introduction
Synthesis of an abnormal βs-globin chain and the reduced rate of synthesis of normal β-globin chains result in Sickle cell diseases and β-thalassaemias, respectively (Galanello and Origa Citation2010, Pace et al. Citation2015, Rees et al. Citation2010). Sickle cell disease is a widespread group of hemoglobin disorders caused by substitution of single amino acid. Homozygous sickle cell anemia (HbSS) is the most common severe syndrome resulting from insoluble Hbs and formation of crystals when exposed to low oxygen tension (Madigan and Malik Citation2006). Due to the fetal hemoglobin (HbF) exclusion from interaction with HbS, and subsequently its exclusion from the sickle polymer formation, HbF is consider as the major genetic modulator of the hematological and clinical features of sickle cell anemia (Noguchi et al. Citation1988).
β-Thalassemia syndromes are a heterogeneous group of monogenic disorders worldwide, characterized by molecular mutations of the β-globin chain, which cause deficiency of β-globin chains and an excess of unmatched α-globin chains (Galanello and Origa Citation2010). Excess unbalanced α globin chains precipitate in erythroid precursors causing the severe ineffective erythropoiesis and intramedullary hemolysis (Mathias et al. Citation2000). The greater the α-chain excess, the more severe the anemia (Rund and Rachmilewitz Citation2005). Production of γ-globin, to a critical level helps to decrease the excess α chains and to ameliorate the condition in patients with β-chain abnormalities and obviate the regular transfusions requirement (Perrine Citation2008).
Fetal hemoglobin (HbF; α2γ2) is the major hemoglobin in the fetus, but it subsequently declines and adult hemoglobin, HbA (α2β2), becomes predominant (Singer et al. Citation2005). The main switch to adult hemoglobin occurs 3–6 months after birth; hence, clinical symptoms of the patients with sickle cell anemia and β-thalassemia major would become apparent at nearly that time (Stamatoyannopoulos Citation2005). In last few decades, hemoglobin switching has been the target of various investigations, and it is expected to lead to the development of useful therapeutic approach to thalassemias and hemoglobinopathies (Perrine Citation2008). Inducing γ-globin expression by even small increments can compensate reduced or abnormal β-chain expression and therefore inhibits the polymerization of Hbs in sickle cell anemia and ameliorates the clinical severity of the β-thalassemias (Wood et al. Citation1976).
Principally, we know today, some mechanisms that regulate globin gene activity during development (Stamatoyannopoulos Citation2005). A number of pharmacological agents are available as fetal hemoglobin inducers including hydroxyurea, 5-azacytidine, araC, butyrate, and other short chain fatty acids (Chou et al. Citation2015, Perrine Citation2011, Steinberg and Rodgers Citation2001). Although hydroxyurea is the only FDA approved drug for SCD treatment, but it is highly pleiotropic and does not solely modulate γ-globin gene expression (Costa et al. Citation2013). An oral butyrate derivative, sodium 2,2-dimethylbutyrate (SDMB) is one of these drugs, which found to stimulate γ-globin production in thalassemia and sickle cell anemia patients (Faller and Perrine Citation1995). There is a growing interest in butyrate derivations because its impact on epigenetic mechanisms, which leads to more specific and efficacious therapeutic strategies for the prevention and treatment of different diseases (Faller and Perrine Citation1995). Although the exact mechanism by which sodium butyrate affects gene transcription remained unknown, the common opinion is that this short-chain fatty acid induces γ-globin gene expression through the inhibition of histone deacetylases (Cao et al. Citation2004, Panja and Basu Citation2015). Currently, the main focus is on the development of more safe agents, which can increase HbF to prevent all complications of the diseases (Fathallah and Atweh Citation2006, Sankaran Citation2011).
MicroRNAs (miRNAs or miRs) are small (about 22 nucleotides in length) non-coding single-stranded RNA molecules (Minayi et al. Citation2014), which play key role in the regulation of gene expression (Zare et al. Citation2014). This interaction prevents protein production by suppressing protein synthesis and/or by initiating mRNA degradation (Valencia-Sanchez et al. Citation2006). Recently, miRNAs have been identified to regulate HbF expression in erythropoietic cells (Bianchi et al. Citation2009, Gabbianelli et al. Citation2010, Sankaran et al. Citation2011). Nevertheless, whether γ-globin mRNAs could also be directly targeted by certain miRNAs has not been reported yet (Azzouzi et al. Citation2011).
In the current study, we studied sodium butyrate-mediated induction of HbF by analyzing epigenetic and molecular profiles of erythroid cells derived from CD133 + HSC. We selected sodium butyrate since it can consistently affect the gamma chain expression more than other compounds (Costa et al. Citation2013). Our study investigated changes in miRNA expression, using Hematopoietic stem cell isolated from cord blood before starting sodium butyrate and after reaching sodium butyrate.
Materials and methods
Cell isolation and culture
Human cord blood was obtained from Iran Blood Transfusion Organization. In the first step, cord blood was diluted by Hydroxyethyl Starch (HES) solution with the ratio of 1:7 to precipitate red blood cells. Then, mononuclear cells (MNCs) were isolated using a Hypaque-Ficoll density gradient (Amersham Pharmacia, Piscataway, NJ) with one/two ratio (ficoll to cord blood ratio). By centrifuging at 400 × g for 40 min, mononuclear layer was separated from red blood cell layer, and then it was mixed with three volumes of phosphate buffered saline (PBS) with pH = 7.2. After centrifuge at 300 × g for 10 min, pelleted mononuclear cells were washed with PBS twice.
For isolation of CD133+ cells from other MNCs, magnetic activated cell sorting (MACS) CD133+ isolation kit (Miltenyi Biotech, Germany) was used according to manufacturer’s instruction. Briefly, harvested MNCs were passed through MACS column placed in a magnetic field, and about 5 × 10⁵ CD133+ cells were purified with approximately 95% purity. The isolated CD133+ cells suspended in Iscove’s Modified Dulbecco’s Medium (IMDM) containing, 25% (v/v) fetal bovine serum (FBS) (Cambrex, Belgium), 3 U/mL erythropoietin (EPO; R&D systems, Minneapolis, MN, USA), 5 ng/ml interleukin-3 (IL-3; Stem cell Technology Vancouver, BC, Canada), and 2 mM L-glutamine at an initial density of 105cells/mL for 14 days. Sodium butyrate (Sigma, Saint Louis, MO) were dissolved in distilled water to obtain a stock concentration of 500 mM. The stock solution was diluted with culture medium and added to the cells at a final concentration of 100 μM sodium butyrate (Ahmadvand et al. Citation2014) on the second week (day 7–14). The medium was replaced with fresh medium every 3 days. The cells were counted and viability was measured with 0.4% trypan blue dye. Isolated CD133+ divided into two groups and treated with (1) DW, as a vehicle control and (2) sodium butyrate at a concentration of 100 μM. After 14 days, erythroid progenitor collected and RNA extraction was performed.
Flow cytometry analysis
Flow cytometry analysis was performed by MACS technique to determine the purity of isolated CD133 + cells. Monoclonal antibody against CD133 + was conjugated with PE (clone, AC141; Miltenyi Biotech, Germany), and PE conjugated-mouse IgG1 antibody (IQ-Products, the Netherlands; IQP-191F), as an isotype of negative control, were added to about 105 isolated cells according to the manufacturer’s protocol. The mixture incubated for 60 min at 4 °C, and 100 μl Paraformaldehyde 1% solution was added in order to fix the cells and their interactions with florescent antibodies. Flow cytometry analysis was carried out by FACScan flow cytometer (Becton Dickinson, San Diego, CA) and the results were analyzed by FlowJo™ software.
RNA extraction
RNA was isolated from both treated and untreated cell samples to identify genes that were either activated or repressed by sodium butyrate treatment. The cells were centrifuged at 300 rpm for 5 min and the supernatant was removed. Subsequently, 200 μl of TRIZOL per 106 cells was added, mixed by vortex for 15 s, and leaved at room temp for 5 min. Then, solution was transferred to 1.5 ml microtube, and 0.2 ml chloroform/1 ml TRIZOL reagent was added. Samples mixed vigorously by vortex for 1 min, incubated at 4 °C for 5 min and then centrifuged at 12000 rpm for 20 min at 4 °C. Following centrifugation, the mixture separated into three visible phases: phenol-chloroform phase (lower red), an interphase, and a colorless upper aqueous phase. RNA remains exclusively in the aqueous phase. Upper aqueous phase was transferred carefully into fresh labeled tubes without disturbing the interphase. RNA was precipitated from the aqueous phase by mixing with Ethanol (0.5 ml 100% cold Ethanol/1 ml TRIZOL Reagent). Following the overnight incubation in −70 °C, the tube was spun at 12,000 rpm for 45 min at 4 °C. Then the ethanol was aspirated and the pellet was washed with 1 ml of 70% ethanol, mixed by vortex and spun for 15 min. Afterward, the ethanol was removed and tube was incubated at room temperature for 5 minutes to allow the remaining ethanol to air dry. The pellet was resuspended in 30–50 μl RNase free water (DEPC). The isolated RNA was subjected to reverse transcription to generate cDNA molecules.
Reverse transcription PCR
cDNA synthesis was performed using TaKaRa RR037A in reaction mixture containing the component which is presented in . The reaction mixture incubated at 37 °C for 15 min (1 cycle) and at 85 °C for 5 s (1 cycle). The synthesized cDNA was stored at −20 °C for later qPCR.
Table 1. cDNA synthesis reaction mixture.
Relative quantification PCR
Quantification PCR (Q-PCR) was performed to evaluate γ-globin expression and erythroid differentiation. It was carried out using the Rotor gene 6000 Real-Time PCR system (Applied Corbett, USA) by the ΔΔCt method, with HPRT as the internal control to normalize RNA levels. Primers sequences are shown in . PCR amplification was carried out in a 20 μl PCR reaction volume containing forward primer 10 pmol (1 μm), reverse primer 10 pmol (1 μm), Master mix Eva green (10), cDNA (2), and distilled water (6). The PCR conditions were as follows: denaturation at 95 °C for 5–10 min (1 cycle), annealing at 94 °C for 15 s (40 cycles), extension at 60 °C for 40 s (40 cycles), and a final extension step at 72 °C for 20 s (40 cycles).
Table 2. Primers used for relative quantification PCR.
Microarray analysis
Relative expression of miRNA isolated from erythroid cells derived from CD133+ cells was measured using a human miRNA microarray (AffymetrixGeneChip® miRNA 4.0 Array, Affymetrix, Santa Clara, CA) by Macrogen Company in Korea. The Affymetrix GenechipmiRNA array process was performed according to the manufacturer's protocol. For this purpose, 1 μg RNA samples were labeled with the FlashTag™ Biotin RNA Labeling Kit (Genisphere, Hatfield, PA). The labeled RNA was quantified, fractionated and hybridized to the miRNA microarray according to the standard procedures provided by the manufacturer. Then, it was heated to 99 °C for 5 min and to 45 °C for 5 min. RNA-array hybridization was performed with agitation at 60 rotations per minute for 16–18 h at 48 °C on an Affymetrix® 450 Fluidics Station. The chips were washed and stained using a Genechip Fluidics Station 450 (Affymetrix, Santa Clara, CA), and then scanned with an AffymetrixGeneChip Scanner 3000 (Affymetrix, Santa Clara, CA). Signal values were computed using the Affymetrix® GeneChip™ Command Console software.
We run qPCR for miR-940 and miR-3663 to confirm our microarray results. The process consist of microRNA cDNA synthesizing by cDNA synthesis kit (Stratagene, La Jolla, CA) in two stages: first, polyadenylation was performed by reaction mixture presented in . The reaction mixture incubated at 37 °C for 30 min (1 cycle) and at 95 °C for 5 min (1 cycle). The second stage was performed according to and .
Table 3. miRNA cDNA synthesis reaction mixture.
Table 4. miRNA qPCR reaction mixture.
Table 5. cDNA synthesis temperature profile.
miRNA qPCR
In order to evaluate miR-940 and miR-3663 expression, qPCR was carried out using the Rotor gene 6000 Real-Time PCR system (Applied Corbett, USA) by the ΔΔCt method, with U6 as internal control to normalize RNA levels. Primers’ sequences are shown in . PCR amplification was carried out in a 20 μl PCR reaction volume containing 3.123 μM miRNA specific forward PRIMER (1 μl), 3.125 μM universal reverse primer (1 μl), diluted reference dye (0.375 μl), Master mix Eva green (12.5 μl), cDNA (1 μl), and distilled water (4.56 μl). The PCR conditions were as follows: denaturation at 95 °C for 10 min (1 cycle), then 40 cycles of denaturation at 95 °C for 10 s, annealing at 60 °C for 15 s, and extension step at 72 °C for 20 s.
Table 6. Primers’ sequences of qPCR.
Data preparation and statistical analysis
Raw data were extracted automatically in Affymetrix data extraction protocol using the software provided by AffymetrixGeneChip® Command Console® (AGCC). miRNA level RMA + DABG-All was analyzed and results were exported using Affymetrix® Expression Console™ Software. Array data were filtered by probes annotated species. The comparative analysis between test and control samples was carried out using fold-change. All statistical test and visualization of differentially expressed genes was conducted using R statistical language version 2.15.0.
Results
Isolation of CD133 + cells
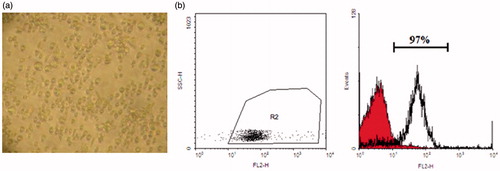
CD133 + stem cells were isolated successfully from cord blood sample (). The purity of isolated cells was assessed using flow cytometry (). Samples with expression values more than 90% were selected for further studies. In microscopy analysis, each sample of isolated CD133 + hematopoietic stem cells consisted about 1 million cells. Cell viability was about 87% as counted using Trypan blue assay.
Figure 1. CD133 + stem cells isolation. (a) Cord blood-derived CD133 + stem cells in day 2 of differentiation. (b) Flowcytometry analysis of isolated CD133 + indicates 97% purity on the day of isolation.
RNA extraction
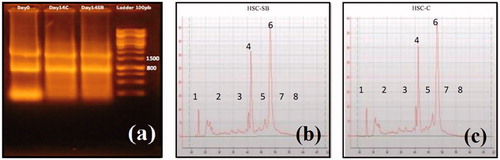
On day 14, 106 CD133 + cells were isolated from culture medium for RNA extraction. Subsequently, RNA samples were run on a 1% agarose gel by electrophoresis to determine the purity and probable degradation of the extracted RNA. As presented in , in lane 4 and 3, bands can be observed which are the three RNA subunits 28S, 18S, and 5S rRNA. For quality control of the samples (control and test), A260/280 absorbance ratio and RNA concentration was measured by NanoDrop. A260/280 absorbance ratio and RNA concentration were found to be 2.25, 217.24 ng/μl and 2.24, 188.34 ng/μl for control and test, respectively. Also for quality control of the RNA samples, RNA Integrity Number (RIN) assessed using Agilent Technologies 2100 Bioanalyzer in test () and control () samples, and the results reported based on Integrity Number ≥ 8. RIN was estimated at 8 for control and 8.5 for test samples.
Figure 2. Electrophoresis of extracted RNA on day 0 and 14 of differentiation. 18S rRNA band (800 bp) and 28S rRNA band (1500 bp) of control and test samples on days 0 and 14 of differentiation are shown in the picture (a). RNA Integrity Number (RIN) in test (HSC-SB) (b) and control (HSC-C) (c) samples. (1) Pre-region marker; (2) 5s region; (3) fast region; (4) 18s fragment; (5) inter region; (6) 28s fragment; (7) precursor region; (8) post-region.
Erythroid differentiation of CD133 + cells
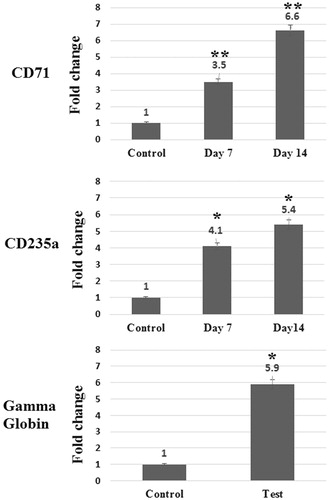
In order to evaluate the effects of sodium butyrate on the induction of gamma globins gene expression in erythroid precursors, CD133 + cells were cultured in IMDM medium containing 100 μM sodium butyrate, for a period of 8 days. Subsequently, the expression of erythroid markers including CD71, CD235a and gamma globins was determined using qPCR technique. Fold changes in expression of these genes are presented in .
Figure 3. Relative expression of CD71, CD235a and Gamma globin in differentiated cells in comparison with control cells on days 0 and 14. Relative expression of CD71, CD235a, and Gamma globin significantly elevated in differentiated cells in comparison with control cells. Errors bars represent standard deviation. *P = 0.001 and **P = 0.0001.
Quality control of miRNAs
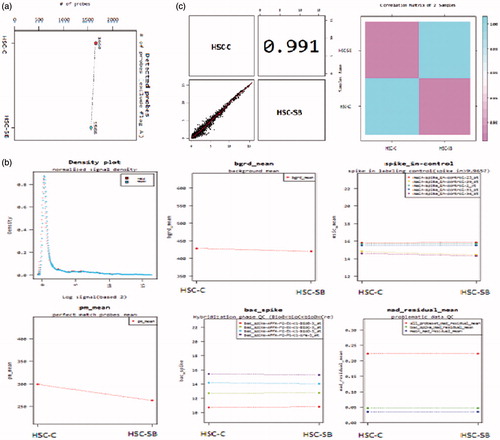
Quality control of the miRNAs was performed by Macrogen Company to ensure the quality of miRNAs for microarray procedure. microRNAs concentrations and their attachment to probe were acceptable (6). Results are presented in .
Figure 4. Quality control of the miRNAs. (a) The probes which attached to each sample. The probes show acceptable signals and weak signals (Flag A) were omitted; (b) Concentration graphs and probes distribution after normalization. Concentration graphs show normalized values and others indicate biases and statistical errors; (c) Distribution graphs and comparison between samples by Pearson product-moment correlation coefficient (Range: −1 ≤ r ≤ 1). This graph shows normalized values. X axis indicates control sample (HSC-C) and Y axis indicates test sample (HSC-SB).
miRNAs expression
Microarray assay was performed by Macrogen Company. In order to minimize systematic errors and to avoid false statistical results, rare data were filtered and normalized. Results are demonstrated in and .
Table 7. Altered microRNAs and their related chromosome, sequence lengths, and sequences.
qPCR
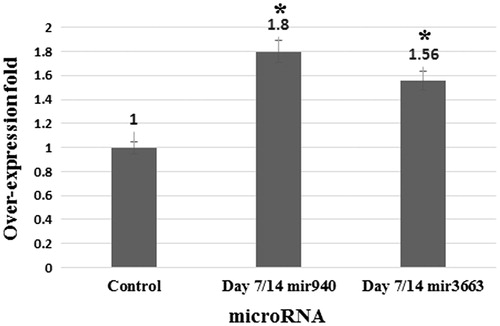
Our data shows a 1.8- and 1.56-fold over-expression of miR-940 and miR-3663, respectively. Results merely indicate sodium butyrate can up-regulate these microRNA (.
Figure 5. Microarray assay. (a) The graph of miRNAs expression in test (T, red, right column) and control (C, blue, left column) groups; (b) the graph of significant changes in miRNAs expression. 289 miRNAs down-regulated or up-regulated by |fc| ≥ 1.5 and 76 miRNAs down-regulated or up-regulated by |fc| ≥ 2 (upper column upregulated, lower column downregulated); (c) the graph of expression values distribution. X axis: Control and Y axis: Test; (d) the graph of the log changes. Volume = Squared root (normalized value of Control * normalized value of Test) Red dot (marked dots): top five ranking miRNAs in volume with significant cut-off. 180 × 147 mm (300 × 300 DPI).
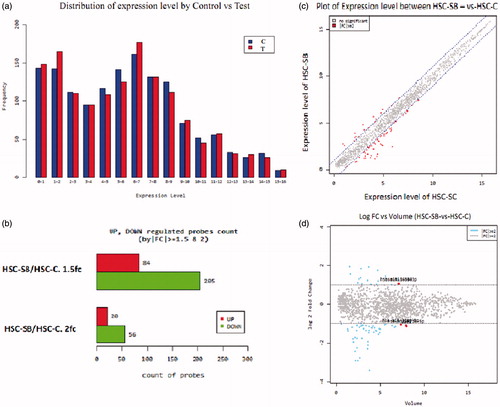
Figure 6. qPCR results by fold. Errors bars represent standard deviation. *P = 0.001.
Discussion
Sodium butyrate has been considered as a low-risk and highly effective agent in γ-globin gene induction (Weinberg et al. Citation2005). Long-term cytotoxic potential of fetal hemoglobin gene inducing agents leads to investigations into safe molecules, which regulate HbF expression and switching (Bank Citation2006). One of these molecules could be micro RNAs (miRNAs), which are suggested to be new approach in targeting HbF induction (Azzouzi et al. Citation2011). In order to find that which miRNAs are appropriate candidate for HbF induction, it is necessary to recognize that which of them are up-regulated in HbF switching. Regarding to this, sodium butyrate was used for β-chain switching to γ-chain, and then microarray method was performed to explore that which miRNAs up-regulated in this process.
In this study, significant increase was observed in γ-globin expression in sodium butyrate group. Our findings were in agreement with researches of Perrine et al. (Citation1989, Citation1993), Constantoulakis et al. (Citation1989), and Fibach et al. (Citation1993). Sodium butyrate induced γ-gene expression in CD133 + in sodium butyrate group in comparison with the control group. Our results were in coordination with Dehghanifard et al. (Citation2011, Citation2012), Ahmadvand et al. (Citation2011), and Fard et al. (Citation2013a,Citationb). It has been shown that sodium butyrate is effective on SCD patients even on the ones that are resistant to HU (Panja and Basu Citation2015). None of these researchers evaluated microRNA expression pattern in their study. In our study, microarray analysis was performed to evaluate the miRNAs up-regulation and down-regulation pattern.
Walker et al. (Citation2011) investigated miRNAs expression profile in erythroid cells of sickle cell anemia patient, before and after hydroxy urea administration. Findings indicated that the expression profile of some of the miRNAs was different in control group (healthy individuals), sickle cell anemia patients, and patients who treated with hydroxy urea. They suggested that hsa-mir 26b and miR151–3p are involved in HbF expression induction (Walker et al. Citation2011). In the study of Alijani et al. (Citation2014), the effect of upregulation of miR-26b in the induction of HbF expression on K-562 was evaluated, and the results showed increase in HbF expression in miR-26b upregulation. Walker et al. (Citation2011) showed that hydroxy urea leads to up-regulation in miR26b and HbF expression. Findings of Walker et al. and Alijani et al. were in accordance with each other.
In this study, miRNAs expression profile was determined by miRNA microarray technique, before and after treatment with sodium butyrate. According to our results, the expression of 76 miRNAs had significant difference in test group compared to the control group; in which, 20 of them were up-regulated, whereas 56 of them were down-regulated in the presence of sodium butyrate. As presented in and , miRNA-U101, hsa-miR-4726–5p, hsa-miR7109–5p, hsa-miR3663, and hsa-miR940 showed the most alterations in all miRNAs which the first three were down-regulated and the last two were up-regulated. Moreover, our findings illustrated that miR221 expression was down-regulated by about 2-fold in the test group, which treated with sodium butyrate. This was in agreement with Gabbianelli study. Gabbianelli et al. demonstrated its role in HbF production. miR221/222 down-regulate KIT expression in normal erythropoiesis. KIT activation inhibits HbF production; therefore, down-regulation of KIT expression leads to increase in HbF production (Gabbianelli et al. Citation2010).
It should be noted that HbF inducers can act only as a treatment for hemoglobinopathies to ameliorate the clinical condition of patients along with blood transfusion. However, gene therapy could be a definitive cure. Hence identification of microRNAs involve in the gamma chain expression can lead to novel therapeutic approaches in hemoglobinopathies. We suggest future studies to focus on determining the role of five demonstrated miRs in epigenetic modification, so it would illuminate the way to find a cure for beta thalassemia.
Conclusion
Our results in the current study confirmed the sodium butyrate as an inducer of HbF. However, due to the complications of HbF inducers, it seems crucial to find a substitute for these products; miRNAs can be the promising surrogate. We found that some miRNAs were up-regulated in the sodium butyrate presence; therefore, they can be used for inducing γ-globin gene expression in β-thalassemia and sickle cell anemia patients.
Funding information
This study was supported by grant from the Mashhad University of medical sciences (research project number 910736).
Acknowledgements
This study was done in Department of Hematology of Tehran University of medical sciences. The authors thank all authorities and office worker of faculty of hematology of Tehran and Mashhad University of medical sciences for their kind assistance.
Disclosure statement
The authors report no conflicts of interest.
Related Research Data
References
- Ahmadvand M, Noruzinia M, Fard AD, Zohour MM, Tabatabaiefar MA, Soleimani M, et al. 2014. The role of epigenetics in the induction of fetal hemoglobin: a combination therapy approach. Int J Hematol Oncol Stem Cell Res. 8:9–14.
- Ahmadvand M, Norouzinia M, Soleimani M, Kaviani S, Abroun S, Dehghanifard A, Mahmoodinia MM. 2011. In vitro induction of the gamma globin gene in erythroid cells derived from cd133 + by thalidomide and sodium butyrate. Genetics. 9:2373–2378.
- Alijani S, Alizadeh S, Kazemi A, Khatib ZK, Soleimani M, Rezvani M, et al. 2014. Evaluation of the effect of miR-26b up-regulation on HbF expression in erythroleukemic K-562 cell line. Avicenna J Med Biotechnol. 6:53–56.
- Azzouzi I, Moest H, Winkler J, Fauchère JC, Gerber AP, Wollscheid B, et al. 2011. MicroRNA-96 directly inhibits γ-globin expression in human erythropoiesis. PLoS One. 6:e22838.
- Bank A. 2006. Regulation of human fetal hemoglobin: new players, new complexities. Blood. 107:435–443.
- Bianchi N, Zuccato C, Lampronti I, Borgatti M, Gambari R. 2009. Expression of miR-210 during erythroid differentiation and induction of gamma-globin gene expression. BMB Rep. 42:493–499.
- Cao H, Stamatoyannopoulos G, Jung M. 2004. Induction of human gamma globin gene expression by histone deacetylase inhibitors. Blood. 103:701–709.
- Chou YC, Chen RL, Lai ZS, Song JS, Chao YS, Shen CKJ. 2015. Pharmacological induction of human fetal globin gene in hydroxyurea-resistant primary adult erythroid cells. Mol Cell Biol. 35:2541–2545.
- Constantoulakis P, Knitter G, Stamatoyannopoulos G. 1989. On the induction of fetal hemoglobin by butyrates: in vivo and in vitro studies with sodium butyrate and comparison of combination treatments with 5-AzaC and AraC. Blood. 74:1963–1971.
- Costa FC, Fedosyuk H, Neades R, Chazelle AM, Zelenchuk L, Fonteles AH, et al. 2013. A cell-based high-throughput screen for novel inducers of fetal hemoglobin for treatment of sickle cell disease, Cooley’s anemia and β-thalassemias. Blood. 122:925.
- Dehghanifard A, Kaviani S, Noruzinia M, Soleimani M, Abroun S, Hajifathali A, et al. 2012. Synergistic effect of sodium butyrate and thalidomide in the induction of fetal hemoglobin expression in erythroid progenitors derived from cord blood CD133 + cells. Zahedan J Res Med Sci. 14:29–33.
- Dehghanifard A, Kaviani S, Noruzinia M, Soleimani M, Abroun S, Zonoubi Z, Ahmadvand M. 2011. Evaluation the effect of thalidomide and sodium butyrate on cord blood stem cell differentiation induction to erythroid lineage. Genetics. 9:2457–2461.
- Faller DV, Perrine SP. 1995. Butyrate in the treatment of sickle cell disease and beta-thalassemia. Curr Opin Hematol. 2:109–117.
- Fard AD, Hosseini SA, Shahjahani M, Salari F, Jaseb K. 2013a. Evaluation of novel fetal hemoglobin inducer drugs in treatment of β-hemoglobinopathy disorders. Int J Hematol Oncol Stem Cell Res 7:47–54.
- Fard AD, Kaviani S, Noruzinia M, Soleimani M, Abroun S, Chegeni R, et al. 2013b. Evaluation of H3 histone methylation and colony formation in erythroid progenitors treated with thalidomide and sodium butyrate. Lab Hematol 19:1–5.
- Fathallah H, Atweh GF. 2006. Induction of fetal hemoglobin in the treatment of sickle cell disease. ASH Educ Program 2006:58–62.
- Fibach E, Prasanna P, Rodgers G, Samid D. 1993. Enhanced fetal hemoglobin production by phenylacetate and 4-phenylbutyrate in erythroid precursors derived from normal donors and patients with sickle cell anemia and beta-thalassemia. Blood. 82:2203–2209.
- Gabbianelli M, Testa U, Morsilli O, Pelosi E, Saulle E, Petrucci E, et al. 2010. Mechanism of human Hb switching: a possible role of the kit receptor/miR 221-222 complex. Haematologica. 95:1253–1260.
- Galanello R, Origa R. 2010. Review: beta-thalassemia. Orphanet J Rare Dis. 5:11.
- Madigan C, Malik P. 2006. Pathophysiology and therapy for haemoglobinopathies; Part I: sickle cell disease. Expert Rev Mol Med. 8:1–23.
- Mathias LA, Fisher TC, Zeng L, Meiselman HJ, Weinberg KI, Hiti AL, Malik P. 2000. Ineffective erythropoiesis in β-thalassemia major is due to apoptosis at the polychromatophilic normoblast stage. Exp Hematol. 28:1343–1353.
- Minayi N, Alizadeh S, Dargahi H, Soleimani M, Khatib ZK, Tayebi B, et al. 2014. The effect of miR-210 up-regulation on proliferation and survival of mouse bone marrow derived mesenchymal stem cell. Int J Hematol Oncol Stem Cell Res. 8:15–23.
- Noguchi CT, Rodgers GP, Serjeant G, Schechter AN. 1988. Levels of fetal hemoglobin necessary for treatment of sickle cell disease. N Engl J Med. 318:96–99.
- Pace BS, Liu L, Li B, Makala LH. 2015. Cell signaling pathways involved in drug-mediated fetal hemoglobin induction: Strategies to treat sickle cell disease. Exp Biol Med (Maywood). 240:1050–1064.
- Panja A, Basu A. 2015. Pharmacogenomics of the drugs used for the treatment of thalassemia. J Cytol Histol. 6:360.
- Perrine S. 2011. Novel therapeutic agents for HbF induction: a new era for treatment of β thalassemia? Thalassemia Rep 1:e7.
- Perrine S, Miller B, Faller D, Cohen R, Vichinsky E, Hurst D, Lubin B, Papayannopoulou T. 1989. Sodium butyrate enhances fetal globin gene expression in erythroid progenitors of patients with Hb SS and beta thalassemia. Blood. 74:454–459.
- Perrine SP. 2008. Fetal globin stimulant therapies in the beta-hemoglobinopathies: principles and current potential. Pediatr Ann. 37:339–346.
- Perrine SP, Ginder GD, Faller DV, Dover GH, Ikuta T, Witkowska HE, et al. 1993. A short-term trial of butyrate to stimulate fetal-globin-gene expression in the beta-globin disorders. N Engl J Med. 328:81–86.
- Rees DC, Williams TN, Gladwin MT. 2010. Sickle-cell disease. Lancet. 376:2018–2031.
- Rund D, Rachmilewitz E. 2005. β-Thalassemia. N Engl J Med. 353:1135–1146.
- Sankaran VG. 2011. Targeted therapeutic strategies for fetal hemoglobin induction. ASH Educ Program 2011:459–465.
- Sankaran VG, Menne TF, Šćepanović D, Vergilio JA, Ji P, Kim J, et al. 2011. MicroRNA-15a and-16-1 act via MYB to elevate fetal hemoglobin expression in human trisomy 13. Proc Natl Acad Sci USA. 108:1519–1524.
- Singer ST, Kuypers FA, Olivieri NF, Weatherall DJ, Mignacca R, Coates TD, et al. 2005. Fetal haemoglobin augmentation in E/β0 thalassaemia: clinical and haematological outcome. Br J Haematol. 131:378–388.
- Stamatoyannopoulos G. 2005. Control of globin gene expression during development and erythroid differentiation. Exp Hematol. 33:259–271.
- Steinberg MH, Rodgers GP. 2001. Pharmacologic modulation of fetal hemoglobin. Medicine. 80:328–344.
- Valencia-Sanchez MA, Liu J, Hannon GJ, Parker R. 2006. Control of translation and mRNA degradation by miRNAs and siRNAs. Genes Dev. 20:515–524.
- Walker AL, Steward S, Howard TA, Mortier N, Smeltzer M, Wang YD, Ware RE. 2011. Epigenetic and molecular profiles of erythroid cells after hydroxyurea treatment in sickle cell anemia. Blood. 118:5664–5670.
- Weinberg RS, Ji X, Sutton M, Perrine S, Galperin Y, Li Q, et al. 2005. Butyrate increases the efficiency of translation of γ-globin mRNA. Blood. 105:1807–1809.
- Wood W, Weatherall D, Clegg J. 1976. Interaction of heterocellular hereditary persistence of foetal haemoglobin with β thalassaemia and sickle cell anaemia. Nature. 264:247–249.
- Zare M, Soleimani M, Mohammadian M, Akbarzadeh A, Havasi P, Zarghami N. 2014. Efficient biotechnological approach for lentiviral transduction of induced pluripotent stem cells. Artif Cells Nanomed Biotechnol. [Epub ahead of print]. doi: 10.3109/21691401.2014.982804.