
 ?Mathematical formulae have been encoded as MathML and are displayed in this HTML version using MathJax in order to improve their display. Uncheck the box to turn MathJax off. This feature requires Javascript. Click on a formula to zoom.
Abstract
Background/aims Hemoglobin-based oxygen carriers (HBOCs) have been previously studied as resuscitation fluids. Due to HBOCs specific molecular conformation, hemoglobin (Hb) and methemoglobin (MetHb) determination is not always possible with automated apparatus. A practical technique was designed that allows simultaneous reading of MetHb and Hb in small volume samples. Methods A spectrophotometric method for measuring low levels of MetHb and Hb from limited volume samples was developed using a 96-well-plate by downsizing the Evelyn-Malloy and Drabkin methods. Either blood or buffer samples were spiked with one of five HBOCs (HBOC-201, M101, MP4CO-NP, Sanguinate and Oxyvita C). After treatment with cyanides, the samples were read at 540, 630, and 680 nm, and Hb and MetHb results were compared to certificate-of-analysis. Results Hb levels ranging from 0.2 to 2.8 g/dl were detected accurately with the 96-well-plate method with HBOC-201. Similarly, this method accurately measured Hb from either plasma or buffer samples containing any of the HBOCs. The MetHb plasma samples with HBOC-201 were also in agreement with ABL results (R = 0.99719). MetHb from all HBOCs in buffer measured with this method was comparable to reference but the accuracy was compromised for HBOCs in blood. Conclusions A useful 96-well-plate method of measuring HBOCs’ Hb was designed for small-volume plasma samples. It was accurate for measuring MetHb from samples, that contained M101, MP4CO-NP, Sanguinate, and Oxyvita C diluted in buffer. This well-plate method allows reading of batch samples, multiple replicates, and using small volumes to accommodate limited animal blood collection which would not be otherwise detected by automated instrumentation.
Introduction
By enhancing blood volume and improving oxygen content, hemoglobin-based oxygen carriers (HBOCs) offer a solution for the rescue of civilian or military victims where blood products may not be immediately available (Auker and McCarron Citation2011, Cabrales and Intaglietta Citation2013). Following infusion of HBOCs, both plasma hemoglobin (Hb) and methemoglobin (MetHb) should be monitored in clinical situations to assist in interpreting the effective HBOC concentration (Lippi et al. Citation2011). The presence of HBOCs (extracellular components) in blood samples can be directly detected by the level of Hb in the plasma (assuming there is no RBC lysis) with plasma MetHb being indicative of the inactive Hb form of the HBOC.
However, monitoring blood samples containing HBOC presents some challenges for Hb and MetHb measurements. We have shown that the various molecular structures and sizes of HBOCs can result in invalid measurements due to interference with automated instruments used in clinical settings (Arnaud et al. Citation2015). Despite the chemical hazards (i.e., cyanide) involved (Lippi et al. Citation2012), Drabkin’s method for measuring Hb (Drabkin and Austin Citation1935) or the Evelyn-Malloy method for measuring MetHb (Evelyn and Malloy Citation1938, Vandegriff et al. Citation2008) remains the only universally accepted method for their accurate determination.
These methods require large volumes of material (3–5 ml) and can be time consuming. There are easier commercially available ELISA kits that are using smaller volume (100 µl) (https://www.caymanchem.com/pdfs/700540.pdf) but they exclusively measure only Hb and not MetHb and may or may not be valid with HBOCs.
Therefore, the objective of this study was to downsize the standard Evelyn/Malloy and Drabkin methods (Drabkin and Austin Citation1935, Evelyn and Malloy Citation1938, Lippi et al. Citation2012) for measuring simultaneously Hb and percent MetHb by using small aliquots of plasma samples containing HBOCs in a 96-well-plate.
Material and methods
The study protocol was reviewed and approved by the Walter Reed Army Institute of Research and the Naval Medical Research Center Institutional Animal Care and Use Committee (IACUC) in compliance with all applicable Federal regulations governing the protection of animals in research.
The use of rat blood for diagnostic purposes was allowed as per the biosample sharing of animal protocols (IACUC # 12-OUMD-29S).
Materials
Five HBOCs were used. HBOC-201 (HbO2 Therapeutics LLC, Cambridge, MA) is a 250–500 kDa glutaraldehyde-polymerized bovine Hb used in pre-clinical resuscitation studies (Arnaud et al. Citation2007, Rentko et al. Citation2006). Two of other HBOCs tested were PEGylated Hb tetramers: MP4CO-NP (100 kDa human Hb; Sangart, San Diego, CA) and Sanguinate™ (100 kDa bovine Hb; Prolong Pharmaceuticals, LLC, South Plainfield, NJ) (Belcher et al. Citation2013, Cabrales and Intaglietta Citation2013, Klaus et al. Citation2010, Nho et al. Citation1992, Vandegriff et al. Citation2008). The fourth was OxyVita C (OXYVITA Inc, New Windsor, NY), a zero-linked bovine Hb of >15,000 kDa (Harrington and Wollocko Citation2010, Harrington et al. Citation2011) and, finally, M101 (Hemarina, Morlaix, France), a large naturally-occurring non-mammalian extracellular Hb, derived from a marine invertebrate sea worm (Arenicola marina) (Rousselot et al. Citation2006a, Rousselot et al. Citation2006b).
HBOCs were diluted in Sorenson’s buffer (pH 7.2, 28 ml of 0.1 M monobasic sodium phosphate solution and 72 ml of 0.1 M dibasic sodium phosphate solution) so that the Hb concentration was no greater than 3.0 g/dl for the spectrophotometric reading. Also, HBOCs were mixed in a similar fashion with rat blood. The samples were analyzed for Hb and MetHb with the 96-well-plate method and the results were then compared to manufacturer’s reference (Certificate of Analysis, CoA).
In a separate series of experiments, nitroglycerine (Hospira, Lake Forest, IL) was added to neat (100%) HBOC-201. The presence of the nitrate moiety oxidizes Hb to produce MetHb. Adding increasing amounts of nitroglycerine to HBOC-201 resulted in increasing amounts of MetHb in the HBOC-201 samples. This produced a controlled concentration of MetHb in the sample (as determined by the ABL (ABL-735 Radiometer, Copenhagen, Denmark), previously used and shown to be accurate for MetHb with HBOC-201 (Arnaud et al. Citation2007)). Supernatant from these samples was analyzed for Hb and MetHb using the ABL in addition to the 96-well-plate.
Methods
When Hb oxides, the Fe2+ in the heme converts to Fe3+ and MetHb forms. MetHb has an absorption peak at 630 nm. Potassium ferricyanide (K3FeCN6) will cause complete transformation of all forms of Hb into MetHb (reaction 1). The resulting MetHb is usually stabilized by potassium cyanide (KCN) as cyanmethemoglobin (CnMetHb) which has an absorption peak at 540 nm (reaction 2).
With original Drabkin’s method, all forms of Hb are oxidized into the stable CnMetHb using a mixture of potassium ferricyanide and potassium cyanide (Drabkin and Austin Citation1935). The absorbance is read at 540 nm and the concentration of total Hb is determined as per the Beer–Lambert law. This technique was primarily developed for determining the total Hb in whole blood. Individual tubes are necessary for each sample and replicates and large volume of reagents (3–5 ml) are required. We downsized this technique and used ELISA methodology with samples in the 100 µl range.
With original Evelyn–Malloy’s method, any MetHb in the sample is converted to CnMetHb using excess KCN, and all Hb in the sample is converted to 100% MetHb by the addition of K3Fe(CN)6 (reaction 1) and stabilized to 100% CnMetHb after the addition of KCN (Evelyn and Malloy Citation1938). The MetHb was calculated by the change of absorption of MetHb to CnMetHb measured at 635 nm (Eq. (Equation1)). This technique also requires large volume and individual sample testing.
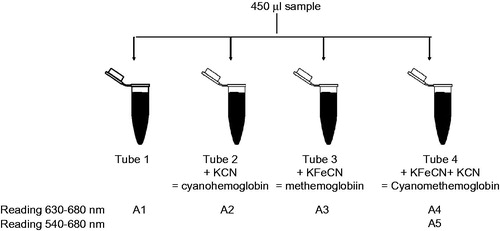
In order to combine Drabkin’s and Evelyn–Malloy’s methods, 450 µL of buffer, standard or plasma was incubated with 10 µL of each cyanide species in four separate 1.5 ml Eppendorf tubes (identified as Tubes 1–4; ). Tube 1 contained only the initial 450 µL sample; Tube 2 contained the sample and 10% KCN; Tube 3 contained the sample and 10% KFeCN6, and Tube 4 contained the sample and 10% KCN + 10% K3FeCN6 (). The tubes were incubated at room temperature in the dark for 10 min. A 100 µl aliquot was dispensed into a 96-well-plate in quadruplicate. The 96-well-plate was a clear, flat bottom Maxisorp polystyrene plate (#442404 or #439454, NUNC, Thermo scientific, https://www.thermofisher.com) with the following internal specification: a bottom diameter of 6.1 µm, a top diameter of 7 µm, a depth of 11.3 µm and a volume of 382 µl (see supplemental material).
Figure 1. A1: Sample with its native MetHb; A2: potassium cyanide (KCN) converts MetHb present in the sample to CnMetHb; A3: potassium ferricyanide (K3FeCN6) converts Hb present in the sample into MetHb which is converted into stable CnMetHb by KCN; A4: A1 to A4 is read at 630 nm for the MetHb; A5: Tube 4 is read at 540 nm. The difference between Tube A1 and A2 corresponds to the native MetHb from the sample; the difference between Tube A3 and A4 corresponds to the MetHb that could be present in the sample produced by all forms of Hb.
The 96-well-plate was read using a spectrophotometer (SpectraMax, Molecular Devices, Sunnyvale, CA) and absorbance (A) was measured at 540 nm (for Hb), 630 nm (for MetHb), and 680 nm (to subtract the background absorbance). Besides using the 96-well-plate, readings were also performed using 1 cm path cuvettes (polystyrene, VWR, Radnor, PA).
The MetHb level (%) was calculated as native MetHb in the sample/total MetHb (%)
Please note that if A3 is less than 0.05, it may translate as abnormal MetHb.
The Hb concentration was calculated with Beer–Lambert law (OD = ɛ × L × C) thus
where OD is the optical density, ɛ is the extinction coefficient (g/dl/mm); L is the path length; C is the concentration (g/dl); dil is the dilution factor.
The path length L, was calculated as 3.279 mm for a sample volume of 100 µl for the specific plate used (see supplemental material). The extinction coefficient for each HBOC was calculated with these parameters (see supplemental material).
Design
The Hb level was measured from all five of the HBOCs using samples diluted with either Sorenson’s buffer or whole blood with dilution ratios such that the OD would not exceed the maximum reading of the Spectra Max plate reader. The samples were centrifuged at 12,000 g for 20 min at 4 °C (Microfuge, 22R, Coulter Beckman, Brea, CA). The supernatant was processed with the cyanide solutions to obtain the different hemoglobin products as described. In addition, a range for MetHb detection was established by adding various amounts of nitroglycerine (Hospira, Lake Forest, IL) to different bags of HBOC-201 to increase MetHb. Each bag MetHb was measured with ABL and samples from each bag were then mixed in various ratios; the final MetHb was calculated. The MetHb from each samples of HBOC-201 + nitroglycerine were read with the ABL and the 96-well-plate. Separately, MetHb level was measured from samples from the four other HBOCs diluted in either Sorenson’s buffer or whole blood. Then the results were compared to the CoA by manufacturer. Finally, in vivo samples collected from rats that were infused with HBOCs were analyzed by this technique (Abutarboush et al. Citation2014, Moon-Massat et al. Citation2015).
Statistical analysis
The correlation coefficient, r value, was derived from a linear regression of the dilution series using the least squares method and a P value was subsequently obtained for each product dilution to validate linearity. At least three sets of each dilution were tested. Then, the nominal Hb concentration of the sample was back-calculated with respect to the dilution. The Hb values for the HBOCs were compared to those reported on the appropriate manufacturer’s CoA using the using the Bland Altman method. Data are presented as mean ± standard deviation (SD). Significance was considered at P < 0.05.
Results
Hemoglobin
There was a good correlation (r = 0.997) between calculated and measured Hb for HBOC-201 samples over a range from 0.1 to 2.8 g/dl when Hb was determined by either the 96-well method or the ABL (). For the other HBOCs, as previously described (Arnaud et al. Citation2015), Hb values from the ABL were significantly different than the manufacturers’ reference values (). When measured by 96-well-plate, results for Hb were linearly related to the dilution rate which allowed us to back calculate and average the Hb concentration (). All Hb values were in agreement with their respective reference values except for M101. The Hb from M101 samples was significantly lower than the manufacturer’s reference value (P < 0.01) ().
Figure 2. Measured vs. calculated Hb from HBOC-201 samples using the ABL or 96-well-plate method. X = 96-well-plate (W) with samples diluted in buffer, ▴ 96-well-plate (W) with samples diluted in blood, and ⋄ ABL with samples diluted in buffer. Mean ± SD.
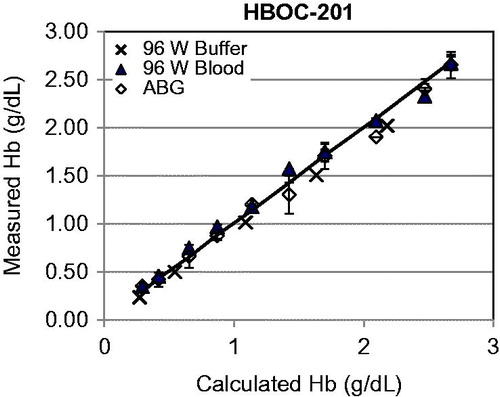
Table 1. Hb for HBOCs diluted with Sorenson’s buffer or blood
Methemoglobin
The range of MetHb from the HBOC-201 + nitroglycerine samples varied from 4% to 40% based on results from the ABL (). Despite the higher standard deviations, the results obtained by the 96-well method were not significantly different from the ABL data.
Table 2. MetHb (%) from samples of HBOC-201 + nitroglycerine using the 96-well-plate method compared to the ABL
The MetHb from the other four HBOCs were measured by the ABL and 96-well method and compared to the manufacturers’ reference values (). As previously described, MetHb measured by the ABL differed significantly from the manufacturers’ values (P < 0.01). MetHb for all HBOCs when measured by the 96-well-plate was in agreement with the manufacturer’s reference values when the samples were diluted with Sorenson’s buffer. However, when the samples were diluted with blood, the results departed from the CoA and only the MetHb from OxyVita C and Sanguinate were in agreement with their reference values, the MetHb from MP4CO-NP and M101 samples were significantly higher than their reference values (P < 0.001).
Table 3. MetHb from OxyVita C, Sanguinate, MP4CO-NP, and M101 using the 96-well (samples diluted in buffer or blood) and the ABL compared to manufacturers’ reference values
In vivo samples
Hb and MetHb were measured by the 96-well method from plasma samples collected from rats (). The abnormal value of MetHb in the saline group was due to low OD readings causing erroneous values when calculating the ratio (Eq. (Equation1)). An estimate of predicted Hb levels was obtained by calculating the dilution of the dose infused to the rat blood volume. The Hb values obtained from the 96-well-plate method were within the range as the calculated Hb (). The MetHb from in vivo blood samples could not be predicted; we found MetHb lower values for OxyVita C and Sanguinate and higher for MP4CO-NP and M101; these were in the same order of magnitude as for the diagnostics samples diluted with blood ().
Table 4. MetHb and Hb determined using 96-well-plate method using in vivo samples from rats infused with an HBOC
Discussion
Measurements of Hb and MetHb have been shown to be inaccurate with certain HBOCs when determined by some automated instruments (Arnaud et al. Citation2015), depending upon the methodology used by these instruments as well as the type of HBOC being measured. The inaccuracies in measuring Hb from HBOC samples reside probably in the specific molecular configurations of each HBOC that prevented accurate detection with either spectrophotometric or chemical methods. As a result, the 96-well-plate method consisted in combining and modifying the standard manual cyanide-based techniques for simultaneously detecting Hb and MetHb in small volume plasma samples. This method appears applicable to samples of small volumes and low levels of Hb.
Hb measurements below 1 g/dl are not possible with ABL but are possible using this 96-well technique. The method is valid for Hb ranging from 0.2 to 2.8 g/dl. The Hb concentration from most of the HBOCs was inaccurate when analyzed by the ABL () but the Hb concentrations were comparable to the manufacturer’s values when using the 96-well-plate technique. The reason why Hb was lower than expected for M101 is unclear. This may be due to a type one error as the standard deviation is elevated and could be eliminated with increase replicates. The in vivo results showed that the Hb was within the predicted range of Hb concentrations as well, suggesting the method can be used reliably.
While the ABL could measure MetHb accurately in samples with HBOC-201, it was not accurate for the other HBOCs. The 96-well-plate method was able to accurately measure MetHb in samples with any of the HBOCS but only when samples were diluted in buffer. For MP4CO-NP and M101, high levels of MetHb were measured using the 96-well-plate when in the presence of blood. These similar findings obtained from the in vivo study samples are puzzling. The reason for this is unclear but it occurred while in the presence of oxygenated blood and exposed to air. It is postulated that the natural anti-oxidants of M101 are protecting its Hb when infused to a recipient. While in contact with blood in vitro and further exposed to atmospheric air (as in blood collection) additional oxidative reactions took place, that resulted in the conversion of Hb into MetHb. It is uncertain if a similar mechanism could be valid for the MP4CO-NP due to the presence of CO on the Heme moiety. This may warrant additional measures to protect the samples, and cooling or processing the samples immediately after blood collection may be necessary.
There are some limitations to this study. First, results may vary according to the type of plate used because all 96-well-plates are not identical. The calculations used to develop this method may not be correct for other types of plate. An internal calibration with known internal standard may be required for each run performed together with tests for accuracy, precision, and reproducibility. In addition, despite the improvement from the original methods, this technique is not fully automated and it implies the handling of toxic cyanide chemicals. Therefore, this technique, proven valid in its principle, needs to be improved for faster throughput testing.
Funding information
This work was supported/funded by work unit 603115HP.3730.001.A1247.
Acknowledgements
The authors are thankful to Mr. Mike Hammett for technical assistance, Mr. Ashraful Haque for statistic assistance and Dr. Charles Auker for discussion.
Disclosure statement
Authors are military service members or employees of the US Government. The authors declare no conflicts of interest with the present study. The views expressed in this article are those of the authors and do not necessarily reflect the official policy or position of the Department of the Navy, Department of Defense, nor the U.S. Government. This work was prepared as part of their official duties. Title 17 USC §105 provides that “copyright protection under this title is not available for any work of the US Government.” Title 17 USC §101 defines a US Government work as a work prepared by a military service member or employee of the US Government as part of their official duties.
References
- Abutarboush R, Aligbe C, Pappas G, Saha B, Arnaud F, Haque A, Auker C, McCarron R, et al. 2014. Effects of the oxygen-carrying solution OxyVita C on the cerebral microcirculation and systemic blood pressures in healthy rats. J Funct Biomater. 5:246–258.
- Arnaud F, Fasipe D, Philbin N, Rice J, Flournoy WS, Ahlers S, McCarron R, Freilich D. 2007. Hematology patterns after hemoglobin-based oxygen carrier resuscitation from severe controlled hemorrhage with prolonged delayed definitive care. Transfusion. 47:2098–2109.
- Arnaud F, Sieckmann DG, McCarron RM, Moon-Massat PF. 2015. Hemoglobin measurements in samples containing hemoglobin-based oxygen carriers. Clin Chem Lab Med. 53:e219–22. doi: 10.1515/cclm-2015-0197.
- Auker CR, McCarron RM. 2011. US Navy experience with research on, and development of, hemoglobin-based oxygen carriers. J Trauma. 70:S40–S41.
- Belcher JD, Young M, Chen C, Nguyen J, Burhop K, Tran P, Vercellotti GM. 2013. MP4CO, a pegylated hemoglobin saturated with carbon monoxide, is a modulator of HO-1, inflammation, and vaso-occlusion in transgenic sickle mice. Blood. 122:2757–2764.
- Cabrales P, Intaglietta M. 2013. Blood substitutes: evolution from noncarrying to oxygen- and gas-carrying fluids. ASAIO J. 59:337–354.
- Drabkin D, Austin J. 1935. Spectrophotometric studies: II. Preparations from washed blood cells; nitric oxide hemoglobin and sulfhemoglobin. J Biol Chem. 112:51–65.
- Evelyn K, Malloy H. 1938. Micro determination of oxyhemoglobin, methemoglobin, and sulfhemoglobin in a single sample of blood. J Biol Chem. 126:655–662.
- Harrington JP, Wollocko H. 2010. Pre-clinical studies using OxyVita hemoglobin, a zero-linked polymeric hemoglobin: a review. J Artif Org. 13:183–188.
- Harrington JP, Wollocko J, Kostecki E, Wollocko H. 2011. Physicochemical characteristics of OxyVita hemoglobin, a zero-linked polymer: liquid and powder preparations. Artif Cells Blood Subst Immobil Biotechnol. 39:12–18.
- Klaus JA, Kibler KK, Abuchowski A, Koehler RC. 2010. Early treatment of transient focal cerebral ischemia with bovine PEGylated carboxy hemoglobin transfusion. Artif Cells Blood Subst Immobil Biotechnol. 38:223–229.
- Lippi G, Plebani M, Di Somma S, Cervellin G. 2011. Hemolyzed specimens: a major challenge for emergency departments and clinical laboratories. Crit Rev Clin Lab Sci. 48:143–153.
- Lippi G, Cervellin G, Favaloro EJ, Plebani M. In vitro and in vivo hemolysis: an unresolved dispute in laboratory medicine. Berlin, Germany: De Gruyter; 2012.
- Moon-Massat P, Mullah SH, Abutarboush R, Saha BK, Pappas G, Haque A, Auker C, McCarron RM, et al. 2015. Cerebral vasoactivity and oxygenation with oxygen carrier M101 in rats. J Neurotrauma. [Epub ahead of print]. doi: 10.1089/neu.2015.3908.
- Nho K, Glower D, Bredehoeft S, Shankar H, Shorr R, Abuchowski A. 1992. PEG-bovine hemoglobin: safety in a canine dehydrated hypovolemic-hemorrhagic shock model. Biomater Artif Cells Immobil Biotechnol. 20:511–524.
- Rentko V, Pearce B, Moon-Massat Maria PF, Gawryl MS. 2006. Hemopure® (HBOC-201, hemoglobin glutamer-250 (bovine)): preclinical studies. In: Robert M, Winslow M, Eds. Blood substitutes. Amsterdam, Boston: Elsevier, pp. 424–436.
- Rousselot M, Delpy E, Drieu La Rochelle C, Lagente V, Pirow R, Rees JF, Hagege A, Le Guen D et al. 2006a. Arenicola marina extracellular hemoglobin: a new promising blood substitute. Biotechnol J. 1:333–345.
- Rousselot M, Jaenicke E, Lamkemeyer T, Harris JR, Pirow R. 2006b. Native and subunit molecular mass and quarternary structure of the hemoglobin from the primitive branchiopod crustacean Triops cancriformis. FEBS J. 273:4055–4071.
- Vandegriff KD, Young MA, Lohman J, Bellelli A, Samaja M, Malavalli A, Winslow RM. 2008. CO-MP4, a polyethylene glycol-conjugated haemoglobin derivative and carbon monoxide carrier that reduces myocardial infarct size in rats. Br J Pharmacol. 154:1649–1661.