
Abstract
Tapentadol hydrochloride (TPD) is a novel analgesic with two mechanisms of actions: agonist activity at the μ-opioid receptor and norepinephrine reuptake inhibition. The conventional delivery of TPD is problematic, owing to its extensive first pass metabolism, low lipophilicity and short half-life that leads to low bioavailability (32%). The intent of the present work was aimed at bio-fabrication of polysorbate 80 coated chitosan nanoparticles (CS-NPs) for CNS targeting of TPD using factorial design approach for enhanced delivery of drug. TPD–CS-NPs were prepared by ionic gelation technique and optimized using 23 factorial design of experiment. The effect of polymer (CS) and cross linker (TPP) concentration was studied on particle size (PS) and entrapment efficiency (EE %). Formulation CNP6 was considered desirable with optimal EE % (87.1 ± 0.4%), PS (329.3 ± 1.0 nm), zeta potential (30.4 ± 0.7 mV) and cumulative drug release of 73.5 ± 2.9% in 24 h. Differential scanning calorimetry revealed the absence of any chemical interaction between TPD, CS, and TPP while SEM study confirmed spherical morphology. In vivo pharmacodynamic studies on rat model verified that pure drug was unable to show considerable antinociceptive activity owing to its hydrophilic nature, conversely polysorbate 80 coated TPD–CS-NPs showed a significant antinociceptive effect over a period of 24 h, which is evidence for brain targeting of TPD–CS-NPs. Accelerated stability studies of optimized batch demonstrated a negligible change in the average PS and EE % after storage at 25 ± 2 °C/60 ± 5% RH (relative humidity) for the period of three months. The ANOVA results for the dependent variables demonstrated that the model was significant (P values < 0.05) for response variables. Above finding suggested practicability of investigated system for effective targeting of many therapeutic agents in the treatment of many life threatening CNS disorders.
Introduction
Brain, the most fragile micro-environment of the body, is well sheltered against potentially toxic substances by various barriers namely blood–cerebrospinal fluid barrier (BCSFB) and blood brain barrier (BBB) that limits most of pharmaceuticals, getting into the brain, preventing the entry of harmful substances into the brain while keenly regulating the uptake and efflux of ions, nutrients, and metabolites (Patel et al. Citation2009). Almost all neuropathological situations such as brain stroke, trauma, bacterial or viral infection, multiple sclerosis, Alzheimer’s disease, Parkinson’s disease, epilepsy, and brain tumors remain untreated and become the important cause of mortality representing 12% of total deaths globally (Honjo et al. Citation2012).
Nanoparticles, which are considered as tunable devices with size in the order of billionth of meters, include variety of nanosized material like polymeric nanoparticles, solid lipid nanoparticles, nanotubes, nanoshells, nanopillars, nanoballs, lipoplex, nanorods, nanocontainers, and many more (Ariga et al. Citation2011, Patil and Surana Citation2013). Polymeric NPs showed some benefits over conventional formulations (e.g., pro-drugs and/or co-drugs based formulations) such as the ability to circumvent P-glycoprotein (P-gp)-mediated resistance, the possibility of bypassing the BBB without structural modifications, and the possibility of employing biocompatible and biodegradable materials (Gabathuler Citation2010).
Chitosan is a hopeful carrier for fabrication of nano- and micro-particulate drug delivery systems owing to its better stability, low toxicity, simple and reproducible preparation methods that make it to use via versatile routes of administration as drug delivery carrier (Nadkarni et al. Citation2012, Prabhakar et al. Citation2013, Strickley Citation2004). Moreover, bio-fabrication of chitosan based NPs also avoid the use of hazardous organic solvents during fabrication.
Polysorbate 80, owing to its hydrophilic and nonionic nature, is widely used in the dispersion of substances in medicinal and food products (Strickley Citation2004). Many working groups reported the use of polysorbate 80 in conjunction with nanoparticles to improve brain specific delivery of several centrally acting drugs by increasing LDL-mediated endocytosis (Prabhakar et al. Citation2013). Therefore polysorbate 80 coating on nanoparticle surfaces may show faith in enhancing brain targeting of theranostic agents.
Tapentadol hydrochloride (TPD) is a centrally acting analgesic having both μ-opioid receptor agonist and noradrenalin (Norepinephrine) reuptake inhibition activity with minimal serotonin reuptake inhibition. This dual mode of action makes tapentadol particularly useful in the treatment of both nociceptive pain and neuropathic pain. When given orally, tapentadol undergoes extensive first pass metabolism, which leads to achieve low bioavailability (32%). About 97% of the parent compound is metabolized. None of the metabolites contribute to the analgesic activity (Nadkarni et al. Citation2012).
Being an opioid analgesic, TPD is helpful for the management of severe pain such as post-operative pain, cancer pain, etc. In such cases, nausea and vomiting are the frequently associated problems and hence poor patient compliance is seen with oral administration.
Generally, opioid are known to show higher inter-subject variability owing to genetic polymorphism of opioid receptors, species effect, metabolic effect or placebo related phenomenon, etc. (Somogyi et al. Citation2007). Like other opioid, tapentadol also has high inter-subject variability, when given orally, as given in Tapentadol Clinical Study Report Synopsis R331333-PAI-30003 (KF 5503/32). High clearance of the tapentadol may be one of the reasons for this high inter-subject variability (Nadkarni et al. Citation2012).
Thus, there exists a need for an alternative dosage form of tapentadol which overcomes the above problems such as bitter taste, adverse effects, etc. and in addition provides quick onset of action with reduced inter-subject variability and improved patient compliance.
In the context of present research, we are proposing a hypothesis for delivery of TPD from the fabricated stable polysorbate 80 coated chitosan nanoparticles (CS-NPs) using factorial design approach. This study is dedicated to the enhanced therapeutic efficacy of centrally acting analgesic through prevention of hepatic first pass metabolism, which was extended in case of model drug, thereby, reduced dosing frequency and enhanced delivery of the drug to the brain and could be viewed as an efficient form of delivering hydrophilic TPD.
Materials and methods
Materials
TPD was received as a generous gift from Cadila Healthcare Limited, Ahmadabad, India. Chitosan (degree of deacetylation 84.97%) was obtained as a gift sample from Central Institute of Fisheries Technology, Kochi, India. Tri-polyphosphate was purchased from Loba Chem. (Mumbai, India). Polysorbate 80 was procured from Merck Specialties Pvt. Ltd. (Mumbai, India). All other chemicals used for the study were of HPLC grade. Water used in all the studies was bi-distilled and filtered through 0.22 μm nylon filter before use.
Methodology
Design of experiment
A factorial design approach is useful to exploit the experimental fitness that requires minimum experiments to optimize fabricated system (Shaikh et al. Citation2013). In the present investigation, various batches of TPD loaded CS-NPs were designed based on the 23 factorial design, in order to know the effect of different variables on their properties. Based on previous literature studies, concentration of CS (X1) and concentration of TPP (X2) were identified and selected as independent variables with the rationale that amount of CS used could show a prominent effect on the particle size and entrapment efficiency of fabricated NPs, while entrapment efficiency of fabricated NPs may directly be related to the amount of cross linking agent (TPP) used. Physico-chemical properties of the produced TPD–CS-NPs, i.e., mean particle size (Y1) and entrapment efficiency (Y2) were considered as dependent variables. For each independent variable, the lower, middle, and upper levels were represented by a (−1), (0), and (+1) sign, respectively, as summarized in .
Table 1. Composition of factorial layouts using 23 full factorial designs.
Fabrication of polysorbate 80 coated TPD–CS-NPs
The method for preparation of polysorbate 80 coated TPD loaded CS-NP was adapted from a previously described ionic gelation technique with slight modification (Gan et al. Citation2005, Liu and Gao Citation2009). Based on the primary experimentation, concentration of CS and concentration of TPP were identified as a key factor to have prominent effect on the PS and EE. Moreover, optimization with the identified factors was performed using 23 factorial designs, as shown in . Briefly chitosan solution (2 mg/mL) was prepared by dissolving chitosan in 3% (w/v) acetic acid solution and kept under stirring overnight at room temperature. A known quantity of TPD was added to the above solution with constant stirring. TPP (1.5 mg/mL) was added drop wise to the TPD–CS mixture with continuous stirring leading to formation of nanoparticles due to ionic interaction between positively charged CS and negatively charged TPP thereby encapsulating TPD in polymeric matrix of cross-linked CS. A non-ionic surfactant polysorbate 80 (1%) was added meanwhile during the addition of TPP in TPD–CS solution with continuous stirring. Subsequently, the dispersion was centrifuged at 15,000 rpm for 60 min at 10 °C so as to collect nanoparticles as pellets. The collected pellets were washed and re-dispersed in 20 mL of deionized water and sonicated using probe sonicator for 2 min. Two milliliters of this suspension was further diluted 10 times, sonicated, and used for the determination of particle size and zeta potential. The undiluted nanoparticles were lyophilized using Lyophilizer (Bioasset, Virar, India) after adding d-mannitol (5%) as a cryoprotectant. The cryoprotectant was essential to prevent particle aggregation during lyophilization, which upon reconstitution offers improved re-dispersibility, injectability, and syringeability. Various batches were fabricated employing variable concentrations of CS and TPP ().
Particle size and polydispersity index (PDI)
Particle size and PDI of fabricated NPs were determined by photon correlation spectroscopy (PCS) using a Zetasizer (Nano ZS 90, Malvern Instruments, Worcestershire, UK). The NPs were diluted with double-distilled water to get optimum 50–200 kilo counts per second (kcps) for measurements. All measurements were performed at 25 °C, at a scattering angle of 90°. Values of particle size are presented as mean ± standard deviation (SD) from three replicate samples. The intensity weighed mean diameter of the bulk population of particles was given by z-average diameter and width of size distribution was characterized by the PDI.
Determination of zeta potential (ZP)
The ZP is a very useful parameter for evaluating the stability of any colloidal system. The ZP of fabricated NPs was measured by determining the electrophoretic mobility using the Malvern Zetasizer (Nano ZS 90, Malvern Ltd., UK). The measurements were performed in double-distilled water. The applied field strength was 20 V/cm and the average of the zeta potential was given from 30 runs (Kumar et al. Citation2007).
Entrapment efficiency (EE %)
The EE % was calculated by determining the amount of non-encapsulated TPD in the aqueous solution. The aqueous medium was separated by using the cooling centrifuge (Remi Instruments Ltd., Mumbai, India). A known dilution of each drug-loaded NPs sample was placed in Eppendorf tubes and centrifuged at 15,000 rpm for 30 min at 4 °C. The concentration of free TPD in the aqueous phase was determined using UV–visible spectrophotometer (UV 1700, Shimadzu, Japan) at 272 nm. Values of EE % were calculated using EquationEquation 1(1) , shown below (Varshosaz et al. Citation2010).
(1)
Scanning electron microscopy (FE-SEM)
The shape and surface morphology of lyophilized TPD–CS-NPs were observed by field emission SEM (FE-SEM) (Hitachi, Tokyo, Japan) equipped with a backscattered electron detector at 15–30 kV. Freeze dried samples of optimized TPD–CS-NPs were dusted onto double-sided tape on an aluminum stub and coated with gold using a cold sputter coater in the SEM chamber to a thickness of 400 Å, and then photomicrographs were captured by operating at an accelerating voltage of 15–30 kV electron beam.
Differential scanning calorimetric (DSC) studies
The DSC analysis was performed using differential scanning calorimeter (DSC 1 STARe System, Mettler-Toledo, Switzerland) at a heating rate of 10 °C/min in the range of 40–300 °C. This study was conducted for pure TPD, CS, and lyophilized TPD–CS-NPs of the optimized batch.
In vitro drug release study
In vitro drug release study from the optimized polysorbate 80 coated TPD–CS-NPs and uncoated TPD–CS-NPs were carried out using the equilibrium dialysis technique at 37 ± 1 °C. Nanoparticles (equivalent to 1 mg TPD) were suspended in 5 mL PBS (pH 7.4) and placed in a dialysis membrane bag (MW cut-off 12,000–14,000 Da: Himedia, Mumbai, India). The membrane bag containing nanoparticles suspension was placed in 300 mL PBS (pH 7.4). The agitation speed was set at 50 in order to avoid the excessive turbulence produced due to higher speed which may result in rupture of the dialysis membrane. At regular intervals, 5 mL of the aliquots was collected and replaced with an equal volume of fresh PBS to maintain the sink condition. The samples were centrifuged and the supernatant was analyzed to calculate the concentration of TPD using UV–visible spectrophotometer (UV 1700, Shimadzu, Japan) at 272 nm.
Statistical data treatment
Design-Expert software version 9 (Stat-Ease, Inc., Minneapolis, MN) was used for statistical analysis and graphical scheming. The outcomes of one-way analysis of variance (ANOVA) for the dependent variables were utilized for the selection of best-fitting model which could be considered significant for both the response variables.
Accelerated stability studies
The lyophilized powder sample of optimized nano-formulation was preferred for accelerated stability studies as per the protocol recommended by the International Conference on Harmonization (ICH) Q1A (R2). The ICH guidelines suggested long-term stability at 5 ± 3 °C and accelerated stability study at 25 ± 2 °C/60 ± 5% RH, for the products to be stored in refrigerator. Study was carried out for stability assessment of NPs at 25 ± 2 °C/60 ± 5% RH with respect to particle size and EE % (Alex et al. Citation2011). Freshly prepared lyophilized nano-formulation was filled in three different glass vials, sealed and located in stability chamber (CHM-10S, Remi Instruments. Ltd, Mumbai, India) maintained at 25 ± 2 °C/60 ± 5% RH for a period of totally three months. The dried nano-formulation samples subjected for stability test were re-dispersed in bi-distilled water and evaluated with a sampling interval of one month for particle size and EE % of the polysorbate 80 coated TPD–CS-NPs over a three month period.
In vivo pharmacodynamic studies
The pharmacodynamic study on adult Wistar rats (160–200 g) was approved by the Institutional Animal Ethical Committee of RCPIPER, Shirpur (IAEC/RCPIPER/2014–15/38) and performed in accordance by the Social Justice and Empowerment Committee for the purpose of control and supervision on animals and experiments, Ministry of Government of India. The animals were housed separately in groups of four per cage under standard laboratory conditions with alternating light and dark cycle of 12 h each with free access to food and water. The acclimatized animals were kept fasted 2 h before and after drug administration.
Eddy’s hot-plate method was employed to study the anti-nociceptive effect as per the method reported by Lalani et al. (Citation2013), which was previously described by Woolfe and Macdonald (Citation1944). The animals were divided into four groups of four animals each.
Groups for hot-plate reaction time test
Group 1 [Control]i.v.
Rats were administered normal saline and reaction time (latency) was noted. Reaction time was again examined 1 h after saline treatment.
Group 2 [Pure TPD]i.v.
Rats were administered pure TPD (4.64 mg/kg) and reaction time (latency) was noted.
Group 3 [uncoated TPD–CS-NPs]i.v.
Rats were administered uncoated TPD–CS-NPs formulation (equivalent to 4.64 mg/kg TPD) for comparison and reaction time (latency) was noted.
Group 4 [polysorbate 80 coated TPD–CS-NPs]i.v.
Rats were administered polysorbate 80 coated optimized TPD–CS-NPs formulation (equivalent to 4.64 mg/kg TPD, i.v.) and reaction time (latency) was noted.
Hot-plate method
Eddy’s hot plate was maintained at a temperature of 52 ± 0.5 °C. Animals were placed on a hot-plate apparatus and surrounded by a Plexiglas wall. Latency was the time elapsed either to lick or to flinch the hind paw or jumping. A cut off time of 30 s was established. The latency to the first response of the animal was recorded as the pain response latency in seconds. Basal latency was recorded, being the mean value of six determinations before treatments. The animals which showed hind paw licking or jumping response within 6–8 s were selected. Each animal was then tested before and after 30 min, 1 h, 2 h, 4 h, 8 h, and 24 h of i.v. administration of saline, drug solution and polysorbate 80 coated CS-NPs formulations. The hot-plate responses of each rat in the drug-induced antinociception were converted to percent of maximal possible effect (% MPE) according to the following formula:
(2)
The difference between the groups was tested using ANOVA followed by Bonferroni post hoc test at the level of P < 0.05.
Results and discussions
Fabrication of polysorbate 80 coated TPD–CS-NPs
Different batches of polysorbate 80 coated, TPD loaded CS-NPs were fabricated by an ionic gelation method using 23 factorial design of experiment, identifying the influence of two independent variables, i.e., CS and TPP concentration. The fabricated batches in triplicate were evaluated for PS and EE % as dependent variables and the results were recorded as shown in .
Model optimization and data analysis for TPD–CS-NPs
By the investigation of data obtained at the last experiment, it was practical that the linear models were best-fitted for both particle size and EE %. Results of ANOVA in for dependent variables confirmed that the model was significant (P values < 0.05) for both the response variables. The values of R2, SD and % coefficient of variation are shown in .
Table 2. Summarized results of regression analysis for responses Y1 and Y2 with analysis of variance for particle size and EE %.
Effect of formulation variables on particle size of NPs
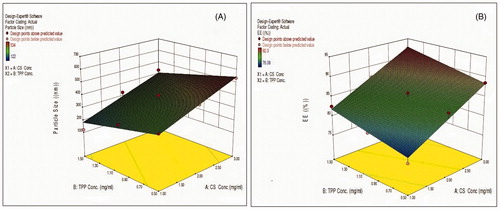
Regression coefficients for the response Y1 (particle size) are shown in EquationEquation 3(2) . It was seen that particle size was directly proportional to the concentration of CS and inversely proportional to the concentration of TPP. The relationship between variables was further elucidated using response surface plots (). The value of particle size was observed lowest for formulation CNP4, which is attributed to lower concentration of CS and maximum concentration of TPP used. EquationEquation 3
(2) indicates the effect of selected variables on response PS (Y1).
(3)
where Y1=particle size, A=CS concentration, and B=TPP concentration.
Figure 1. Response surface plots (A) for the CS concentration and TPP concentration on particle size and (B) response surface plots for the CS concentration and TPP concentration on EE %.
Effect of formulation variables on entrapment efficiency of NPs
Regression coefficients for the response Y2 (EE %) are shown in EquationEquation 4(4) . As the concentration of CS increased, entrapment efficiency was relatively increased, at the same time increased TPP concentration offered maximum encapsulation efficiency. The relationship between variables was further elucidated using response surface plot (). Highest value of EE % was observed for batch CNP7. EquationEquation 4
(4) indicates effect of selected variables on response % EE (Y2).
(4)
where Y2=entrapment efficiency, A=CS concentration, and B=TPP concentration.
Particle size, PDI, and zeta potential of TPD–CS-NPs
Results for particle size, PDI, and ZP of the polysorbate 80 coated TPD–CS-NPs are reported in . The average particle size of the total nine batches was found to be in the range of 122.5 ± (1.3) to 534.2 ± (3.8) nm. An optimized formulation depending on quantitative and sophisticated measures was chosen and formulated. The PDI values of the formulations CNP1 to CNP9 were in the range of 0.201–0.764.
The ZP is the potential at the hydrodynamic shear plane and can be estimated from the particle mobility under influence of applied electric field. The positive ZP values of all batches in the range of 16.3–47.3 mV were credited to the positively charged chitosan. The fabricated NPs exhibited average zeta potential more than 30 mV and no agglomeration of the particles was observed. Higher values of the ZP reflected electrostatic repulsion between NPs that may evade their aggregation and thereby stabilize the NP dispersion (Feng and Huang Citation2001).
Effect of chitosan concentration on the particle size
The polymer used in the present study was CS which in combination with cross-linker TPP efficiently enclosed the NPs and also stabilized the NPs dispersion. It was observed that, an increase in polymer concentration results in an increase in the particle size of TPD–CS-NPs. The increase of the particle size with concentration of CS could be attributed to the dense spatial distance among chitosan molecules at a higher concentration which resulted in the formation of larger particles (Chopra et al. Citation2012, Esmaeilzadeh-Gharedaghi et al. Citation2012).
This can be well observed from the batch CNP3 and batch CNP4. Batch CNP3 showed the highest CS concentration of 3 mg/mL and particle size of 534.2 ± (1.7) nm while in batch CNP4, the CS concentration was 1 mg/mL and particle size was 122.5 ± (3.5) nm. Thus, it proposed that with an increase in the CS concentration, the particle size increases significantly ().
Figure 2. Effect of (A) CS concentration on particle size and (B) TPP concentration on particle size.
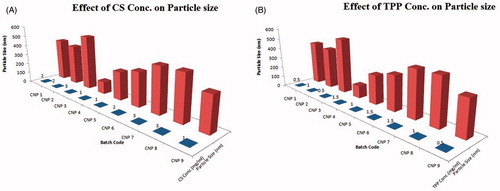
Effect of TPP concentration on particle size
The quantity of poly-anion cross-linker also effects on the particle size of fabricated NPs significantly. It was observed that, with an increase in TPP concentration, particle size of NPs was remarkably decreased. Since at higher TPP concentration, the cross-linking degree of the chitosan nanoparticles is also elevated. Moreover, the neutralization degree of the charged amino groups is concurrently enhanced, leading to weaker net charge in the particles. This will result in a more compact particle structure. Thus due to the compact structure and smaller charge repulsion, the particles prepared at a higher TPP concentration show smaller size ().
Entrapment efficiency (EE %)
The ionic gelation technique was used to prepare biodegradable nanoparticles with higher EE % by addressing the effects of formulation variables. The EE % of fabricated batches was found to be in the range of 76.08–92.3% as shown in .
Effect of CS concentration on EE%
Upon increasing CS concentration, entrapment efficiency was found to be increased, it can be attributed to increased viscosity of CS that retards the rate of diffusion. Moreover, increased particle size offers a longer path length, which results in significant reduction in the leaching rate of entrapped drug from NPs ().
Figure 3. Effect of (A) CS concentration on EE % and (B) TPP concentration on EE %.
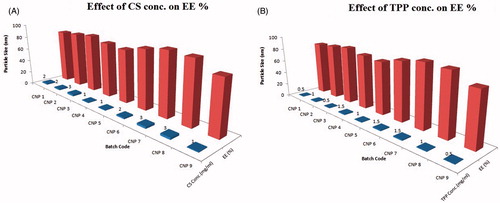
Effect of TPP concentration on EE%
The influence of TPP concentration on the EE % was found to be significant (). Higher entrapment of the drug was observed with increased concentration of TPP owing to higher possibility of linkages between cationic CS and anionic phosphates of TPP (Zhang et al. Citation2010).
In a nutshell, alteration in CS (X1) and TPP (X2) concentrations confirmed significant effect on particle size and EE%. Finally, to conclude, with the increase in CS concentration and TPP concentration, maximum entrapment of TPD in CS-NPs was observed while increasing CS and decreasing TPP concentration resulted increase in particle size.
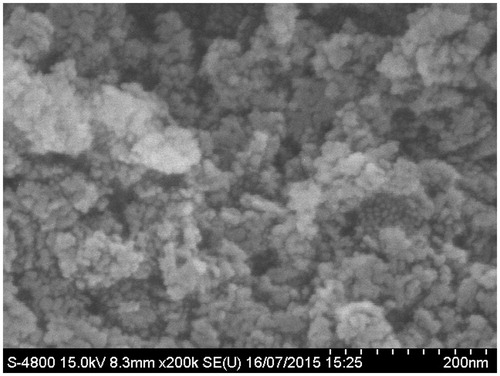
SEM studies
The optimized freeze dried sample (CNP6) of TPD–CS-NPs was subjected to SEM for evaluating the shape and surface morphology of the fabricated NPs. Fabricated NPs were found to be almost spherical in shape with smooth surfaces as shown in .
Figure 4. Scanning electron photomicrographs of TPD–CS-NPs (CNP6).
DSC studies
DSC studies were conducted to assure the absence of drug–excipients interactions. The DSC thermograms of pure TPD, CS, and TPD–CS-NPs (CNP6) are shown in , respectively. The DSC thermogram of pure TPD exhibited a sharp endothermic peak at 204.40 °C with onset of peak at 203.24 °C and endset at 206.96 °C, CS had onset at 75.64 °C, endset was seen at 133.15 °C, and peak at 106.66 °C while TPD–CS-NPs formulation had onset of peak at 199.05 °C, endset was seen at 207.11 °C, and peak at 203.66 °C.
Figure 5. DSC thermograms of (a) plain TPD, (b) CS, and (c) optimized formulation (CNP6).
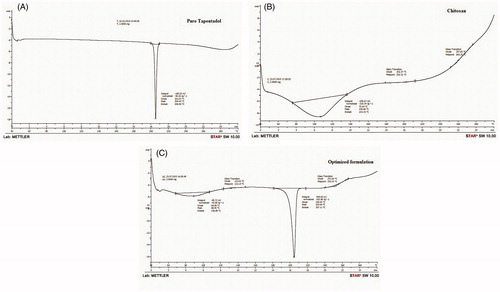
The presence of TPD peak in DSC thermogram of lyophilized NPs formulation assures molecular inclusion of TPD in the CS matrix. Finally, it could be accomplished that, there is absence of any chemical interaction between TPD and CS and also TPD may have been homogeneously dispersed in the CS matrix.
In vitro drug release study
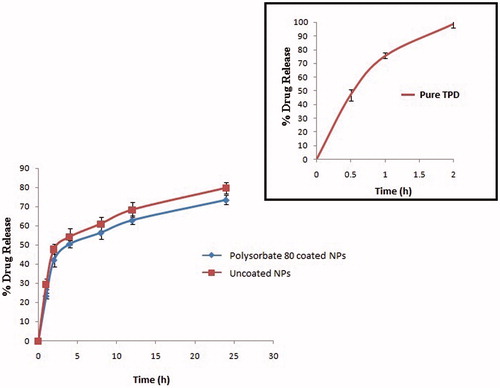
In vitro drug release of pure TPD was compared with polysorbate 80 coated optimized batches of NPs and uncoated NPs to know the influence of polysorbate 80 coating on release of TPD (). It was apparent that, pure drug was almost completely (98.9 ± 2.9%) released within 2 h of study; while drug entrapped in both coated and uncoated CS-NPs was released in sustained manner up to 24 h. As expected, the coating of polysorbate 80 on CS-NPs retarded drug release as compared to uncoated CS-NPs. The cumulative percent drug release of TPD was 79.80 ± 3.5% and 73.50 ± 2.9% from uncoated CS-NPs and coated CS-NPs, respectively, over a period of 24 h as shown in . The sustained release behavior of TPD from CS matrix is attributed to the nature of CS to sustain the release of the encapsulated drug in NPs.
Figure 6. Comparative in vitro drug release patterns of plain TPD (inset) with polysorbate 80 coated TPD–CS-NPs (n = 3, mean±SD) optimized batch CNP6 and uncoated formulation CNP6.
Accelerated stability studies
Stability study was performed on CNP6 keeping in mind PS and EE % as the evaluation parameters. From , it was obvious that, particle size was found to be increased slightly during the three months storage from 329.3 ± (1.0) nm to 341.1 ± (1.8) nm. The EE % of the CNP6 at the beginning was found to be 87.1 ± (6.1)% while after three months it was found to be 79.1 ± (3.1)% representing that the drug can retain within the NPs for the adequate time period. Above findings suggest that there were no considerable alterations in the PS and EE % of optimized batch CNP6 and they remained stable at 25 ± 2 °C/60 ± 5% RH over a period of three months.
Table 3. Stability study profiles of optimized TPD–CS-NPs (CNP6).
In vivo pharmacodynamic studies
The intent of this study was to evaluate the effect polysorbate 80 coating on the ability of the NPs to induce the antinociceptive (analgesic) effect, which would be indicative of ability to reach the CNS. A total of 16 rats were used for the above study. Among these, the mortality rate was zero. Additionally, no animal showed any kind of neurological abnormality.
Effect of various treatments on latency of rats by hot-plate method
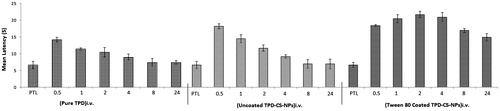
The effect of administration of various treatments on latency of rats in hot-plate test is shown in . The groups treated with TPD (5 mg/kg, i.v.) were not statistically different from the levels of the saline treated rats in terms of the latency time when pre- and post-treatment latencies were compared. The polysorbate 80 coated TPD–CS-NPs showed higher withdrawal latencies at all-time points against uncoated, saline treated, and drug treated groups. Moreover, the antinociceptive effect of polysorbate 80 coated TPD–CS-NPs was sustained for period of 24 h in comparison to uncoated TPD–CS-NPs, and may be attributed to roll of polysorbate in targeting of nanoparticles to brain.
Figure 7. Influence on paw withdrawal latency measured in hot-plate method by i.v. administration of pure TPD, uncoated TPD–CS-NPs and polysorbate 80 coated TPD–CS-NPs. The data are expressed as mean of six experiments ± SEM (bars) and were analyzed by means of ANOVA followed by Bonferroni post hoc test for multiple comparisons. At each time points every group is significantly different from other groups; some exceptions were recognized, namely at 0.5 h uncoated TPD–CS-NPs vs. polysorbate 80 coated TPD–CS-NPs; at 2 h standard (TPD) vs. uncoated TPD–CS-NPs; at 4 h standard (TPD) vs. uncoated TPD–CS-NPs; at 24 h standard (TPD) vs. uncoated TPD–CS-NPs, PTL stands for pre-treatment latency.
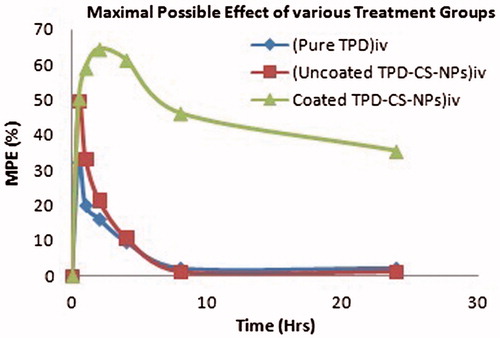
The response obtained by converting the paw withdrawal latency into % MPE is shown in . Polysorbate 80 coated TPD–CS-NPs showed MPE up to 64.5% after 2 h of administration and antinociceptive effect was sustained for a period of 24 h. The antinociceptive effect of polysorbate 80 coated TPD–CS-NPs as demonstrated by MPE was significantly greater than uncoated TPD–CS-NPs and pure TPD solution at all-time points tested. Therefore, polysorbate 80 coating on nanoparticles resulted in modification of intensity and extent of the antinociceptive effect which suggested the applicability of polysorbate 80 coated chitosan nanoparticles for brain targeting of many drugs.
Figure 8. Antinociceptive effect (%MPE) exerted by i.v. administration of TPD, uncoated TPD–CS-NPs, and polysorbate 80 coated TPD–CS-NPs in rats. The data are expressed as mean of six experiments ± SEM (bars) and were analyzed by means of ANOVA followed by Bonferroni post hoc test for multiple comparisons. At each time points every group is significantly different from other groups; some exception were recognized, namely at 0.5 h uncoated TPD–CS-NPs vs. polysorbate 80 coated TPD–CS-NPs; at 4 h standard (TPD) vs. uncoated TPD–CS-NPs; at 8 h standard (TPD) vs. Uncoated TPD–CS-NPs; at 24 h uncoated TPD–CS-NPs.
Conclusion
The present study anticipated a novel nanoparticulate formulation of TPD. The effect of two variables (CS concentration and TPP concentration) on two dependent variables (particle size and drug entrapment efficiency) was examined using 23 factorial designs and an optimized batch was fabricated without utilizing any organic solvent. The observed physicochemical parameters were found to be satisfactory when compared with software predicted values. It was concluded that the ionic gelation technique proved rational for efficient loading of TPD in CS-NPs. The spherical shape and smooth morphology of fabricated NPs are the result of surface adaptation imparted by polysorbate 80, which is confirmed after SEM analysis. The fabricated NPs showed sustained release of drug for 24 h and may be useful to minimize the side effects related to the conventional cure by reducing the number of required daily doses, hence imparting conformity and resolving peak-to-valley fluctuations. Thermal analysis authenticated entrapment of TPD in the CS matrix as well as the absence of any chemical interaction between them. The optimized NPs were found thermodynamically stable in freeze-dried state at 25 ± 2 °C/60 ± 5% RH for a total period of three months. Furthermore, administration of polysorbate 80 coated TPD–CS-NPs significantly showed central antinociceptive activity in the rat models of acute pain over a period of 24 h. This may be correlated to enhanced concentration of the drug inside the brain due to polysorbate 80 coating on nanoparticles. The results showed a faithful possibility polysorbate 80 coated nanoparticles to be utilized as a platform technology for the development and targeting of various natural and synthetic molecules to the brain to improve their efficacy in various CNS disorders. Moreover to elaborate neuroprotective effect of fabricated formulation, extensive pharmacokinetic and clinical studies need to be tailored so as to explore the investigated NPs to promote scale up for the marketplace.
Acknowledgements
The authors are grateful to All India Council for Technical Education (AICTE), New Delhi for providing financial assistance under Research Promotion Scheme (8-133/RIFD/RPS/POLICY-3/2013-14) to carry out the above work. We are thankful to Dr. H.S. Mahajan, HOD, Department of Pharmaceutics, RCPIPER Shirpur for his kind help and guidance to perform this study. The authors are thankful to Cadila Pharmaceuticals Ltd., Ahmadabad, India and Central Institute of Fisheries Technology, Kochi, India for providing the gift samples of TPD and chitosan, respectively. The facilities provided by the management and principal of H.R. Patel Institute of Pharmaceutical Education and Research, cannot be left unacknowledged.
Disclosure statement
The authors report no conflicts of interest. The authors alone are responsible for the content and writing of the paper.
References
- Alex MA, Chacko A, Jose S, Souto E. 2011. Lopinavir loaded solid lipid nanoparticles (SLN) for intestinal lymphatic targeting. Eur J Pharm Sci. 42:11–18.
- Ariga K, Ji Q, McShane MJ, Lvov YM, Vinu A, Hill JP. 2011. Inorganic nanoarchitectonics for biological applications. Chem Mater. 24:728–737.
- Chopra M, Kaur P, Bernela M, Thakur R. 2012. Synthesis and optimization of streptomycin loaded chitosan-alginate nanoparticles. Int J Sci Technol Res. 1:31–34.
- Esmaeilzadeh-Gharedaghi E, Faramarzi MA, Amini MA, Rouholamini Najafabadi A, Rezayat SM, Amani A. 2012. Effects of processing parameters on particle size of ultrasound prepared chitosan nanoparticles: an Artificial Neural Networks Study. Pharm Dev Technol. 17:638–647.
- Feng SS, Huang G. 2001. Effects of emulsifiers on the controlled release of paclitaxel (Taxol) from nanospheres of biodegradable polymers. J Control Release. 71:53–69.
- Gabathuler R. 2010. Approaches to transport therapeutic drugs across the blood–brain barrier to treat brain diseases. Neurobiol Dis. 37:48–57.
- Gan Q, Wang T, Cochrane C, McCarron P. 2005. Modulation of surface charge, particle size and morphological properties of chitosan-TPP nanoparticles intended for gene delivery. Colloids Surf B Biointerfaces. 44:65–73.
- Honjo K, Black SE, Verhoeff NP. 2012. Alzheimer’s disease, cerebrovascular disease, and the β-amyloid cascade. Can J Neurol Sci. 39:712–728.
- Kumar VV, Chandrasekar D, Ramakrishna S, Kishan V, Rao YM, Diwan PV. 2007. Development and evaluation of nitrendipine loaded solid lipid nanoparticles: influence of wax and glyceride lipids on plasma pharmacokinetics. Int J Pharm. 335:167–175.
- Lalani J, Rathi M, Lalan M, Misra A. 2013. Protein functionalized tramadol-loaded PLGA nanoparticles: preparation, optimization, stability and pharmacodynamic studies. Drug Dev Ind Pharm. 39:854–864.
- Liu H, Gao C. 2009. Preparation and properties of ionically cross‐linked chitosan nanoparticles. Polym Adv Technol. 20:613–619.
- Nadkarni SS, Abraham J, Khatri K, Mittal V. 2012. Pharmaceutical invention of tapentadol. Google Patents.
- Patel MM, Goyal BR, Bhadada SV, Bhatt JS, Amin AF. 2009. Getting into the brain: approaches to enhance brain drug delivery. CNS Drugs. 23:35–58.
- Patil GB, Surana SJ. 2013. Fabrication and statistical optimization of surface engineered PLGA nanoparticles for naso-brain delivery of ropinirole hydrochloride: in-vitro–ex-vivo studies. J Biomater Sci Polym Ed. 24:1740–1756.
- Prabhakar K, Afzal SM, Surender G, Kishan V. 2013. Tween 80 containing lipid nanoemulsions for delivery of indinavir to brain. Acta Pharm Sin B. 3:345–353.
- Shaikh W, Deshmukh PK, Patil GB, Chatap VK, Bari SB. 2013. Design and statistical optimization of osmotically driven capsule based on push-pull technology. Pharm Dev Technol. 18:515–524.
- Somogyi AA, Barratt DT, Coller JK. 2007. Pharmacogenetics of opioids. Clin Pharmacol Ther. 81:429–444.
- Strickley RG. 2004. Solubilizing excipients in oral and injectable formulations. Pharm Res. 21:201–230.
- Varshosaz J, Tabbakhian M, Mohammadi MY. 2010. Formulation and optimization of solid lipid nanoparticles of buspirone HCl for enhancement of its oral bioavailability. J Liposome Res. 20:286–296.
- Woolfe G, MacDonald A. 1944. The evaluation of the analgesic action of pethidine hydrochloride (Demerol). J Pharmacol Exp Ther. 80:300–307.
- Zhang X, Liu J, Qiao H, Liu H, Ni J, Zhang W, Shi Y. 2010. Formulation optimization of dihydroartemisinin nanostructured lipid carrier using response surface methodology. Powder Technol. 197:120–128.