Abstract
Abstract
Objectives: The first objective was to assess the effect of the chondroitin 4 and 6 sulphate (CS) on health-related quality of life using utility values in patients with knee osteoarthritis (OA) during a 24-month treatment course. The second objective was, using these data, to conduct economic analyses.
Methods: Data from the STOPP study was used. This study was a randomised, double-blind, placebo (PL) -controlled trial of 2-year duration. In the STOPP study, authors assessed quality of life using the Western Ontario and McMaster Osteoarthritis Index (WOMAC). WOMAC scores were translated into Health Utility Index (HUI) scores using a specific formula. Incremental cost effectiveness ratio (ICER) was calculated taking into account the cost of CS and its effect on HUI scores, compared to PL.
Results: At baseline, the mean (SD) HUI scores were 0.59 (0.17), and 0.59 (0.18) for the PL and CS groups, respectively (p=0.31 between the two groups). The mean (SD) HUI scores changes from baseline to 6 months were 0.02 (0.02), and 0.05 (0.01) for the PL and CS groups, respectively (p=0.03). After 24 months of follow-up, HUI score increases by 0.04 (0.02) in the PL group and by 0.05 (0.02) in the CS group (p=0.37). Using the price bracket of CS in Europe, ICER assessment always resulted in a cost below €30,000 per QALY gained, after 6, 12 and 24 months of treatment.
Conclusion: CS treatment increases health utilities in patients with knee OA compared to PL over the first 6 months of treatment. Economic evaluation based on these data suggests that CS treatment could be considered as cost-effective in patients with knee OA up to a period of 24 months. A limitation in this study is the absence of direct utility assessment as well as the absence of effective treatment as comparator.
Introduction
Many pharmacological treatments, including acetaminophen, non-steroidal anti-inflammatory drugs, or slow-acting drugs are currently available for patients with knee or hip osteoarthritis (OA), with symptom reduction as primary objective. These treatments, and sometimes their adverse events, have a cost. In most countries, it is presumed that good care is influenced by the funds availableCitation1. Therefore, in the context of health economics, it is essential to develop effective treatments and efficient strategies.
In a world with limited resources and healthcare budgets, it is important to efficiently allocate scarce resources. Economic evaluation, in OA, could be of particular interest for this purposeCitation2. Unfortunately, although health economic analyses have widely been used in other diseases, relatively few data are available in OA. This could partly be because the most interesting information (e.g., utility, quality-adjusted life-year) have not frequently been collected in OA trialsCitation3. On the other hand, the cost-effectiveness evaluations in OA (e.g., difference between anti-inflammatory drugs or between various surgeries) using Markov models mainly take into account adverse events, assuming an equal symptomatic effect between treatmentsCitation4–12.
Chondroitin sulphate (CS) is a major component of the extracellular matrix from many connective tissues, including but not limited to cartilage, bone, skin, ligaments and tendons. In the articular cartilage, the high content of CS in the aggrecan plays a major role in creating considerable osmotic swelling pressure that expands the matrix and places the collagen network under tension. Several clinical trials have investigated the clinical effects of the administration of CS to patients with OACitation13. The results of these studies have been reviewed by scientific experts who concluded that CS could be an effective symptomatic treatment in OACitation14–16.
Recently, a large randomised, double-blind, placebo (PL) controlled trial of 2-year duration, assessing patients with knee OA was publishedCitation17. In this trial, long-term combined structure-modifying (i.e., X-ray) and symptom-modifying (i.e., Western Ontario and McMaster Osteoarthritis Index: WOMAC) effects of CS suggest that it could be a disease-modifying agent in patients with knee OA. Using this trial, the first objective of the present study was to assess the effect of CS on health-related quality of life using utility value during the 24-month treatment course. The second objective was, based on these data, to conduct an economic analysis.
Methods
Data from the STOPP study was used. STOPP was an international, randomised, double-blind, placebo-controlled trial in which 622 patients with knee OA were randomly assigned to receive either 800 mg CS (n=309 patients) or placebo (PL) (n=313 patients) once daily for 2 yearsCitation17. Patients were allowed to take acetaminophen in 500-mg tablets (maximum dosage 4 g/day) for rescue analgesia and non-steroidal anti-inflammatory drugs were allowed in cases of acute pain.
Symptoms of OA were assessed by the patient's estimate of pain during the previous 48 hours, using the WOMAC. The visual analogue scale (VAS) version of the WOMAC index was used, with the patient answering each question using a 100-mm VAS. WOMAC scores were translated into Health Utility Index (HUI) scores using the previously validated formula of Grootendorst et al Citation18. Grootendorst has developed and estimated a prediction model using linear regression to map the WOMAC along with basic demographic and OA disease severity data into HUI utility scores. The HUI is a commonly used generic preference-based instrument to measure utility. The formula used is:
Predicted HUI utility score = 0.5274776 + 0.0079767 × Pain +.0065111 × Stiffness -0.0059571 × Function + 0.0019928 × Pain × Stiffness + 0.0010734 × Pain × Function + 0.0001018 × Stiffness × Function – 0.0030813 × Pain2 – 0.0016583 × Stiffness2 – 0.000243 × Function2 + 0.0113565 × Age in years – 0.0000961 × Age in years2 – 0.0172294 × Female – 0.0057865 × Years since onset of OA in the study knee + 0.0001609 × Years since onset of OA in the study knee2
Subsequently, the utility estimates were used to calculate the quality-adjusted life-years (QALY) using the area-under-the-curve method, that is, the weighted average of time spent in the study and utility value.
Taking into account the cost of the CS and its effect on HUI scores, compared to PL, it has been possible to assess the incremental cost effectiveness ratio (ICER), i.e. a measure of the additional cost per unit of health gain. The underlying calculation for the ICER comparing CS versus PL in patients with knee OA was:
where costs were measured in euros and effects were measured in QALY.
Finally, the ICERs were calculated using the minimum (€0.99/day) and maximum (€1.59/day) public costs of the branded CS treatment in Europe. Other healthcare costs and non-healthcare cost were assumed to be comparable between treatment groups.
Results
The mean baseline characteristics of the study population are summarised in . No significant difference was observed for any baseline characteristics between the CS and PL groups. Regarding utility value at baseline, the mean (SD) HUI scores were 0.59 (0.17), and 0.59 (0.18) for the PL and CS groups, respectively (p=0.31 between the two groups).
Table 1. Baseline characteristics of the study population.
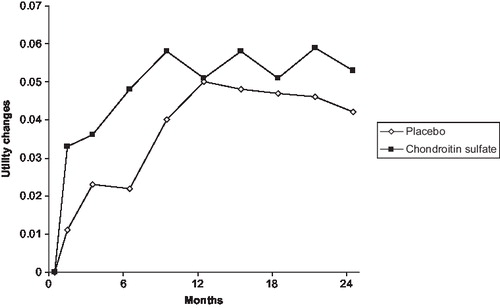
After 6 months of follow-up, the mean (SD) HUI scores changes from baseline were 0.02 (0.02), and 0.05 (0.01) for the PL and CS groups, respectively (p=0.03). After 24 months of follow-up, HUI score increases by 0.04 (0.02) in the PL group and by 0.05 (0.02) in the CS group (p=0.37).
In the CS group, the number of QALY gained after 6 months of follow-up were 0.018, 0.044 and 0.097 after 6, 12 and 24 months, respectively (). In the placebo group, the respective QALY gains were 0.007, 0.026 and 0.072 ().
Figure 1. Utility changes during the 2 years of follow-up.
The ICER is shown in . Using either the minimal or the maximal price of CS in Europe, ICER assessment was always below an absolute threshold of €30,000/QALY, after 6, 12 and 24 months of treatment, compared to PL.
Table 2. Incremental cost-effectiveness ratio assessment.
Discussion
In this study, a statistically significant difference in terms of mean utility changes from baseline to 6 months between the CS and the PL groups was observed. No significant change after 24 months was observed. The results are comparable to the original trial results that showed a significantly faster improvement in pain in the CS group as compared to the placebo group during the first 9 monthsCitation17. In contrast, no significant difference in pain between the two groups was observed during the second year. The main explanation, as acknowledged by the authors, for these variations is that since a significant proportion of patients had no or mild symptoms at 1 year (because of the treatment or the placebo effects), a further symptomatic effect of CS was unlikely to be observedCitation17.
The estimated ICER, using either the minimal or the maximal cost of branded CS in Europe, was around or less than €20,000/QALY. These results could be observed as early as the first 6 months of treatment and up to 2 years of follow-up. Using an incremental cost-effectiveness plane, the estimated ICER falls in the northeast quadrant, hence suggesting that trade-offs between costs and effects need to be considered. Such trade-offs depend upon the value at which the ICER is considered good value for money. Is €20,000/QALY a good value for money? There is no absolute answer. The decision-making process is multifactorial and depends on many elements other than efficiency, such as budget impact or preferences. Some countries have defined explicit ICER thresholds. For example, the UK currently uses an explicit threshold value of £20,000 (approximately €23,500) or £30,000 (approximately €35,000) per QALY gainedCitation19.
The structure-modifying effect of CS has not been taken into account in this study. Indeed, in the original study, the analysis demonstrated a significant reduction (p<0.0001) in minimum joint space narrowing in the CS group compared to the PL groupCitation17. Given the absence of a robust association between X-ray and symptom changesCitation20–23, these results could hardly be used, as they state now, in economic evaluation. However, it should be acknowledged that some data showed that a higher decrease in joint space width or a greater loss of cartilage over time is associated with an increase need for joint surgeryCitation24,25. Further studies are needed before including structural change in pharmaco-economic models.
One of the strengths of this study is the design (i.e., RCT) in which patients were rigorously followed, providing reliable and accurate data (e.g., WOMAC). However, such design is also a weakness since compliance to treatment is higher in RCTs than in a real life setting. The international aspect of this study (i.e., that includes patients from France, Belgium, Switzerland, Austria, and the US) makes the results applicable for different countries. However, the international design has also limitation (i.e., loss of power when it comes to single country analysis, lack of homogeneity due to the combination of data from several countries). Sensitivity analysis, incorporating price bracket for CS on the European market has been performed. It should be acknowledged that utility scores were not directly measured but calculated. Moreover, HUI is only an indirect calculation of utilities. As a consequence, there might be a loss of precision. The methodology used to estimate utility from the WOMAC score has been proposed by Grootendorst in 2007Citation18. The external validity of this prediction model has been reported in a recent publicationCitation26. Moreover, these two reports clearly state that this prediction model can be used to calculate QALYs for cost-effectiveness analysisCitation18,26. A recent paper from Barton et al Citation27 suggests that the actual QALY could differ from those predicted on the basis of mapping (e.g., with the Grootendorst estimation). They compare the QALY gains, and incremental cost per QALY estimates, predicted on the basis of mapping to those based on actual EQ-5D scores of four different interventions in 389 individuals. They show that the most effective intervention was estimated to be associated with an incremental cost per QALY of £6,068, according to our preferred model, compared to £13,154 when actual data was used. Two remarks have to be made. The first is that the model recommended by Grootendorst (that was used in the current economic analysis) has not been used in the Baron paper because of the absence of useful data (e.g., time since the onset of osteoarthritis). The second point is that Grootendorst uses the WOMAC to assess utility score based on the Health Utilities Index Mark 3 (HUI3). In the Baron paper, the Grootendorst model has been used to compare estimated utility (based on HUI3) with actual utility based on EQ-5D. Another limitation is that the costs used for CS were the minimum daily costs to the public of the prescription drug in Switzerland and the maximum price in Austria. It would certainly be of interest to reproduce these analyses using the utility data and the costs of drugs country by country. Unfortunately, even if this study was international, the power of the trial would be reduced if we stratify the analysis country by country. It should also be acknowledged that these economic analyses should be considered as preliminary. As a matter of fact, a microsimulation model, taking into account adverse events or cost related to treatment strategies, should be developed and could provide new useful information. In the present analysis, no accurate compliance data was available and, added to the absence of a third group receiving traditional treatment, it has been impossible to perform bootstrapping analysis that would have been useful to better interpret the results. It should also be pointed out that these economic analyses are based on one single trial and that other studies and meta-analysis have been published on the clinical efficacy of CS. At least, the original study used a CS preparation that has been approved as a prescription drug. Therefore, the results of the current study cannot be generalised to other CS products such as those available in some countries as dietary supplements.
Conclusion
In conclusion, CS seems to be cost-effective compared to placebo but other pharmaco-economic evaluations should be performed to confirm these preliminary results.
Acknowledgement
Declaration of interest: This study was funded by a grants from the European Society for Clinical and Economical Aspect of Osteoarthritis and Osteoporosis (ESCEO)-Amgen and IBSA Institut Biochimique SA, Lugano, Switzerland. O.B. has disclosed that he has received lecture fees from IBSA. JYR has received consulting fees and lecture fees from IBSA. SS, AN, MH, and AA have disclosed they have no relevant financial relationships. The funding agencies had no role in the design and conduct of the study, in the collection, management, analysis, and interpretation of the data, in the preparation or approval of the manuscript or in the decision to submit the manuscript for publication.
References
- Andrews G, Simonella L, Lapsley H, Evidence-based medicine is affordable: the cost-effectiveness of current compared with optimal treatment in rheumatoid and osteoarthritis. J Rheumatol 2006;33:671-80.
- Bruyere O, Reginster JY. The need for economic evaluation in osteoarthritis. Aging Health 2009;5:591-4.
- Ruchlin HS, Insinga RP. A review of health-utility data for osteoarthritis: implications for clinical trial-based evaluation. Pharmacoeconomics 2008;26:925-35.
- Marshall JK, Pellissier JM, Attard CL, Incremental cost-effectiveness analysis comparing rofecoxib with nonselective NSAIDs in osteoarthritis: Ontario Ministry of Health perspective. Pharmacoeconomics 2001;19:1039-49.
- Contreras-Hernandez I, Mould-Quevedo JF, Torres-Gonzalez R, Cost-effectiveness analysis for joint pain treatment in patients with osteoarthritis treated at the Instituto Mexicano del Seguro Social (IMSS): Comparison of nonsteroidal anti-inflammatory drugs (NSAIDs) vs. cyclooxygenase-2 selective inhibitors. Cost Eff Resour Alloc 2008;6:21.
- Koskinen E, Eskelinen A, Paavolainen P, Comparison of survival and cost-effectiveness between unicondylar arthroplasty and total knee arthroplasty in patients with primary osteoarthritis: a follow-up study of 50,493 knee replacements from the Finnish Arthroplasty Register. Acta Orthop 2008;79:499-507.
- Soohoo NF, Sharifi H, Kominski G, Cost-effectiveness analysis of unicompartmental knee arthroplasty as an alternative to total knee arthroplasty for unicompartmental osteoarthritis. J Bone Joint Surg Am 2006;88:1975-82.
- Moore A, Phillips C, Hunsche E, Economic evaluation of etoricoxib versus non-selective NSAIDs in the treatment of osteoarthritis and rheumatoid arthritis patients in the UK. Pharmacoeconomics 2004;22:643-60.
- Tavakoli M. Modelling therapeutic strategies in the treatment of osteoarthritis: an economic evaluation of meloxicam versus diclofenac and piroxicam. Pharmacoeconomics 2003;21:443-54.
- Al MJ, Maniadakis N, Grijseels EW, Janssen M. Costs and effects of various analgesic treatments for patients with rheumatoid arthritis and osteoarthritis in the Netherlands. Value Health 2008;11:589-99.
- Loyd M, Rublee D, Jacobs P. An economic model of long-term use of celecoxib in patients with osteoarthritis. BMC Gastroenterol 2007;7:25.
- Kamath CC, Kremers HM, Vanness DJ, The cost-effectiveness of acetaminophen, NSAIDs, and selective COX-2 inhibitors in the treatment of symptomatic knee osteoarthritis. Value Health 2003;6:144-57.
- Bruyere O, Reginster JY. Glucosamine and chondroitin sulfate as therapeutic agents for knee and hip osteoarthritis. Drugs Aging 2007;24:573-80.
- Bruyere O, Burlet N, Delmas PD, Evaluation of symptomatic slow-acting drugs in osteoarthritis using the GRADE system. BMC Musculoskelet Disord 2008;9:165.
- Zhang W, Moskowitz RW, Nuki G, OARSI recommendations for the management of hip and knee osteoarthritis, Part II: OARSI evidence-based, expert consensus guidelines. Osteoarthritis Cartilage 2008;16:137-62.
- Jordan KM, Arden NK, Doherty M, EULAR Recommendations 2003: an evidence based approach to the management of knee osteoarthritis: Report of a Task Force of the Standing Committee for International Clinical Studies Including Therapeutic Trials (ESCISIT). Ann Rheum Dis 2003;62:1145-55.
- Kahan A, Uebelhart D, De Vathaire F, Long-term effects of chondroitins 4 and 6 sulfate on knee osteoarthritis: the study on osteoarthritis progression prevention, a two-year, randomized, double-blind, placebo-controlled trial. Arthritis Rheum 2009;60:524-33.
- Grootendorst P, Marshall D, Pericak D, A model to estimate health utilities index mark 3 utility scores from WOMAC index scores in patients with osteoarthritis of the knee. J Rheumatol 2007;34:534-42.
- Raftery J. NICE: faster access to modern treatments? Analysis of guidance on health technologies. Br Med J 2001;323:1300-3.
- Bruyere O, Honore A, Rovati LC, Radiologic features poorly predict clinical outcomes in knee osteoarthritis. Scand J Rheumatol 2002;31:13-16.
- Dieppe PA. Why is there such a poor correlation between radiographic joint damage and both symptoms and functional impairment in osteoarthritis? Br J Rheumatol 1989;28:242.
- Duncan R, Peat G, Thomas E, Symptoms and radiographic osteoarthritis: not as discordant as they are made out to be? Ann Rheum Dis 2007;66:86-91.
- Pattrick M, Hamilton E, Wilson R, Association of radiographic changes of osteoarthritis, symptoms, and synovial fluid particles in 300 knees. Ann Rheum Dis 1993;52:97-103.
- Cicuttini FM, Jones G, Forbes A, Rate of cartilage loss at two years predicts subsequent total knee arthroplasty: a prospective study. Ann Rheum Dis 2004;63:1124-7.
- Bruyere O, Richy F, Reginster JY. Three year joint space narrowing predicts long term incidence of knee surgery in patients with osteoarthritis: an eight year prospective follow up study. Ann Rheum Dis 2005;64:1727-30.
- Marshall D, Pericak D, Grootendorst P, Validation of a prediction model to estimate health utilities index Mark 3 utility scores from WOMAC index scores in patients with osteoarthritis of the hip. Value Health 2008;11:470-7.
- Barton GR, Sach TH, Jenkinson C, Do estimates of cost-utility based on the EQ 5D differ from those based on the mapping of utility scores? Health Qual Life Outcomes 2008;6:51.