Abstract
Objective:
This study assessed the long-term cost effectiveness of rosuvastatin therapy compared with placebo in reducing the incidence of major cardiovascular (CVD) events and mortality.
Methods:
A probabilistic Monte Carlo simulation model estimated long-term cost effectiveness of rosuvastatin therapy (20 mg daily) for the prevention of CVD mortality and morbidity. The model included three stages: (1) CVD prevention simulating the 4 years of the JUPITER trial, (2) initial CVD prevention beyond the trial, and (3) subsequent CVD event prevention. A US payer perspective was assessed reflecting direct medical costs, and up to a lifetime horizon. Sensitivity analyses tested the robustness of the model estimates.
Results:
For a hypothetical cohort of 100,000 patients at moderate and high risk of CVD events based on Framingham risk of ≥10%, estimated quality-adjusted life-years (QALYs) gained with rosuvastatin therapy compared with placebo was 33,480 over a lifetime horizon, and 25,380 and 9916 over 20-year and 10-year horizons, respectively. Approximately 12,073 events were avoided over the lifetime; 6,146 non-fatal MIs, 2905 non-fatal strokes, and 4030 CVD deaths avoided. Estimated incremental cost-effectiveness ratio (ICER) for cost per QALY was $7062 (lifetime), $10,743 (20-year horizon), and $44,466 (10-year horizon). For a hypothetical cohort similar to the overall JUPITER population, the cost per QALY ICER was $11,025 for the lifetime and $60,112 for a 10-year horizon.
Limitations:
The cost-effectiveness comparison of rosuvastatin 20 mg was against no active treatment (as opposed to an alternative statin) due to lack of comparative cardiovascular morbidity and mortality risk reduction data for other statins in a population similar to the JUPITER trial population. The analysis was conducted from the payer perspective and lack of inclusion of indirect costs limit interpretability of results from a societal perspective.
Conclusions:
Treatment with rosuvastatin 20 mg daily, is a cost-effective treatment alternative to no treatment in patients at a higher risk (Framingham risk ≥10%) of CVD.
Introduction
Prevention of myocardial infarction, stroke, and death from cardiovascular disease (CVD) has been the goal of CVD treatment for decades. Current treatment guidelines, including National Cholesterol Education Program (NCEP) Adult Treatment Panel (ATP) III and updates, recommend statin therapy for patients with established vascular disease, diabetes, and hyperlipidemiaCitation1,Citation2. However, approximately half of all myocardial infarctions (MI) and strokes occur among individuals with low-density lipoprotein cholesterol (LDL-C) levels below recommended thresholds for drug treatmentCitation3.
A recent clinical trial, Justification for the Use of statins in Prevention: an Intervention Trial Evaluating Rosuvastatin (JUPITER), demonstrated that rosuvastatin 20 mg significantly reduced the incidence of major cardiovascular events and all-cause mortality among individuals without hyperlipidemia but with elevated high-sensitivity C-reactive protein (hsCRP) levelsCitation4. These effects were similar in all subgroups, including patients at intermediate and high CHD risk (at-risk; based on the Framingham risk scores ≥10%) in the JUPITER trial.
The objective of this study was to estimate the long-term cost effectiveness of rosuvastatin therapy compared with placebo in reducing major cardiovascular events and mortality using the JUPITER trial results, projected over a long-term time horizon in patients with higher baseline cardiovascular risk. As delineated in current guidelines for cost-effectiveness analyses (CEA), a long-term time horizon is needed to capture the full costs and clinical effects of treatment for chronic conditionsCitation5. Current guidelines for CEA also recommend using multiple time horizons for analysesCitation5, given the need to model long-term consequences of treatment. For the analyses presented here, lifetime, 20-year and 10-year time horizons were included. The Framingham risk categories used correspond to estimates of 10-year risk of major CHD events.
Methods
In this study, rosuvastatin 20 mg was compared with a no active treatment option reflecting the design of the JUPITER study and a patient population similar to the JUPITER trial enrolled population. The model used the placebo-controlled JUPITER trial findings to estimate the cost effectiveness of rosuvastatin 20 mg compared to no active treatment.
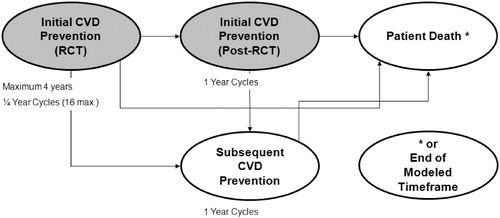
A probabilistic Monte Carlo micro-simulation model was constructed to estimate long-term cost effectiveness of treatment with rosuvastatin (20 mg daily) for the prevention of cardiovascular mortality and morbidity. The model contains three stages: (1) an initial stage corresponding to the JUPITER trial timeframe (4 years, CVD Prevention – RCT); (2) a stage simulating initial prevention beyond the trial time frame (initial CVD Prevention – Post-RCT); and (3) a subsequent event prevention stage, applied after a patient has an initial CVD event (subsequent CVD Prevention) (). The simulation model assessed cost effectiveness from a US health systems payer perspective through the incorporation of direct medical costs.
Figure 1. Model structure overview.
Model population
The model focused on patients at moderate and high cardiovascular risk (baseline Framingham score ≥10%). In the JUPITER clinical trial patients had no history of cardiovascular disease, had normal LDL-C levels, and had elevated hsCRP levels (n = 17,802). The base case for the model included those patients who were of intermediate to high CHD risk as defined by the Framingham risk score ≥10% (n = 10,559). This population was comprised of 61% men and mean age at entry of 67 years.
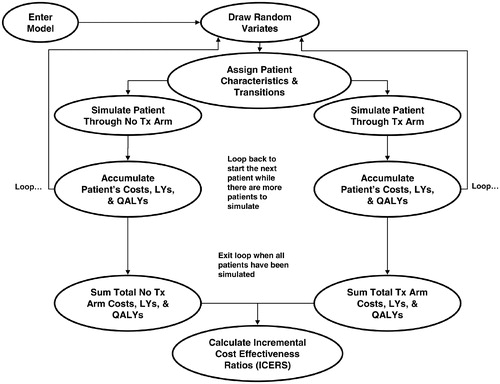
Two identical cohorts of patients are simulated on a patient-by-patient basis through the model: (1) those assigned to initial treatment with rosuvastatin 20 mg per day, and (2) those assigned to no treatment (placebo). The cohorts were made identical by having the same number of patients in each cohort with pair-wise assignment of identical demographic and transition characteristics. Each patient had an exact ‘clone’ in the opposite cohort, distinguished only by the treatment/no treatment designation. The pairs of patients were then simulated through the model.
Model structure
An overview of the model structure is presented in . Patients were simulated in the model on a fixed-time advance basis until their death or age 100 years old (for the lifetime analysis) or until the end of the specified model timeframe (for the 10- or 20-year analyses). All patients in the cohort begin in the CVD Prevention – RCT model stage for a maximum of 4 years. On a quarterly fixed-time basis, patients have a probability of having an event (derived from the JUPITER trial findings)Citation4, which would transition them to the subsequent prevention stage, where they would have a probability of death. Patients who do not experience events stay in the initial prevention stage until the next cycle of the model. In the first stage of the model, the model simulates patients in the JUPITER trial following event rates over time observed in the JUPITER trial dataCitation4. For this stage of the model, treatment effectiveness was modeled as reported in the JUPITER intent-to-treat data. The following events can cause transitions out of the CVD Prevention -RCT stage: (1) non-fatal MI, non-fatal stroke, unstable angina, CABG or PTCA transition to the subsequent CVD Prevention stage of the model, (2) CVD death, non-CVD death or VTE death transition to the Patient Death stage, and (3) 16 quarters (4 years) without a clinical endpoint transition to the initial CVD Prevention – Post-RCT stage. Non-fatal VTE may occur in the CVD Prevention – RCT stage and the events and associated costs are accrued but they do not force an exit from the stage as it is not considered to be a CVD event.
The initial CVD Prevention – Post-RCT stage of the model was developed to project the CVD prevention beyond the timeframe of the 4-year JUPITER trial (i.e., patient survival without a major CVD event). The stage has a 1-year fixed-time advance and patients remain in the stage until they experience an event, or until they die or reach age 100 (for the lifetime analysis), or end of specified model timeframe (for the10- and 20-year analyses). A simulated patient transitions into the initial CVD Prevention – Post-RCT stage with their initial treatment designation (rosuvastatin or no treatment). For patients who discontinue treatment, the effect of treatment on event transition probabilities is phased out over 5 years, or 20% per year, as was done in the long-term analysis of the West of Scotland Coronary Prevention (WOSCOP)Citation6. If a patient had a non-fatal event (MI, stroke, unstable angina, or revascularization) in the initial CVD Prevention – Post-RCT stage, they transition out to the subsequent CVD Prevention stage. For patients experiencing CVD death, non-CVD death, or VTE death, they transitioned out to the Patient Death stage of the model. Non-fatal VTE may occur and the events and associated costs are accrued but they do not force an exit from the stage.
The Subsequent CVD Prevention stage of the model simulates costs and outcomes for patients who experience a non-fatal CVD event after the occurrence of the event through the end of the specified model time horizon. This stage has a 1-year fixed-time advance and patients remain in the stage until they die, or reach age 100 years or until the specified model timeframe is reached (e.g., 10 years). Patients who received rosuvastatin 20 mg in the JUPITER trial continued on rosuvastatin 20 mg when they enter the Subsequent CVD Prevention stage. Patients not on treatment who enter the Subsequent CVD Prevention stage were assumed to initiate treatment with a ‘representative’ statin (for the base-case model). The representative statin was defined as a US market-share-weighted average of all statins currently available in the United States, as explained in detail later in the discussion of treatment cost estimates. There was no differentiation between previously-treated rosuvastatin and untreated patients in terms of CVD event relative risk. Post-discontinuation treatment effectiveness was phased out over 5 years, 20% per year. Patients who experienced a CVD death, non-CVD death, or VTE death during the Subsequent CVD Prevention stage were transitioned to the Patient Death stage of the model.
Age-based CVD event rates for the Subsequent CVD Prevention stage as reported in the NICE HTA 2007 reportCitation7 were used in the analysis. VTE rates and relative risk values were carried forward from the CVD Prevention – RCT stage to the Post-RCT stages. Non-CVD death rates were calculated in the same manner as in the RCT and Post-RCT stages of the model. Only one non-fatal CVD event (MI, stroke, unstable angina) was allowed to occur per 1-year cycle. In cases where multiple previous CVD events had occurred, the highest probability of a CVD event given a previous CVD event value was used in the simulation. A single non-fatal VTE may occur in a given 1-year cycle alone or in conjunction with a non-fatal CVD event. Patients who entered the Subsequent CVD Prevention stage of the model due to cardiac revascularization were treated as unstable angina patients for the purposes of state transitions and event rates. Cardiac revascularization was not modeled in the Subsequent CVD Prevention stage due to limited data availability.
Clinical events
The model incorporated the primary endpoints of the JUPITER trial, including: fatal and non-fatal MI, fatal and non-fatal stroke, coronary arterial revascularization (coronary artery bypass graft [CABG] or percutaneous transluminal coronary angioplasty/stent [PTCA]), unstable angina, or death from cardiovascular causes. Additionally, the model included non-CVD death and fatal and non-fatal venous thromboembolism events (VTE) (both deep vein thrombosis [DVT] and pulmonary embolism [PE]).
Quarter by quarter probabilities of experiencing an initial event were calculated by dividing the JUPITER trial adjudicated quarterly event counts by the number of patients at risk at the beginning of a quarter for the first 4 years of the model (CVD Prevention – RCT). The event probabilities per quarter were used to construct survival curves for patients in the treatment and placebo groups for the 4-year trial period. The survival curves were fitted to exponential curves with R2 values exceeding 0.97. The exponential survival curves provided the data to calculate a constant time-based probability of an event. A constant per-quarter event probability was then calculated for each of the exponentially-fitted survival curves, and the relative risk of an event with rosuvastatin treatment was calculated by taking the ratio of treated and untreated event probabilities The treatment effect with rosuvastatin was constant over these quarterly time intervals (RR = 0.49 for the at-risk population). This approach was taken rather than using the JUPITER trial relative risk (RR) of 0.56 as the constant quarterly event probability calculation accounted for the shape of the curve (slope and height) which makes it a better estimate to carry forward over the long term, and the high R2 value of the fitted exponential curves provided justification to utilize constant treatment relative risk values of a CVD event both during the modeled RCT stage as well as into the post-RCT stage.
The distribution of events, given an event occurrence, was also derived from the JUPITER trial event counts separately for the treatment and no treatment cohorts. Arterial revascularization was treated as a single event, assuming an 80/20% split between PTCA and CABG, based on the overall percentages of PTCA and CABG observed in the JUPITER trial data. Rate of VTE was derived from the JUPITER trial resultsCitation8. VTE events were modeled as a weighted combination of DVT and PE events. Non-CVD death rates were calculated using data from the National Vital Statistics Reports United States Life Tables for 2004Citation9. All-cause mortality rates were reduced by the life tables-reported proportion of deaths due to ‘diseases of the heart’ and ‘cerebrovascular disease’Citation10 and further compensated for the CVD death rates used for the simulated cohorts.
The annual probabilities of an initial event were adjusted and carried forward from the CVD Prevention – RCT stage of the model to the Initial CVD Prevention – Post-RCT stage. The baseline probability was subsequently increased annually based on Framingham CHD 10-year risk age-adjustment calculationsCitation11. This provided an age-based risk increase of approximately 5% per year as the model default. The relative risks of an event with rosuvastatin treatment, distribution of events given an event, and the VTE event rates were all carried forward from the CVD Prevention – RCT stage. Annual non-CVD death rates were calculated in the same manner as in the RCT stage.
Treatment continuation
During the CVD Prevention – RCT stage of the model, 100% of the patients in the treatment cohort were assumed to initiate treatment with rosuvastatin. The probability of a patient remaining on treatment declined linearly over the 4-year simulated period to 75%, which corresponded to the discontinuation rate observed over the course of the JUPITER trial. Accordingly, treatment discontinuation did not affect treatment effectiveness during this stage of the model (as the impact of discontinuation is already reflected in the efficacy estimates from the clinical trial data). However, discontinuation did impact the estimated treatment costs reflecting reduced drug utilization. If the patient who discontinued treatment subsequently transitions to the Initial CVD Prevention – Post-RCT stage, the rosuvastatin treatment effect is assumed to phase out (i.e., return to no risk reduction) over a 5-year period as described in the WOSCOPS long-term follow-upCitation6.
During the Initial CVD Prevention – Post-RCT stage of the model, treatment-persistent patients were assumed to have a 5% annual discontinuation probability, based on studies of statin persistence under usual careCitation12. For the Subsequent CVD Prevention stage of the model, 100% of the patients who experienced a non-fatal CVD event were assumed to initiate statin treatment (regardless of initial treatment assignment or past treatment discontinuation), but were assumed to discontinue statin therapy at a rate of 5% per year. The patients’ treatment costs reflected the decreased drug utilization, and the treatment relative risk was phased back to unity (RR = 1.0) over a 5-year period for both the CVD Prevention – RCT and Subsequent CVD Prevention stages.
Costs and cost effectiveness
During the model simulation, patients’ costs, event counts, life-years gained, and quality-adjusted life-years were accumulated at each stage of the model for each cohort of patients (). Costs include treatment costs (drug, annual physician visit, and monitoring tests) and event-related treatment costs (e.g., hospitalization and physician visits associated with CHD events).
Figure 2. Model cohort simulation.
Prescription drug cost estimates were based on Wholesale Average Cost (WAC) prices as of August 2009; $3.59 for rosuvastatin. However, it is well known that generic atorvastatin will be available in a few years and similarly generic rosuvastatin will be available a few years later. The generic availability of drugs is expected to cause subsequent price declines in these statinsCitation13. The predicted future drug costs for rosuvastatin and atorvastatin post generic availability are estimated by assuming an 80% price reduction within 1 year of generic availability. This is based on FDA estimated reduction in unit prices of generic drugs compared with the brand drug unit price, in the presence of competition among eight or more generic manufacturersCitation13. However, to account for the uncertainty of the drug prices in the future and to understand the potential impact of this on study results, the cost-effectiveness results were also examined with current drug prices for different time horizons in the base case at-risk patient population. The generic costs of rosuvastatin and atorvastatin (included in the market basket statin class cost) were integrated in the analysis after 9 years and 3 years of treatments, respectively, even in the Initial Post-RCT stage for rosuvastatin.
Drug treatment costs also were assumed to include an incremental annual physician visit and required safety monitoring tests, totaling $150 annually while under drug treatment, based on prevailing 2009 Medicare payment rates. All costs related to drug treatment were assumed to end if drug therapy was discontinued.
The specific-event cost estimates used in the model are summarized in . Consensus estimates of direct medical costs of treatment for each CVD event in the model in the United States were obtained from peer-reviewed sources (). Reported treatment cost estimates in each study were standardized to 2008-equivalent dollars using the Consumer Price Index-Urban Consumers (All Items)Citation14.
Table 1. Direct medical cost estimates for cardiovascular events.
Incremental cost-effectiveness ratio (ICER) was calculated using the formula:
Utilities
All patients simulated in the model had an assigned initial baseline utility, which was updated as the patient ages through the simulation based on values reported in the literatureCitation15. Utility weights for each model event were based on consensus estimates reported in the literatureCitation7, as noted in . Multiplicative utility calculations were performed in the cases where multiple disutility values were to be applied (the assumed ‘joint’ utility value was the product of the individual utility values).
Table 2. Disutilities for CVD events.
Discounting with half-cycle correction of life-years (LYs), quality-adjusted life-years (QALYs), and costs was performed with 3% annual discount rates.
Sensitivity analyses
One-way sensitivity analyses were conducted on rosuvastatin discontinuation (vary 0–50%), Subsequent Prevention statin initiation (60–100%), event costs (50–200%), event disutilities (50–150%), discounting (0–5%), event risk (50–150%), and event relative risk (50–150%). The range of values selected for these sensitivity analyses was intended to reflect the range of values potentially observed in usual practice. Probabilistic sensitivity analyses were performed for event costs, event disutilities and relative risk of event. For costs, lognormal distributions were used since costs are skewed with a long tail at the high end. The mean parameter values were set as the default and the minimum and maximum values set to 50% and 200% of the mean values. A ‘k’ factor of 0.5 was used among all costs to maintain a common relationship between the mean and the imputed standard deviation values required for the definitions of the lognormal distributions. For disutilities, beta distributions were used and the minimum and maximum values were set to 50% and 150% of the mean values. For relative risks, beta distributions were used and the minimum and maximum values were set to 73% and 136% of the mean values based on the JUPITER trial 95% confidence interval. Beta distributions were used to parallel the definition of probabilities and utilities which are bound by 0.0 and 1.0.
Results
For a hypothetical cohort of 100,000 at-risk patients, the incremental costs (present value) was about $236 million, with an estimated 29,817 life-years gained, over a lifetime horizon. Approximately 12,073 events were avoided over the lifetime, with 6146 non-fatal MIs, 2905 non-fatal strokes, and 4030 CVD deaths avoided (event rates not presented). Over the lifetime of higher cardiovascular risk patients, rosuvastatin 20 mg daily treatment reduced cardiovascular morbidity and mortality compared with no treatment with an ICER of $7062 per QALY gained ().
Table 3. Base case (intermediate and high risk patients) for predicted life-years gained, therapy cost, impact on major cardiovascular events and cost effectiveness in the total sample per 1,000 patients.
When the time horizon for the analysis was shortened to 20 years, the ICER (estimated cost per QALY gained) increased to $10,743, with estimated incremental cost of about $273 million and 20,438 life-years gained for the hypothetical cohort of 100,000 patients. An estimated 14,413 events were avoided in the 20-year horizon; 5689 non-fatal MIs, 2910 non-fatal strokes, and 3638 CVD deaths avoided. For a 10-year time horizon, the ICER increased to $44,466 per QALY gained, with estimated incremental cost of about $441 million and 6069 life-years gained for the hypothetical cohort. Approximately 10,148 events were avoided in the 10-year horizon; 3282 non-fatal MIs, 2169 non-fatal strokes, and 1785 CVD deaths avoided.
Using current drug prices, not accounting for future generic pricing, the ICER over the lifetime perspective was $11,030 per QALY, over a 20-year time horizon the ICER increases slightly to $15,502 and for a 10-year time horizon the ICER is $46,339.
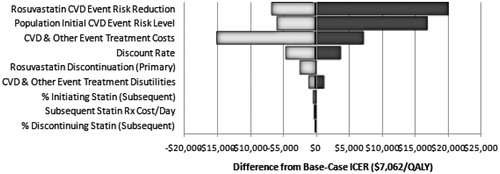
Sensitivity analyses examined the stability of the ICER estimates through a wide range of values for statin drug costs, event costs, event risk, relative risk, discontinuation, discounting, and disutilities. The results for the one-way sensitivity analysis for a lifetime horizon are illustrated in a tornado diagram (). The model parameter with the most substantial impact on estimated cost effectiveness was the assumed treatment effectiveness of rosuvastatin in the initial prevention phase of the model. Assuming a 50% smaller CHD event risk reduction than in the base case increased the ICER to $27,252, whereas assuming a 50% greater risk reduction reduced the ICER to $430. Another key parameter was the CVD event risk for the treatment population. Doubling the assumed risk from the base-case assumption reduced the estimated ICER to $1284 per QALY gained, whereas reducing the assumed risk by 50% from the base-case assumption increased the ICER to $24,054 per QALY gained (compared with $7062 per QALY for the base case). The assumed direct costs of treatment for CHD events also had an important impact on the estimated ICER for rosuvastatin, as did the assumed rate of treatment discontinuation for initial prevention. Indeed, at the upper-bound of assumed event costs, rosuvastatin treatment is cost saving. Changes in several model parameters relating to the Subsequent Prevention phase had little impact on ICERs in these one-way sensitivity analyses, including the assumed rate of statin treatment post-CHD event, the assumed rate of statin therapy discontinuation, and the cost per day of the ‘market basket’ statin therapy.
Figure 3. One-way sensitivity analyses, lifetime horizon for at-risk population.
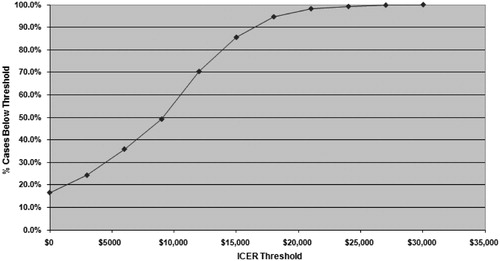
A probabilistic sensitivity analysis (PSA) was performed to evaluate the impact of simultaneous changes in multiple model parameters. The ‘willingness-to-pay’ or acceptability graph (), which indicated that at a maximum willingness-to-pay threshold of $50,000 per QALY gained, rosuvastatin therapy would be acceptable in 100% of the model replications. Additionally, rosuvastatin would be acceptable for 100% of model replications at a willingness-to-pay threshold of $30,000 per QALY. Rosuvastatin therapy was estimated to be cost saving (incremental cost <0) in approximately 19% of model replications.
Figure 4. Probabilistic sensitivity analysis (willingness-to-pay) for cost per quality-adjusted life-years gained over the lifetime.
The micro-simulation model also estimated the costs and benefits for a hypothetical model cohort of 100,000 patients representative of the entire JUPITER population, including patients of all risk levels. Under base-case assumptions, the ICER for cost per QALYs was $11,025 for the lifetime horizon. An estimated 10,551 events were avoided among the 100,000 patient population over the lifetime, including 5480 non-fatal MIs, 2230 non-fatal strokes, and 3576 CVD deaths. The ICER for cost per QALYs was $16,838 for the 20-year horizon and $60,112 for the 10-year horizon for the total population.
The analysis was also performed for a hypothetical cohort of 100,000 patients at higher baseline risk; 20% higher risk of cardiovascular event in 10 years. The ICER for cost per QALYs was $2327 for the lifetime horizon. An estimated 14,156 events were avoided among the 100,000 simulated patients over the lifetime.
Discussion
Among the at-risk population and based on generally accepted willingness-to-pay thresholds used for cost-effectiveness analysesCitation5, rosuvastatin treatment of 20 mg daily was cost effective in reducing cardiovascular morbidity and mortality in comparison with no treatment. The lifetime cost per QALY ICER of $7062 was well below the commonly accepted threshold of $50,000/QALY. The 10-year cost per QALY ICER ($44,466) was also below the threshold. The ICERs improved (lower) with increasing baseline risk of the population ($2327 for the lifetime horizon for patients at 20% risk). The ICERs were higher by about 40% for the total population (all risk levels) but the ICER remained well under the $50,000 threshold for the lifetime and a 20-year horizon and just over the threshold ($60,112) at the 10-year horizon. The higher ratio was due to the addition of patients with lower CHD risk and lower rates of mortality and CV events.
As the time horizon for the cost-effectiveness analysis spans beyond the anticipated entry of generic rosuvastatin and atorvastatin, the current analysis presents cost effectiveness of rosuvastatin after accounting for the anticipated future generic statin US costs. Accounting for future generic drug costs has been suggested to provide a more accurate reflection of the true cost effectiveness of an interventionCitation16–18. The estimates of future generic drug costs have been included in the base-case analysis to provide more realistic cost estimates of these drug therapies for the US payers. However, as there is some debate on how future cost changes should be integrated in cost-effectiveness analyses, the results have also been presented using fixed current prices to account for uncertainty around future drug costs. The impact on the results of using fixed current prices was very limited and the ICER remained well below commonly accepted cost-effectiveness threshold values.
Both one-way and probabilistic sensitivity analyses indicated that the estimated costs per QALY gained were robust with respect to most model parameters. In the one-way sensitivity analyses, in most cases even extreme parameter values yielded ICER estimates below most commonly accepted thresholds for willingness-to-pay. In the probabilistic sensitivity analyses, in the at risk population over a lifetime horizon, the estimated cost per QALY gained for rosuvastatin therapy was less than $50,000 in 100% of model replications, and for a 10-year time horizon, 51% of model replications were less than $50,000. Several recent papers have noted that the long-cited ‘rule of thumb’ threshold value of $50,000 per QALY has been used for decades with no adjustment for inflationCitation19, and that revealed-preference studies suggest individuals are willing to pay substantially more than $50,000 per QALY gainedCitation20. Accordingly, many studies have started to use values of $100,000 per QALY or higher as a threshold benchmarkCitation21. As noted, virtually all replications in the PSA resulted in an ICER value less than $100,000 for the 10-year time horizon (98%) for the at-risk population. Finally, given that the estimated cost effectiveness improves for longer model time horizons, all model replications resulted in an estimated ICER below $100,000 in PSAs for a 20-year or lifetime horizon for the at-risk population.
The at-risk patient population with a Framingham score of ≥10% from the JUPITER trial was used in the model. The model used a relative risk of 0.49 for the at-risk population rather than the JUPITER trial relative risk of 0.56. This RR was used since it best represented the shape (slope and height) of the curve for cardiac event risk and was the best estimate to carry forward over the long-term model. However, the results were similar when the relative risk of 0.56 was used for the at-risk population (Cost/QALY ICER = $10,384 for lifetime, $15,152 for 20 years, and $56,065 for 10 years).
Driving the cost effectiveness of rosuvastatin treatment was a large number of clinical events avoided (n = 12,073) among the at-risk population over the lifetime. A large increase in events avoided occurred between the 10-year and 20-year horizons (difference of 4265 events avoided). The model also showed that the events avoided were largely those occurring among the intermediate and high risk patients since 12,073 events were avoided in the at-risk group and 10,551 avoided in the total population per 100,000 simulated patients using the lifetime horizon.
The patient population with Framingham risk score ≥10% was selected as the base case for our analysis considering the need to use more aggressive statin treatments in this higher risk population to address their higher unmet medical needCitation1. Due to higher cardiovascular risk, this population would be economically burdensome for US health plans to manage. It is important to understand the cost-effectiveness implications of interventions aimed at managing this patient population with a higher cardiovascular risk. Even when lower risk patients were included in the model population, estimated incremental cost-effectiveness ratios fell below commonly accepted thresholds for cost-effective treatments.
The results of the present study are similar to the findings of the Heart Protection StudyCitation22 and other cost studiesCitation23. A cost-effectiveness analysis of the Heart Protection Study, a UK clinical trial of 40 mg simvastatin versus placebo in high CHD risk patients, found a cost per life-year gained below $11,000 ($2500–10,990) for a lifetime horizonCitation22, which is similar to our $7929 lifetime cost per life-year gained for the at-risk population. The Heart Protection Study cost analysis did not examine quality-adjusted life-years. A study examining the cost effectiveness of statin therapy, aspirin, or both drugs for the primary prevention of CHD events in men over 10 years found an incremental cost-utility ratio for both drugs of $56,200 per quality-adjusted life-year gained compared with aspirin aloneCitation23. This figure is higher than the $44,466 estimated in our model for the at-risk population 10-year horizon, which may be due to the exclusion of women and the use of simvastatin and lovastatin drug prices in the Pignone study.
The model has certain limitations that need to be considered. Several of the model input parameter estimates were derived from literature or other publicly available data sources with inherent uncertainties around the key model input parameters. The authors attempted to control for this uncertainty, which is inherent in modeling studies, by performing extensive sensitivity analyses (including probabilistic sensitivity analyses) to test the model assumptions. The model used US life tables to estimate CVD risk with the UK NICE meta-analysis to determine the risk reduction for CVD events attributable to statin therapy in the secondary prevention setting. Though the model used the estimates of subsequent event probabilities as used in the NICE HTA reportCitation7, it is possible that some of these estimates may be different in the US and in the patient population included in this study, especially given differences in treatment patterns across settings (e.g., coronary artery bypass graft and percutaneous coronary intervention)Citation24–26. The JUPITER trial used a placebo comparison group and thus the model simulated the initial prevention based upon a placebo comparison. Future research should attempt to estimate the cost effectiveness of rosuvastatin treatment as compared to an active statin treatment in prevention of cardiovascular disease. Indirect costs (lost wages or productivity) were not included in the present analysis as the analysis was conducted from a payer perspective. The indirect costs would most likely be higher in the placebo arm because there were more events that could lead to more time lost from work. As a result, the cost-effectiveness estimates in the model would likely be lower if the indirect costs were included in the analysis.
Conclusion
Treatment with rosuvastatin 20 mg daily, is a cost-effective treatment alternative to no treatment in patients at a higher risk of CV disease.
Transparency
Declaration of funding
This research was supported by AstraZeneca Pharmaceuticals LP.
Declaration of financial/other interests
R.L.O., L.J.S., and K.M.F. have disclosed that they were consultants and received research funding from AstraZeneca Pharmaceuticals LP to conduct this study. S.K.G., A.J., J.H., and M.M.J. have disclosed that they are employees and stock holders of AstraZeneca Pharmaceuticals LP.
Related Research Data
References
- Grundy SM, Cleeman JI, Merz CN, et al. Implications of recent clinical trials for the National Cholesterol Education Program Adult Treatment Panel III guidelines. Circulation 2004;110:227-239
- DeBacker G, Ambosioni E, Borch-Johnson K, et al. European guidelines on cardiovascular disease prevention in clinical practice. Eur Heart J 2003;24:1601-1610
- Ridker PM, Rifai N, Rose L, et al. Comparison of C-reactive protein and low-density lipoprotein cholesterol levels in the prediction of first cardiovascular events. N Engl J Med 2002;347:1557-1565
- Ridker PM, Danielson E, Fonseca FAH, et al. Rosuvastatin to prevent vascular events in men and women with elevated C-reactive protein. N Engl J Med 2008;359:2195-2207
- Gold MR, Siegel JE, Russell LB, et al., eds. Cost-effectiveness in Health and Medicine. Oxford: Oxford University Press, 2006
- Ford I, Murray H, Packard CJ, et al. Long-term follow-up of the West of Scotland Coronary Prevention Study. N Engl J Med 2007;357:1477-1486
- Ward S, Lloyd Jones M, Pandor A, et al. A systematic review and economic evaluation of statins for the prevention of coronary events. Health Technol Assess 2007;11:1-160, iii-iv
- Glynn RJ, Danielson E, Fonseca FAH, et al. A randomized trial of rosuvastatin in the prevention of venous thromboembolism. N Engl J Med 2009;360:1-11
- Aries E. United States life tables, 2004. Natl Vital Stat Rep 2007;56(9)9:1–39. (http://www.cdc.gov/nchs/data/nvsr/nvsr56/nvsr56_09.pdf, accessed 12/12/2008)
- Heron M. Deaths: leading causes for 2004. Natl Vital Stat Rep 2007;56(5)9:1–95. (http://www.cdc.gov/nchs/data/nvsr/nvsr56/nvsr56_05.pdf, accessed 12/12/2008)
- Framingham Heart Study 2008. Coronary Heart Disease (10-year risk). (http://www.framinghamheartstudy.org/risk/coronary.html, accessed 4/23/09)
- Avorn J, Monette J, Lacour A, et al. Persistence of use of lipid-lowering medications: a cross-national study. JAMA 1998;279:1458-1462
- Food and Drug Administration, Center for Drug Evaluation and Research. Generic Competition and Drug Prices http://www.fda.gov/CDER/ogd/generic_competition.htm, accessed 5/3/2007
- U.S. Department of Labor, Bureau of Labor Statistics 2009. Consumer Price Index Databases – Urban Consumers (All Items) (http://www.bls.gov/cpi/data.htm, accessed 4/1/09)
- Sullivan P, Arant T, Ellis S, et al. The cost-effectiveness analysis of anticoagulation management services for patients with atrial fibrillation and at high risk of stroke in the US. Pharmacoeconomics 2006;10:1021-1033
- Shih YT, Han S, Cantor SB. Impact of generic drug entry on cost-effectiveness analysis. Med Decis Making 2005;25:71-80
- Hoyle M. Future drug prices and cost-effectiveness analyses. Pharmacoeconomics 2008;26:589-602
- Pharmaceutical Management Agency. Prescription for pharmacoeconomic analysis. Methods for cost-utility analysis. (http://www.pharmac.govt.nz/schedule.asp. accessed 12/4/2009)
- Ubel PA, Hirth RA, Chernew ME, et al. What is the price of life and why doesn’t it increase at the rate of inflation? Arch Intern Med 2003;163:1637-1641
- Hirth RA, Chernew ME, Miller E, et al. Willingness to pay for a quality-adjusted life year: in search of a standard. Med Decis Making 2000;20:332-342
- Cutler DM, Rosen AB, Vijan S. The value of medical spending in the United States, 1960–2000. N Engl J Med 2006;355:920-927
- Heart Protection Study Collaborative Group. Statin cost-effectiveness in the United States for people at different vascular risk levels. Circ Cardiovasc Qual Outcomes 2009;2:65-72
- Pignone M, Earnshaw S, Tice J, et al. Aspirin, statins, or both drugs for the primary prevention of coronary heart disease events in men: a cost-utility analysis. Ann Intern Med 2006;144:326-336
- US National Hospital Discharge Survey. 2006. Available at http://www.cdc.gov/nchs/about/major/hdasd/nhds.htm
- Society of Cardiothoracic Surgeons of Great Britain and Ireland. UK Cardiac Surgical register. 2006. Available at http://www.scts.org
- British Cardiovascular Intervention Society. PCI Database. 2005. Available at http://www.bcis.org.uk
- Schleinitz MD, Heidenreich PA. A cost-effectiveness analysis of combination antiplatelet therapy for high-risk acute coronary syndromes: clopidogrel plus aspirin versus aspirin alone. Ann Intern Med 2005;142:251-259
- Beinart SC, Kolm P, Veledar E, et al. Long-term cost-effectiveness analysis of early and sustained dual oral antiplatelet therapy with clopidogrel given for up to one year after percutaneous coronary intervention. J Am Coll Cardiol 2005;46:761-769
- Chan PS, Nallamothu BK, Gurm HS, et al. Incremental benefit and cost-effectiveness of high dose statin therapy in high risk patients with coronary heart disease. Circulation 2007;115:2398-2409
- Kauf TL, Velazquez EJ, Crosslin DR, et al. The cost of acute myocardial infarction in the new millennium: evidence from a multinational registry. Am Heart J 2006;151:206-212
- Puskas JD, Williams WH, Mahoney EM, et al. Off-pump vs. conventional coronary artery bypass grafting: early and 1-year graft patency, cost, and quality-of-life outcomes. JAMA 2004;291:1841-1849
- O'Brien C, Gage B. Cost and effectiveness of ximelagatran for stroke prophylaxis in chronic atrial fibrillation. JAMA 2005;293:699-706
- Lee WC, Christensen MC, Josh, AV, et al. Long-term cost of stroke subtypes among Medicare beneficiaries. Cerebrovasc Dis 2007;23:57-65
- Scuffham PA, Kosa J. The cost-effectiveness of fluvastatin in Hungary following successful percutaneous coronary intervention. Cardiovasc Drugs Ther 2006;20:309-317