Abstract
Background:
Multiple sclerosis (MS) is associated with a substantial economic burden resulting from direct medical costs associated with health and disability-related resource utilization and indirect costs relating to reduced productivity. However, reduced health-related quality of life (HR-QOL) may be associated with additional costs, often termed ‘intangible costs,’ that should be considered as part of the economic burden from the societal or patient perspectives.
Objectives:
To review the contribution of intangible costs to the overall economic burden of MS.
Methods:
Medline was searched through March 2010 for relevant articles that included the terms ‘multiple sclerosis’ in combination with ‘intangible costs,’ ‘QALY,’ ‘quality-adjusted life year,’ ‘willingness-to-pay,’ and ‘WTP.’ Other than the restriction that the articles were published in English, there were no other exclusionary criteria for the search. Identified references were hand-searched to determine if intangible costs were estimated.
Results:
Thirteen studies across ten countries were identified that estimated intangible costs based on the number of quality-adjusted life-years (QALYs) lost due to a reduction in HR-QOL multiplied by accepted willingness-to-pay (WTP) thresholds. Although absolute costs varied depending on thresholds used and year of evaluation, the intangible costs accounted for 17.5–47.8% of total costs of MS. Furthermore, evidence suggested intangible costs are positively correlated with worsening disability. The largest increase in intangible costs occurred at the transition between mild and moderate disability. However, since no value has been established as being acceptable to pay for a QALY, a limitation of these studies was their dependence on the definition of the WTP threshold.
Conclusions:
Intangible costs substantially add to the economic burden of MS. There is not only a need to further characterize these costs and incorporate them into economic studies, but also to determine how these costs can be reduced through appropriate management strategies.
Introduction
The pathophysiology of multiple sclerosis (MS) is characterized by inflammation of the central nervous system leading to demyelination and axonal loss that disrupt transmission of nerve impulsesCitation1. These underlying processes are clinically manifested by walking difficulty, visual or cognitive impairment, and symptoms including spasticity, fatigue, pain, and depression that may be present even at early stages of the disease and at low disability levelsCitation2,Citation3.
It has been well-established that substantial costs result from MS disability, which progresses over timeCitation4–9. Routinely in clinical trials, disability is measured using the Expanded Disability Status Scale (EDSS), an MS-specific disability scale ranging from 0 (normal neurologic exam) to 10 (death due to MS)Citation10. As disability increases, so do the total costs of MS, resulting from increases in both direct and indirect costs. Because of the early onset of MS, usually during an individual's most productive years, and the approximately normal life expectancy of an MS patientCitation11–13, annual costs of the MS population have been reported in the billions of dollars in the United States (US) aloneCitation14.
The overall economic burden of MS has been consistently reported to be driven by non-medical costs, composed of direct non-medical costs such as assistive aids, home adaptations, and formal or informal care, as well as indirect costs such as those related to lost productivityCitation4,Citation6–9,Citation15. However, from the societal perspective, it is considered important to evaluate all costs and consequences related to a disease and its treatmentCitation16. Therefore, there is a need to determine the economic impact associated with the changes in health-related quality of life (HR-QOL) that occur as a result of MS, since HR-QOL is of direct relevance to patients and is an important outcome for evaluating clinical management strategies.
Individuals with MS report significantly lower HR-QOL relative to general population norms, age- and gender-matched controls, and to individuals with other chronic conditions including hypertension, congestive heart failure, recent myocardial infarction, and type 2 diabetesCitation7,Citation17–22. The economic contribution of changes in HR-QOL to the overall economic burden of an MS patient has often been neglected, since those costs are difficult to determine and are consequently termed ‘intangible costs,’ defined as costs associated with disease-related changes in pain and suffering that are generally captured through patient-reported HR-QOL. Health state utilities summarize HR-QOL as a single value or utility score describing a particular health state and thus may provide a useful approach to valuating intangible costs. The purpose of this article is to review the literature detailing the contribution of intangible costs to the economic burden of MS.
Methods
During March 2010, relevant references were identified from searches of Medline for all articles in English that included the terms ‘multiple sclerosis’ in combination with ‘intangible costs,’ ‘QALY,’ ‘quality-adjusted life year,’ ‘willingness-to-pay,’ and ‘WTP.’ There were no limitations with respect to dates of publication or other criteria. The references of these identified articles were further reviewed for additional studies that may have been missed in the original search. Identified references were then hand-searched to determine if intangible costs were estimated.
Results
From the literature search, 13 studies were identified that estimated intangible costs ( and ). Of these studies, only one was from the US, with the rest from various European countries, including two studies from Sweden and two from Spain. The demographic characteristics were generally comparable among the studies and were consistent with what may be expected in an MS population (); predominantly female (range 63.8–76.4%), with mean ages that ranged from 41.6 to 53.4 years. With two exceptions, the progressive form of MS was predominant in these studies relative to relapsing-remitting MS.
Table 1. Characteristics of the populations in studies evaluating intangible costs of multiple sclerosis.
Table 2. Estimates of the intangible costs of multiple sclerosis.
The two exceptions were the study by Casado and colleaguesCitation23, in which the patient population was almost exclusively relapsing-remitting MS (94.6%), and the study from the US that reported a similar proportion of patients with relapsing-remitting MS (47.6%) and progressive MS (43.8%). The study by Casado and colleaguesCitation23 was also different with respect to the mean EDSS score of the population (), which was 2.47, indicating mild disability.
Although most studies were performed by a single group of researchers, all identified studies used a similar methodology for estimating intangible costs. First, health utilities derived from tools such as the widely used EuroQol (EQ-5D)Citation24 were used to summarize HR-QOL as a single value, or utility score, describing a particular health state. The difference in utility scores between patients and population norms were then used to calculate the number of QALYs lost due to MS. The QALY is a measure that considers both morbidity and mortality by integrating quality and quantity of life into a single metricCitation16. The number of QALYs lost were then multiplied by a willingness-to-pay threshold (WTP) for a QALY to estimate intangible costs. The WTP thresholds demarcate the maximum cost per QALY gained above which the treatment is not considered to be cost effective. Although no specific value has been established as being acceptable to pay for a QALY, a range between US $50,000–100,000 has been suggestedCitation25, although the World Health Organization recommends three times the gross domestic product (GDP)Citation26. Threshold levels of US $60,000 in the US and €50,000 in the European Union have been commonly used as WTP values for an additional QALY gained in MS economic studies.
In these studies, utility values for determining QALYs lost were uniformly based on the descriptive portion of the EQ-5D, except for one studyCitation23 that used the visual analogue scale portion of the EQ-5D (a less accurate measure of eliciting utilities). WTP thresholds were based on either US $60,000 or €50,000, except for one study that included an evaluation based on three times the GDPCitation7 and another study that used €55,000Citation23.
The intangible costs of MS reported in the 13 studies are presented in . Ten of the studies were part of a published series that used the above technique for estimating intangible costs as part of burden of illness analyses. These ten studies were performed in the US and nine Western European countries including Austria, Belgium, Germany, Italy, Netherlands, Spain, Sweden, Switzerland, and the United Kingdom (UK)Citation6,Citation27–35. Although the UK-specific study did not report intangible costs, QALYs lost and intangible costs were estimated for the pooled country analysis that included the UKCitation7.
The US study estimated total average direct plus indirect costs adjusted for the year 2004 as US $47,215 per patient-yearCitation6. The intangible costs of US $15,315 increased the annual cost per individual by approximately another third, resulting from an annual average loss of 0.255 QALYs per individual. It should be noted that in this study, although a US-specific scoring algorithm was used for estimating utilities in the MS population, the general population utility scores were from the UK, since general population utilities from the US had not been published at that time.
Results from the analyses of the individual European countries were comparable among the countries with regard to both loss of QALYs and intangible costsCitation27–33. The number of QALYs lost ranged from 0.2 in Germany to 0.3 in Belgium and Switzerland, resulting in intangible costs that were estimated at €10,000–15,000 across all the countries. When intangible costs are combined with the direct and indirect costs reported in the studies, they account for 17.5–31.6% of total costs. The QALYs lost were somewhat lower than two earlier studies, one from Sweden that reported a loss of 0.49 QALYsCitation36,Citation37 and one from the UK that reported 0.383 lost QALYsCitation38. In these earlier studies, the intangible costs also accounted for somewhat higher proportions of total costs: 35.7% and 47.8% in Sweden and the UK, respectively.
Overall results reported for the nine European countriesCitation7 were similar to those in the US; patients had a mean QALY loss of 0.27 (range 0.21–0.32) per patient per year compared with the general populationCitation7. This loss in QALYs resulted in an average increase in total costs of approximately 30% based on estimated intangible costs of €13,400 (range €10,300–15,400), which were derived from a WTP for a QALY of €50,000 and adjusted for the year 2005. When three times the gross domestic product per capita was used as a threshold, the estimated intangible costs were higher, at €19,800.
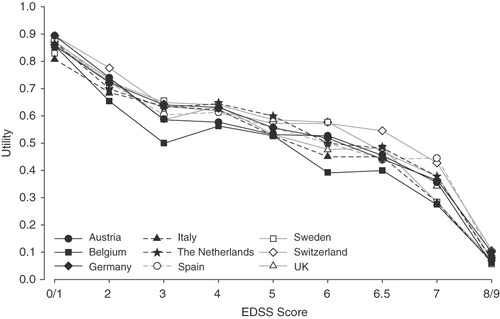
Among the countries, it was also observed that the pattern of association between EDSS disability levels and utility scores was similar (). However, intangible costs associated with each level of disability were not estimated as part of these analyses.
Figure 1. Cross-national utility scores according to Expanded Disability Status Scale (EDSS) scores among nine countries in Europe. Although the EuroQol (EQ-5D) permits negative scores (i.e., health states worse than death), negative scores were set to zero. Reproduced with permission from Kobelt et al.Citation7.
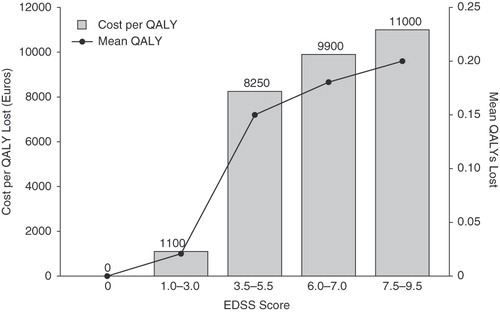
Although the studies discussed above included intangible costs as part of an overall burden of disease analysis, Casado and colleaguesCitation23 performed a study specifically designed to estimate the intangible costs of MS using data from a cohort in Spain. Based on a WTP of €55,000 per QALY and without adjusting for a particular year or for inflation, they reported that the intangible costs of MS would amount to €4,400 in their population, with a range of €2,640–6,160 when a sensitivity analysis was performed using WTP values of €33,000 and €77,000 per QALY, respectively. Since the authors did not perform a full economic analysis, the proportional contribution of intangible costs to overall costs of MS was not estimated. However, they did evaluate the association between intangible costs and EDSS disability scores () and the greatest loss in QALYs, and, thus, the greatest change in intangible costs was observed to occur between the transition from EDSS scores in the ranges of 1.0–3.0 to 3.5–5.5.
Figure 2. Intangible costs and mean loss of quality-adjusted life-years (QALYs) as a function of Expanded Disability Status Scale (EDSS) scores in individuals with multiple sclerosis in a study in Spain. Estimations based on utility scores using the visual analogue scale component of the EuroQol (EQ-5D). Data from Casado et al.Citation23.
Discussion
This review demonstrates that intangible costs represent a substantial contribution to the total economic burden of MS, ranging from approximately 25% to almost 50% of the total costs associated with MS. The identified studies used similar WTP thresholds, and the QALYs lost in MS patients were generally comparable. Consequently, the range in the contribution of intangible costs to total costs may be ascribed, in part, to the observed variability in the total costs among the countries in which the studies were performed. This variability is likely to result from differences in MS management strategies and component costs across the individual countries.
The similarity in number of QALYs lost among the studies may not be surprising, given that the mean EDSS scores were also similar, reflecting an overall population that was characterized by moderate disability. The exception is the study by Casado and colleagues, which was characterized by mild disability, as suggested by the mean EDSS score of 2.47Citation23. Patients with severe disability were generally under-represented in these studies, since severe disability may preclude participation in studies requiring responses to questionnaires such as the EQ-5D.
An analogous pattern was observed between EDSS disability levels and utility scores across studies. It can be considered that this similarity may, in part, result from the use of the UK scoring algorithm for the EQ-5D for deriving all utility values rather than country-specific algorithms. However, a recent meta-analysis has suggested that utility scores follow a similar pattern across countries for patients who have similar disability levels, with variation in health utilities primarily explained by the severity of disabilityCitation39.
The relationship between costs and disability levels was explored in these studies. This relationship was observed to be direct, with increased disability resulting in increased costs. However, intangible costs as a function of disability were only evaluated in the study by Casado and colleaguesCitation23. Interestingly, the greatest increase in intangible costs occurred at the transition of EDSS score ranges between 1.0–3.0 (mild disability) and 3.5–5.5 (moderate disability). Whereas the EDSS is a non-linear scale, such that equal changes between scores do not reflect equal changes in disability, from a clinical perspective, the transition from mild to moderate disability represents a critical range in which changes in neurologic status have substantial impact on daily activities and social roles.
With respect to function, the EDSS range of 3.5–5.5 is still characterized by unaided mobility. However, mobility becomes more distance-limited and consumes more time and energy since there are substantial limitations in walking endurance. An EDSS score of 5.5 reflects a disability level severe enough to prevent full daily activities.
At subsequent levels of EDSS disability, there were small incremental increases in intangible costs. One possible explanation for observing only small increases in lost QALYs and intangible costs at higher EDSS scores could be age. Individuals with higher EDSS scores tend to be older, and, thus, there could be less of a difference relative to age-matched controls, since there is an age-related decrease in utility scores. Nevertheless, further support for incremental increases in intangible costs at greater disability levels is suggested by another approach to estimating intangible costs. This approach imputes the costs based on differences in utility values across EDSS ranges within a study population as a proxy for QALYs lost.
When such a proxy is applied to the US population in the study by Kobelt and colleaguesCitation6, values of $8,700 per year are obtained for the transition from mild (EDSS score 0–3.5 and utility value 0.824) to moderate disease (EDSS score 4.0–6.0 and utility value 0.679; difference in utility 0.145 multiplied by WTP of $60,000), and $8,760 per year during the transition from mild to severe (EDSS score 0.533 and utility value 0.533; difference in utility 0.146 multiplied by WTP). Similarly, visual interpolation of the data presented in taken from the study of the nine European countriesCitation7 suggests that there are substantial intangible costs associated with reductions in utility values at low disability levels, followed by relative stability of utilities and costs across moderate disability scores, and increases in intangible costs at severe disability levels. These intangible costs among patients with severe disability are primarily driven by the reduction in utilities at the higher end of the EDSS range. However, this method does not adjust for age as a component of the change in utility values, since patients with greater disability are likely to be older than those at lower disability levels; population norms show that EQ-5D utility values decrease with ageCitation40.
There are several important limitations related to the study by Casado and colleagues. Their study was characterized by a population that almost exclusively represented relapsing-remitting-type MS relative to the other studies in which progressive-type MS predominated. However, since variation in health utilities may primarily be explained by disability severity rather than type of MSCitation41, these results provide an important perspective that may be extrapolated to other types of MS.
As discussed by the authors, another limitation is that, in contrast to the other burden-of-MS studies that utilized a scoring algorithm for the EQ-5D, the non-descriptive part of the EQ-5D was used, which consists of a visual analogue scale to indicate patient health. Although use of a visual analogue scale is an alternative method for deriving utilities, and the authors justify this method based on reported correlation between utility measurements and visual analogue scores, they also note that it is less accurate than directly measuring utilities. The authors consequently ascribe the lower monetary value of intangible costs relative to other studies, at least in part, to overestimation of HR-QOL by their use of the visual analogue scale.
Two additional general limitations should be mentioned. The first is that nearly all of the studies reviewed here were performed by the same group of researchers, and therefore the robustness of their findings across studies may in part result from the use of the same methodology throughout. However, these methods were appropriate across the various countries in which the studies were performed, and in the absence of other studies, the data provide useful evidence of the importance of intangible costs to the overall economic burden as well as highlighting the paucity of research on these costs in MS. The other limitation of all the studies reviewed here is the dependence on a WTP threshold. No specific value has been established as being acceptable to pay for a QALY, and the concept and appropriate application of a QALY, as well as assigning costs, has been a controversial issue in health economics. The difficulty of determining WTP for a QALY has been discussed by Gyrd-Hansen, who concluded that such valuation cannot theoretically be establishedCitation42. In contrast, King and colleaguesCitation43 suggested the usefulness of such a metric, albeit with the understanding of its contextual limitations resulting from variability inherent in determining society's WTP based on methodology and sociodemographic characteristics. The threshold values of US $60,000 in the US and €50,000 in the European Union that were used in the studies reviewed here are conventionally applied in economic analyses. However, these values have remained constant despite the effects of inflation, and it has been suggested that there is a need to increase these limitsCitation44.
To compensate for this stagnation in the WTP threshold levels over time, an analysis by Braithwaite and colleagues designed to provide inference for cost-effectiveness values consistent with current health resource allocation determined a threshold of US $109,000 per QALYCitation45. Indeed, the cost effectiveness of dialysis for end-stage renal disease, which is frequently used as a benchmark of societal WTP, has been estimated to be on average US $129,090 per QALY, based on current clinical practice relative to the next least costly alternative (i.e., current clinical practice with a slight delay in initiation of dialysis)Citation46. Applying these thresholds for the imputation of intangible costs and assuming an average of 0.3 lost QALYs as suggested by the available studies results in intangible costs of US $32,700–38,700–substantially higher than the costs reported using more traditional thresholds.
Conclusions
Intangible costs substantially add to the economic burden of MS, particularly as patients transition to health states associated with mobility impairment and disability severe enough to prevent full daily activities. The studies reviewed here suggest a need for further consideration of the contribution of intangible costs to the total costs of MS and how these costs can potentially be reduced through appropriate management strategies.
Declaration of interest
A.W. has disclosed that she has acted as a consultant for Acorda Therapeutics, Teva and Biogen, and that she has received honoraria as a speaker from Biogen. T.B. has disclosed that he has acted as a consultant for Teva, EMD Serono Inc. and Acorda. He also has disclosed that he has received research grants from Eli Lilly and Company; is a member of the speakers’ bureaus of EMD Serono and Teva; and has received honoraria from these companies. He also is a stockholder in Acorda and Novartis Pharmaceuticals, with stock valuing less than $5,000 in each company. E.J.B. has disclosed that he has acted as Scientific Director for this project, providing editorial support funded by Acorda Therapeutics. C.I.C. has disclosed that he has acted as a consultant for Acorda.
Transparency
Declaration of funding
This project was supported by Acorda Therapeutics, Inc., Hawthorne, NY, USA.
Acknowledgments
The authors thank Amy Poel for her intellectual contributions.
References
- Noseworthy JH, Lucchinetti C, Rodriguez M, et al. Multiple sclerosis. N Engl J Med 2000;343:938-952
- Johansson S, Ytterberg C, Claesson IM, et al. High concurrent presence of disability in multiple sclerosis. Associations with perceived health. J Neurol 2007;254:767-773
- Martin CL, Phillips BA, Kilpatrick TJ, et al. Gait and balance impairment in early multiple sclerosis in the absence of clinical disability. Mult Scler 2006;12:620-628
- Grima DT, Torrance GW, Francis G, et al. Cost and health related quality of life consequences of multiple sclerosis. Mult Scler 2000;6:91-98
- Patwardhan MB, Matchar DB, Samsa GP, et al. Cost of multiple sclerosis by level of disability: a review of literature. Mult Scler 2005;11:232-239
- Kobelt G, Berg J, Atherly D, et al. Costs and quality of life in multiple sclerosis. A cross-sectional study in the United States. Neurology 2006;66:1696-1702
- Kobelt G, Berg J, Lindgren P, et al. Costs and quality of life of patients with multiple sclerosis in Europe. J Neurol Neurosurg Psychiatry 2006;77:918-926
- McCrone P, Heslin M, Knapp M, et al. Multiple sclerosis in the UK: service use, costs, quality of life and disability. Pharmacoeconomics 2008;26:847-860
- Sobocki P, Pugliatti M, Lauer K, et al. Estimation of the cost of MS in Europe: extrapolations from a multinational cost study. Mult Scler 2007;13:1054-1064
- Kurtzke JF. Rating neurologic impairment in multiple sclerosis: an expanded disability status scale (EDSS). Neurology 1983;33:1444-1452
- Kurtzke JF, Wallin MT. Epidemiology. In: Burks JS, Johnson KP, eds. Multiple Sclerosis: Diagnosis, Medical Management, and Rehabilitation. New York: Demos, 2000:49-71
- Sadovnick AD, Ebers GC, Wilson RW, et al. Life expectancy in patients attending multiple sclerosis clinics. Neurology 1992;42:991-994
- Weinshenker BG. The natural history of multiple sclerosis. Neurol Clin 1995;13:119-146
- Multiple Sclerosis: Hope Through Research. National Institute of Neurological Disorders and Stroke. Bethesda, MD. Updated April 28, 2010. Available at: www.ninds.nih.gov/disorders/multiple_sclerosis/detail_multiple_sclerosis.htm#153333215 [Last accessed 1 July 2010]
- Whetten-Goldstein K, Sloan FA, Goldstein LB, et al. A comprehensive assessment of the cost of multiple sclerosis in the United States. Mult Scler 1998;4:419-425
- Drummond MF, O’Brien B, Stoddart GL, et al. Methods for the Economic Evaluation of Health Care Programmes, 2nd ed. Oxford: Oxford University Press, 1997
- Wu N, Minden SL, Hoaglin DC, et al. Quality of life in people with multiple sclerosis: data from the Sonya Slifka Longitudinal Multiple Sclerosis Study. J Health Hum Serv Adm 2007;30:233-267
- Nortvedt MW, Riise T, Myhr KM, et al. Quality of life in multiple sclerosis: measuring the disease effects more broadly. Neurology 1999;53:1098-1103
- Solari A, Radice D. Health status of people with multiple sclerosis: a community mail survey. Neurol Sci 2001;22:307-315
- Hemmett L, Holmes J, Barnes M, et al. What drives quality of life in multiple sclerosis? Q J Med 2004;97:671-676
- Nortvedt MW, Riise T. The use of quality of life measures in multiple sclerosis research. Mult Scler 2003;9:63-72
- Jones CA, Pohar SL, Warren S, et al. The burden of multiple sclerosis: a community health survey. Health Qual Life Outcomes 2008;6:1
- Casado V, Romero L, Giubieras L, et al. An approach to estimating the intangible costs of multiple sclerosis according to disability in Catalonia, Spain. Mult Scler 2007;13:800-804
- The EuroQol Group. EuroQol – a new facility for the measurement of health-related quality of life. The EuroQol Group. Health Policy 1990;16:199-208
- Gold MR, Siegel JE, Russell LB, et al., eds. Cost-Effectiveness in Health and Medicine. New York, NY: Oxford University Press, 1996
- CHOosing Interventions that are Cost Effective (WHO-CHOICE). World Health Organization (WHO), Geneva, Switzerland, 2010. Available at: www.who.int/choice/costs/CER_thresholds/en/index.html [Last accessed 1 July 2010]
- Kobelt G, Berg J, Lindgren P, et al. Costs and quality of life in multiple sclerosis in The Netherlands. Eur J Health Econ 2006;7:S55-64
- Kobelt G, Berg J, Lindgren P, et al. Costs and quality of life of multiple sclerosis in Italy. Eur J Health Econ 2006;7(Suppl 2):S45-54
- Kobelt G, Berg J, Lindgren P, et al. Costs and quality of life of multiple sclerosis in Austria. Eur J Health Econ 2006;7(Suppl 2):S14-23
- Kobelt G, Berg J, Lindgren P, et al. Costs and quality of life of multiple sclerosis in Germany. Eur J Health Econ 2006;7(Suppl 2):S34-44
- Kobelt G, Berg J, Lindgren P, et al. Costs and quality of life for patients with multiple sclerosis in Belgium. Eur J Health Econ 2006;7(Suppl 2):S24-33
- Kobelt G, Berg J, Lindgren P, et al. Costs and quality of life of multiple sclerosis in Switzerland. Eur J Health Econ 2006;7(Suppl 2):S86-95
- Kobelt G, Berg J, Lindgren P, et al. Costs and quality of life of multiple sclerosis in Spain. Eur J Health Econ 2006;7(Suppl 2):S65-74
- Berg J, Lindgren P, Fredrikson S, et al. Costs and quality of life of multiple sclerosis in Sweden. Eur J Health Econ 2006;7(Suppl 2):S75-85
- Kobelt G, Berg J, Lindgren P, et al. Costs and quality of life of multiple sclerosis in the United Kingdom. Eur J Health Econ 2006;7(Suppl 2):S96-104
- Henriksson F, Fredrikson S, Jonsson B. Costs, quality of life and disease severity in multiple sclerosis – a population-based cross-sectional study in Sweden. Stockholm: Stockholm School of Economics; 2000 SSE/EFI Working Paper Series in Economics and Finance, March. Report No. 361
- Henriksson F, Fredrikson S, Masterman T, et al. Costs, quality of life and disease severity in multiple sclerosis: a cross-sectional study in Sweden. Eur J Neurol 2001;8:27-35
- Kobelt G, Lindgren P, Parkin D, et al. Costs and quality of life in multiple sclerosis. a cross-sectional observational study in the UK. Stockholm: Stockholm School of Economics; 2000 SSE/EFI Working Paper Series in Economics and Finance. Report No. 398
- Naci H, Fleurence R, Birt J, et al. The impact of increasing neurological disability of multiple sclerosis on health utilities: a systematic review of the literature. J Med Econ 2010;13:78-89
- Kind P, Hardman G, Macran S. UK Population norms for EQ-5D. Discussion Paper #172. University of York Centre for Health Economics, York, UK, 1999. Available at: www.york.ac.uk/inst/che/pdf/DP172.pdf [Last accessed 1 July 2010]
- Naci H, Fleurence R, Birt J, et al. Economic burden of multiple sclerosis: a systematic review of the literature. Pharmacoeconomics 2010;28:363-379
- Gyrd-Hansen D. Willingness to pay for a QALY: theoretical and methodological issues. Pharmacoeconomics 2005;23:423-432
- King Jr JT, Tsevat J, Lave JR, et al. Willingness to pay for a quality-adjusted life-year: implications for societal health care resource allocation. Med Decis Making 2005;25:667-677
- Ubel PA, Hirth RA, Chernew ME, et al. What is the price of life and why doesn’t it increase at the rate of inflation? [commentary]. Arch Intern Med 2003;163:1637-1641
- Braithwaite RS, Meltzer DO, King JT Jr, et al. What does the value of modern medicine say about the $50,000 per quality-adjusted life-year decision rule? Med Care 2008;46:349-356
- Lee CP, Chertow G, Zenios SA. An empiric estimate of the value of life: updating the renal dialysis cost-effectiveness standard. Value Health 2009;12:80-87