Abstract
Objective:
To use time trade-off (TTO) to compare patient preferences for profiles of two glucagon-like peptide (GLP-1) products for the treatment of type 2 diabetes (liraglutide and exenatide) that vary on four key attributes – efficacy (as measured by hemoglobin A1C), incidence of nausea, incidence of hypoglycemia, and dosing frequency (QD vs. BID) – and measure the contribution of those attributes to preferences.
Methods:
A total of 382 people with T2DM were recruited to participate in an internet-based survey consisting of a series of health-related questions, a conjoint exercise and a set of time trade-off items. In the conjoint exercise, respondents were presented with eight pairs of hypothetical GLP-1 profiles, and completed a time-tradeoff exercise for each pair.
Results:
The product profile representing liraglutide was preferred by 96% of respondents and resulted in significantly higher health utilities (0.038) than the product profile representing exenatide (0.978 vs. 0.94, p < 0.05). Estimated preference scores from the conjoint analysis revealed that efficacy measured by hemoglobin A1C is the most important attribute, followed by nausea, hypoglycemia, and dosing schedule.
Limitations:
On-line participants may not represent ‘typical’ type 2 diabetes patients, and brief product profiles represented results from clinical trials, not clinical practice
Conclusion:
Based on the four attributes presented, patients prefer liraglutide over exenatide. Preference is based on superior efficacy and less nausea more than less hypoglycemia and once-daily dosing.
Introduction
There are several methodologies that evaluate utilities of healthcare interventions by deriving importance (or value) based on responses to alternative scenarios (e.g., standard gamble, time trade-off (TTO), and discrete choice). In TTO, respondents compare the number of years of life they would give up in order to live fewer years in an improved health state, which yields health utilities ranging from 0.0 to 1.0, with 0.0 being the worst quality of life and 1.0 being perfect healthCitation1,Citation2. The TTO methodology is a direct elicitation of utilities and is used in cost-utility analyses comparing cost and preferences of different healthcare interventions. Thus, for example, the National Institute for Health and Clinical Excellence (NICE) in the United Kingdom (UK) prefer data from TTO analyses in the form of quality-adjusted life years (QALY) as input to cost-utility evaluations of new interventions. Similarly, in the US, the Academy of Managed Care Pharmacy (AMCP) format for formulary submission version 3.0 guidelines recommends the use of cost-effectiveness analysis using QALY as a preferred method of quantifying the value of pharmacotherapeutic interventionsCitation3.
TTO was originally conceived in the context of diseases associated with daily burdens so great that patients might reasonably choose to live a shorter span in greater comfort (e.g., cancer), but has more recently been applied to asymptomatic chronic conditions like type 2 diabetes (T2DM)Citation4,Citation5. T2DM is characterized by high blood glucose, which, if not adequately controlled, can lead to complications such as cardiovascular disease, kidney damage, neuropathy, and blindness. There are several pharmaceutical treatment options (e.g., biguinides, sulfonylureas, thiazolidinediones (TZDs), dipeptidyl peptidase-4 inhibitors (DPP-IVis), glucagon-like peptide-1s (GLP-1s), and insulin) to control blood sugar levels that may differ on the following dimensions: (a) mechanisms of action; (b) level of efficacy in controlling blood glucose levels; (c) side-effect profiles, (d) route of administration (i.e., oral vs. injectable), and (e) dosing frequency. Therapy selection is generally driven by clinicians, but patients are playing an increasing role in the decision-making process, and patient preference and satisfaction have been demonstrated to be positively correlated with adherenceCitation6. As a result, measuring differences in product perceptions and understanding drivers of patient preference are becoming increasingly important. To the extent that patient preference influences adherence, a preferred medication may be associated with better diabetes management and lower long-term healthcare related costs.
To date, no studies directly compare the health utilities associated with the two available GLP-1 products – liraglutide and exenatide. Exenatide (Byetta) is a synthetic version of the molecule exendin-4, requires twice-daily subcutaneous administration and has demonstrated efficacy with respect to glycemic control and weight loss. Liraglutide (Victoza) is a once-daily human GLP-1 analogue that is approved as an adjunct to diet and exercise to improve glycemic control in adults with type 2 diabetes, and can be injected without regard to timing of meals. The glucose-dependent mechanism of action of the GLP-1 products helps minimize the incidence of hypoglycemia – a key limitation of earlier-generation agents. In addition, the class offers the potential benefit of weight lossCitation7. A recent consensus statement by the American Diabetes Association/European Association for the Study of Diabetes, therefore, recommends use of GLP-1 agents in patients where hypoglycemia is undesirable and/or promotion of weight loss is important, and the hemoglobin A1C (HbA1c) level is close to target (<8.0%)Citation8.
This research, then, was designed to examine how people with T2DM evaluate the clinical profiles of two GLP-1 products based on findings from a head-to-head clinical trial between liraglutide and exenatide. The profiles varied on four attributes: efficacy in controlling blood glucose, dosing frequency, incidence of hypoglycemia, and transient incidence of nausea. The purpose was to: (a) evaluate the preferences for the profiles of liraglutide and exenatide; and (b) establish the relative importance of the four attributes in health utility calculations by quantifying the relative strength of the various attributes in contributing to patient preference.
Patients and methods
Survey instrument
The survey instrument consisted of the EQ-5D index, the EQ-5D visual analogue scale (VAS), a TTO exercise in which respondents compared the profiles of the liraglutide and exenatide, a conjoint exercise in which respondents compared a series of TTO exercises for hypothetical product profiles, and a series of demographic measures.
The EQ-5D instrument is widely used as a measure of health benefit in cost-utility analysis and is one of the instruments recommended in guidelines for health economic analysis and health technology assessmentsCitation9,Citation10. The EQ-5D comprises five dimensions (mobility, self-care, usual activities, pain/discomfort and anxiety/depression), each with three levels (no problems, some problems, extreme problems/unableCitation11,Citation12. The EQ-5D visual analogue scale (VAS) is a single rating of health on a scale from 0 to 100 with ‘0’ representing ‘the worst imaginable health state’ and ‘100’ representing ‘perfect health.’
In the TTO task, respondents were presented with a pair of product profiles representing the two GLP-1 agents and asked separately for each one whether they would prefer taking the product for 10 years or living for fewer years free of diabetes. Although the anchor is commonly ‘perfect health’Citation13, the authors chose to use ‘life free of diabetes’ to reflect a more realistic decision scenario for the respondent and to limit the impact of potential co-morbidities on their choice. If respondents chose to live fewer years, they were required to enter how many diabetes-free years not taking the product would be equal to living 10 years taking the product (see ) with a response set of 1–9 years (only whole year responses were allowed). The 10-year time horizon is used as standard for the generation of the TTO value set for EQ-5D health statesCitation14, and limits the impact of the constant proportional trade-off that occurs when respondents discount the value of years of life in the futureCitation15,Citation16. The responses yielded ‘health utilities’ ranging from 0 to 1 for the health state defined as ‘living with diabetes as managed by this drug.’ By comparing the years conceded for each drug it was possible to derive preference for one drug or the other. If there was no difference in years of life traded for the two products, then respondents were required to state which product they preferred (i.e., discrete choice).
The product profiles for the TTO exercise comparing liraglutide and exenatide were developed based on findings from the Liraglutide Effect and Action in Diabetes 6 (LEAD 6) trialCitation17 (See ). The LEAD 6 trial (n = 464) was a 26-week, phase 3b, multicenter, multi-national, open-label, active comparator, parallel-group study comparing liraglutide 1.8 mg (once daily) with exenatide 10 μg (twice daily), with each product added to metformin and/or sulfonylurea. Patients receiving liraglutide showed a statistically significant decrease in mean HbA1c compared with those receiving exenatide (1.12 vs. 0.79%). The findings from the trial were used to describe product attributes to survey respondents by presenting probabilities of attribute occurrence. Weight loss was not included as a separate attribute because there was not a significant difference between the products in reduction of body weight during the 26-week clinical trial.
Table 1. Profiles of liraglutide and exenatide.
Following presentation of the profiles for the two GLP-1 agents, a conjoint experiment was used to establish the relative importance of four attributes: efficacy, dosing schedule, nausea, and hypoglycemia. Conjoint experiments are used to estimate how much weight respondents assign to various product attributes by deconstructing those products into constituent attributes and levels, and presenting a series of profiles that reflect permutations of the possible attributes. Attributes and levels used in this study are shown in . Discussions with participants’ revealed that it was difficult to personalize incidence estimates, and therefore, for the conjoint exercise, more definitive statements were used.
Table 2. Attributes and levels in the conjoint experiment.
Participants made judgments about a systematic subset of product profiles created by combining different levels of performance on the attributes of interest that allowed utilities to be estimated for all possible product profiles. In this instance, an orthogonal design for the main effects of the attributes was employed that required showing respondents a series of eight product pairs. The first product pair presented was held constant across all respondents and represented the best and worst profiles. Participants who failed to trade different amounts of life for the two products on the first card were not required to trade on subsequent tasks but were asked which product they preferred on all subsequent tasks. The last seven conjoint choice sets were randomized for each respondent so as to prevent order-effect biases.
The survey finished by asking respondents to complete a series of sociodemographic questions.
Pre-test
Before collecting data from several hundred respondents in a self-administered survey via the internet, an in-person pre-test was conducted to ensure that respondents clearly understood the TTO exercise and were providing answers that reflected their intentions. This recommended step in the survey process was warranted primarily because TTO surveys have traditionally been administered in-person to small samples, and relied heavily on interviewer-assisted protocols to minimize respondent confusion and/or errorCitation15.
An initial pre-test in which ten respondents completed the TTO survey was conducted and input from the respondents revealed a need to adjust the TTO survey. The revised instrument was pretested again in ten respondents and all confirmed that their answers reflected their intentions (see ).
Participants
E-mail invitations were sent in December 2008 to roughly 14,000 people in an online panel. A total of 2,015 individuals (14.3%) responded to the survey invitation and answered a series of eligibility questions designed to identify type 2 diabetes patients between the ages of 30 and 65 (). That response rate is typical of internet surveys of this nature.
Figure 1. Flow chart of recruiting process.
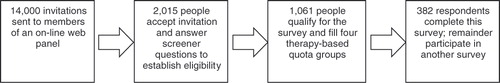
A total of 1,061 respondents, or 52.6% of the individuals who entered the screener, qualified for the survey. The most common reason for disqualifying potential respondents was that they did not have T2DM. Patients were assigned to four quota groups that reflected current diabetes treatment (i.e., one oral anti-diabetes drug (OAD), two OADs, exenatide or insulin). In total, 382 respondents participated in the survey (see ).
Data analysis
Mean TTO scores from the comparison of liraglutide and exenatide were compared using a paired t-test. Data from the conjoint exercise were modeled using a hierarchical Bayesian linear modelCitation18, and analyzed using Gauss (Aptech Systems, Inc.) software. The model used assumed an additive model for effects of the four attributes. This additivity assumption has been made in other health state valuation studiesCitation19,Citation20. The hierarchical linear model estimates respondent-level coefficients (or ‘partworths’) that represent the effect of each level of each attribute to the respondent's response. Bayesian estimation was chosen because it produces estimates that reflect the heterogeneity of individuals while maintaining the stability of estimates by pooling information across similar respondentsCitation21. Because coefficients are estimated at the individual level, it is possible to estimate TTO utilities values at the individual level for any combination of attribute levels. These individual-level scores can then be summarized by subgroup, or by applying survey-weights to obtain population-level estimates. In addition, individual-level estimated scores can be aggregated to estimate the relative importance that respondents assign to each attribute, in the context of the attributes and levels presented in the conjoint experiment. The relative importance is calculated by dividing the difference in the average TTO utility for the best and worst levels for each attribute across all possible scenarios and across all respondents by the sum of those mean differences. The relative importance, therefore, always sums to 100.
Seven respondents were excluded from the conjoint analysis because their response to the first conjoint, which presented a choice between the best and worst hypothetical profile, indicated that they did not understand the trade-off exercise.
All data have been weighted to ensure that the sample accurately represents the population of T2DM patients, but weights had no material impact on the results.
Results
Demographics
Respondent demographics are shown in . The mean age of respondents was 53 years (SD 8.75), and the mean time since diagnosis of diabetes was 7.3 years (SD 5.28), making them slightly younger and closer to diagnosis than averages in the National Health and Nutrition Examination Survey (NHANES) database from 2003 to 2006 (mean age 59.2 years, and mean time since diagnosis of diabetes 11.2 years).
Table 3. Demographics of the study sample.
Patients reported a mean HbA1C of 7.3%, which is just slightly above the American Diabetes Association (ADA) recommended glycemic target of an HbA1C < 7% and slightly below the average HbA1C of 7.6% for people with diabetes in the USCitation8,Citation22.
The mean EQ-5D score for the entire sample was 0.80 (SD 0.225) and the mean VAS score was 67.6 (SD 18.8), which is similar to the UKPDS study that estimated utility values for health states of type 2 diabetic patients using the EQ-5D in the UKCitation23. The self-reported health status based on the EQ-5D index can be found in .
Table 4. Self-reported health status of study sample.
Patient preferences
In all, 96% of patients preferred the product profile representing liraglutide to the product profile representing exenatide. The mean TTO scores were 0.978 (CI 0.964; 0.989) for liraglutide vs. 0.94 (CI 0.923; 0.955) for exenatide giving a mean difference in TTO score of 0.038 which was statistically significant across the profiles representing the two products (p < 0.05). In addition, significantly fewer respondents were willing to trade years of their life to avoid the product profile representing liraglutide than the product representing exenatide (7 vs. 22%, p < 0.05).
Analysis of conjoint data: attribute importance
Data from the conjoint exercise were used to calculate the relative importance and patient preference of each of the four attributes, and the results are displayed in . The estimated importance scores from the conjoint analysis reveal that efficacy measured by HbA1C is the most important attribute, accounting for 39% of the difference between scenarios, followed by nausea (30%), hypoglycemia (17%), and dosing schedule (14%). As a result, it appears that patient preference aligns with ADA guidelines in that both identify glucose control as the most important clinical parameter.
Table 5. Relative importance and utilities for the product attributes.
Discussion
This research was undertaken to provide patient preference data regarding GLP-1 therapies for the treatment of type 2 diabetes when four product attributes are varied.
The TTO scores for the two products −0.978 for liraglutide and 0.94 for exenatide – suggest that both products are generally acceptable to patients; however, virtually all patients (96%) prefer the profile matching once-daily liraglutide to the profile matching twice-daily exenatide. Research on patient preference has suggested that it can play an important role in adherence to medications and other treatmentsCitation24,Citation25. To the extent that patient preference influence compliance, these findings suggest that patients may persist in using liraglutide longer than exenatide, which in turn, could result in better diabetes managements. That hypothesis is, of course, only subject to empirical examination after the products have been on the market for several years.
The health-utility scores for both products are significantly higher than participants’ EQ-5D scores of 0.8. Given that the EQ-5D and TTO exercise are both designed to measure health state, those scores might be expected to align more closely (as they have been in prior studiesCitation4,Citation26. The authors hypothesize that the higher health utilities in the present TTO exercise are likely attributable to one or more of the following factors. First, the discrepancy may be explained by loss aversion, an aspect of Kahneman and Tversky's Prospect Theory, which posits that potential losses are more salient than potential gains (e.g.,Citation27). In the TTO task, respondents are asked to think about potential losses of years of life, whereas in the EQ-5D they simply rate their own feelings and behaviors. This may be a viable explanation for this discrepancy, and in fact, prior research in the field of health economics has demonstrated loss aversion to result in heightened utility scores compared to neutral or gain-oriented decision tasksCitation20,Citation28. Alternatively, it may be a function of the time horizon used in the TTO because people appear to be more willing to trade years with a longer time horizonCitation16,Citation29. Those previous studies with patients with diabetes all used remaining estimated life span, which (on average) likely exceeded 10-year time horizon of the present study by more than two decades. Finally, the population in this study may have been slightly healthier than in previous studies (e.g.,Citation4,Citation26) in that it excluded type 1 diabetics and included fewer people taking insulin.
This research has also demonstrated that conjoint methodology can be effectively applied to TTO questions. Having illustrated the value of a conjoint methodology when comparing two product profiles within the same class of therapy, it remains to extend the methodology to comparing products from different classes of therapy that might be expected to provide more divergent data. Specifically, it would be valuable to compare profiles that represent GLP-1 injectable products with profiles that represent oral agents to help quantify the importance that route of administration plays relative to efficacy and safety.
As with any study, there are limitations with this kind of research. For example, participants were recruited and surveyed online, and therefore, may not represent a ‘typical’ type 2 diabetes patient. The authors believe, however, that the additional power afforded by an on-line methodology is well worth any cost associated with the potential for selection bias. In addition, the product profiles were based on a few salient variables that influence what patients might experience, but it is possible that providing a broader set of attributes could have altered response patterns, though that possibility seems remote. Finally, it is worth noting that the product profiles were based on findings from a clinical trial conducted in controlled environment, and therefore do not necessarily represent actual practice due to potential participation and observer bias effects. Those caveats notwithstanding, the authors believe that the study provides a novel and methodologically sound way to assess patient preferences and health utilities.
Conclusion
In conclusion, this research demonstrates that online surveys represent a viable way to assess health utilities associated with diabetes products, and that conjoint analysis can help to identify drivers of importance between product offerings. In this instance, it appears that patients prefer the profile representing liraglutide over profile representing exenatide. This preference is based on superior efficacy and differences in rates of nausea.
Transparency
Declaration of funding
This study was funded by Novo Nordisk A/S, Bagsværd, Denmark.
Declaration of financial/other relationships
C.C. and M.H. have disclosed that they are employees and shareholders of Novo Nordisk. M.P., E.Z. and S.M. have disclosed that they are employed by National Analysts Worldwide, which received research funding from Novo Nordisk for this study.
Supplementary Material
Download MP3 Audio (5.4 MB)Acknowledgments
The authors thank Anka Wagner and Dr Jessica Hatz of National Analysts Worldwide for statistical programming and logistical support, respectively.
A version of this paper was presented at the International Society for Pharmacoeconomics and Outcomes Research 14th Annual International Meeting May 16–20, 2009, Orlando Florida, USA as a poster with the title ‘Evaluation of GLP-1 product attributes in treating people with type 2 diabetes in the US: comparing time-trade-off and willingness-to-pay methodologies’.
Notes
*Amylin Pharmaceuticals, Inc., San Diego, CA, USA.
†(Novo Nordisk A/S, Bagsværd, Denmark).
References
- Torrance GW, Thomas WH, Sackett D. A utility maximization model for evaluation of health care programs. Health Serv Res 1972;7:118-133
- Torrance GW. Measurement of health state utilities for economic appraisal. A review. J Health Econ 1986;5:1-30
- Academy of Managed Care Pharmacy. Format for Formulary Submissions (Version 3.0). Alexandria, VA, 2009
- Chancellor J, Aballea S, Lawrence Al, et al. Preferences of patients with diabetes mellitus for inhaled versus injectable insulin regimens. Pharmacoeconomics 2008;26:217-234
- Huang ES, Brown SES, Ewigman BG, et al. Patient perceptions of quality of life with diabetes-related complications and treatments. Diabetes Care 2007;30:2478-2483
- Peyrot M, Rubin RR. How does treatment satisfaction work? Diabetes Care 2009;32:1411-1417
- Gallwitz B. Glucagon-like peptide−1-based therapies for the treatment of type 2 diabetes mellitus. Treat Endocrinol 2005;4:361-70
- Nathan DM, Buse JB, Davidson MB, et al. Medical management of hyperglycemia in type 2 diabetes: a consensus algorithm for the initiation and adjustment of therapy. Diabetes Care 2008;31:1-11
- National Institute for Health and Clinical Excellence. Guide to the Methods of Technology Appraisal. National Institute for Health and Clinical Excellence, England (UK) 2004 (cited 2009 Jan 20) Available from: http://www.nice.org.uk/niceMedia/pdf/TAP_Methods.pdf
- Weinstein MC, Siegel JE, Gold MR, et al. Recommendations of the panel on cost-effectiveness in health and medicine. JAMA 1996;276:1253-1258
- Brooks R, Rabin R, de Charro F. The measurement and valuation of health status using EQ-5D: a European perspective. Dordrecht: Kluwer Academic Publishers, 2003
- Rabin R, de Charro F. EQ-5D: a measure of health status from the EuroQol Group. Ann Med 2001;33:337-343
- King JT, Styn MA, Tsevat J, et al. ‘Perfect health’ versus ‘disease free’: the impact of anchor point choice on the measurement of preferences and the calculation of disease-specific disutilities. Med Decis Making 2003;23:212-225
- Wittrup-Jensen KU, Lauridsen J, Gudex C, et al. Generation of a Danish TTO value set for EQ-5D health states. Scand J Public Health, 2009;37:459-466
- Arnesen T, Trommald M. Are QALYs based on time trade-off comparable? – A systematic review of TTO methodologies. Health Econ 2004;14:39-53
- Stiggelbout AM, Kiebert GM, Kievit J, et al. The ‘utility’ of the time trade-off method in cancer patients: feasibility and proportional trade-off. J Clin Epidemiol 1995;48:1207-1214
- Buse J, Rosenstock J, Sesti G, et al. Liraglutide once a day versus exenatide twice a day for type 2 diabetes: a 26-week randomised, parallel-group, multinational, open-label trial (LEAD-6). Lancet 2009;374:39-47
- Rossi PE, Allenby GM, McCulloch R. Bayesian Statistics and Marketing. Marketing Science 2003;22:304-28
- O’Brien B. Principles of economic evaluation for healthcare programs. J Rheumatol 1995;7:1399-1402
- Matza LS, Boye KS, Yurgin N, et al. Utilities and disutilities for type 2 diabetes treatment-related attributes. Qual Life Res 2007;16:1251-1265
- Allenby GM, Rossi PE. Marketing models of consumer heterogeneity. J Econom 1999;89:57-78
- Saydah SH, Fradkin, J, Cowie, CC. Poor control of risk factors for vascular disease among adults with previously diagnosed diabetes. JAMA 2004;291:335-342
- Clarke P, Gray A, Holman R. UKPDS 62. Estimating utility values for health states of type 2 diabetic patients using the EQ-5D. Med Decis Making 2002;22:340-349
- Hunot VM, Horne R, Leese MN, et al. A cohort study of adherence to antidepressants in primary care: the influence of antidepressant concerns and treatment preferences. prim care companion. J Clin Psychiatry 2007;9:91-99
- Raue PJ, Schulberg HC, Heo M, et al. Patient preferences for depression treatment and initiation, adherence, and outcome: a randomized study in primary care. Psychiatr Serv 2009;60:337-343
- Brown GC, Brown MM, Sharma S, et al. Quality of live associated with diabetes mellitus in an adult population. J Diabetes Complications 2000;14:18-24
- Kahneman D, Tversky A. Prospect theory: an analysis of decision under risk. Econometrica 1979;47:263-292
- Bleichrodt H, Pinto JL, Abellan-Perpinan JM. A consistency test of the time trade-off. J Health Econ 2003;22:1037-1052
- Buckingham JK, Birdsall J, Douglas JG. Comparing three version of the time tradeoff: time for a change? Med Decis Making 1996;16:335-347
Appendix
TTO Task.