Abstract
Objective:
As a component of healthcare reform, payers, hospital administrators, and physicians are looking for ways to reduce hospital expenditures and improve efficiency. The economic benefit of a reduced hospital stay must be weighed against the cost of the treatment or process necessary to achieve the reduced length of stay (LOS). The objective of this paper was to estimate the potential economic benefit of a reduction in inpatient hospital LOS for a common type of admission, community acquired pneumonia (CAP).
Research design and methods:
Data for this study were from the CAP hospital admissions selected from the 2006 Healthcare Cost and Utilization Project (HCUP) National Inpatient Sample (NIS). Potential savings associated with a 1 day reduction in CAP LOS were estimated using three methods: (1) average cost, (2) weighted-average incremental cost of an additional day, and (3) weighted-average predicted mean costs from regression models which were used to estimate incremental cost adjusting for hospitalization characteristics.
Main outcome measures:
Cost per day of CAP hospitalization.
Results:
A total of 1,471,295 CAP admissions qualified for the analysis. The cost for each day of reduction in LOS in 2009 US dollars was $2273, $2373, and $2319 for the three methods: simple average, incremental, and regression, respectively. Subgroup analysis and regression analysis indicated higher costs were identified: in patients who died in the hospital, had hospital stays in the Northeast or West, and in large hospitals. Longer CAP hospitalizations had a higher cost per additional day. Limitations include those typically associated with the use of administrative claims (e.g., lack of clinical detail, issues related to diagnosis coding).
Conclusions:
Eliminating a day during the course of a CAP admission is potentially worth $2273–2373 in economic benefits (2009 dollars). As we strive for greater efficiency in healthcare delivery, changes in processes and/or improved diagnostics or treatments may potentially achieve a reduction in the length of stay. The cost of such changes or improvements must be weighed against the economic benefit of a shorter hospitalization.
Introduction
Of the $787 billion dollars in the American Recovery and Reinvestment Act of 2009 (stimulus package), $1.1 billion is to be spent for Comparative Effectiveness Studies (CES) for high priority disease states, and approximately $36 billion is allocated to Health Information Technology (HIT) over the next 6 years. This investment in research and infrastructure is intended to result in cost savings and efficiencies in future yearsCitation1,Citation2.
Research to assess the impact of CES and HIT may need to be conducted in disease- or DRG-specific studies to better understand the dynamics within a disease. For example, will an optimal community-acquired pneumonia (CAP) treatment algorithm for hospitalized patients coupled with a HIT decision support tool reduce hospital length of stay and provide cost savings to the healthcare system? How much resource should be expended to reduce CAP hospitalization by 1 day?
Because each sequential day of a hospitalization for a specific condition may have a different expected cost, a decision analysis tool would need to be populated with reliable cost estimates for a 1 day shorter hospitalization in that disease or DRG. To determine if optimal treatment and/or processes could result in a lower cost length of stay (LOS), the economic value of the 1 day shorter hospitalization needs to be quantified. The resources expended to achieve a 1 day reduction should not cost more than the cost of the 1 day shorter hospitalization (assuming equal long-term outcomes).
Previous researchers have estimated the cost associated with a 1 day reduction by using cost accounting or daily billing data to determine the cost of the procedures which were conducted on the last discharge day. The last day is usually a day with few procedures or new lab tests being done, and much of the emphasis is on preparing to discharge patients. Patients can spend hours in their street clothes waiting for paperwork or administrative details to be completed before they go home.
Using a cost accounting database across many DRGs, Teheri et al. concluded that eliminating the last day of a hospitalization resulted in $396 of (variable direct cost) savings in surgical patients or $432 in non-surgical patients without including overhead costs (1998 dollars)Citation3. When adjusted by the CPI (Consumer Price Index) for hospital and related services, these are $777 and $848 in 2009 dollars respectivelyCitation4. Their cost estimates were restricted to variable direct cost that could be assigned to a specific patient. Some patient specific costs (such as dietary, housekeeping, billing) were not included because of the limitations of their cost accounting system. In the fiscal year studied, 58% of the hospital's actual costs were not linked to a specific patient day (overhead) in their accounting system. As such, they assumed only 42% were direct variable costs subject to being saved or avoided if the LOS was reduced. Another study estimated that 87% of the cost of any admission is overhead, arguing that the true marginal cost of each additional admission is only 13% of the total cost, and efforts to reduce LOS are not justified based on costCitation5.
Marginal or variable direct costs may be accurate for estimating the benefit of eliminating the discharge day (the last day) of one patient admission only if that empty bed cannot be reallocated.
If overhead costs were included in the cost of the last-inpatient day in the Teheri et al. study, the cost savings associated with avoiding the last hospitalization day are increased by 138% to $943 and $1028 for surgical and nonsurgical patients respectively (in 1998 dollars across all DRGs)Citation3. These translate to $1851 and $2018 respectively in 2009 dollars. As the cost of the last hospitalization day increases, it justifies the use of more resources to reduce LOS to achieve maximal efficiency (assuming equal outcomes).
A variable-cost-only analysis of the last hospitalization day underestimates the savings from reduced LOS and decreases the incentive to reduce LOS and improve efficiency. Therefore, future HIT assessment decision support tools should be based on the assumption that per patient overhead cost can be reduced to the extent that volume (admissions) is increased, and the empty hospital bed is allocated to another patient (opportunity cost).
The Pneumonia PORT study used billing data from three hospitals to estimate the cost of the last day (discharge day) for CAP patients from 1991 to 1994, but unlike the approaches of Tehri and Roberts, they included both variable and overhead costs in their estimates. Their estimates for costs associated with the discharge day without inflation adjustment were $534, $686, and $822 (1991-1994 dollars) in the three hospitals studied or $1361, $1749, and $2095 respectively in 2009 dollarsCitation6.
Unlike previous research, the methodology in this paper does not focus on the cost analysis of the last “discharge” day. Our focus was to report what could be saved if the length of a CAP hospitalization was reduced by 1 day, for example, reducing a 5-day hospitalization to 4 days, etc. This may be achieved through improved diagnostic or treatment processes or technologies which are implemented any time during the hospitalization to improve health of CAP patients more quickly. Our contention is that the low cost “discharge day” with few new procedures or tests being performed will always exist, even if the hospitalization becomes 1 day shorter using improved processes or treatments. In this paper, the term ‘1-day-reduced’ will appear in single quotes to reinforce that the day does not get cut from the end of the hospitalization as assumed by previous researchers, but is the result of efficiencies or improved outcomes throughout the course of the hospitalization, essentially eliminating 1 day of cost across the entire LOS. This concept is implemented using three different methods:
Simple average cost per CAP hospital day
Weighted-average incremental cost of a 1 day reduction in CAP hospitalization
The methods utilized for each of these options is fully described below.
Methods
Study description
The study design was a descriptive retrospective analysis. Data for the analysis were from AHRQ's Healthcare Cost and Utilization Project (HCUP) National Inpatient Sample (NIS). Detailed information about these databases is provided in Appendix ACitation7. The NIS sample is a weighted probability sample. To obtain valid US estimates, the data are adjusted using sampling weights to obtain the average cost of a CAP hospitalization in 2006. Standard errors were calculated using the method recommended by HCUP for the NISCitation7. SAS 9.2 for Windows was used for all analysesCitation8. The data set used for this analysis contained observations describing each hospitalization with CAP as one of the diagnoses that meets these inclusion criteria.
Inclusion/exclusion criteria
CAP discharges were included in the study if they met all of the following criteria:
Age ≥18 years on admission | |||||||||||
Length of stay ≥3 and length of stay ≤14 days | |||||||||||
Admission only from the ER and routine community-based sources
| |||||||||||
| ○ | Have at least one of the following ICD-9-CM codes in any of the diagnosis fields for the hospitalization (so that CAP may not have been the primary reason for the hospitalization, but pneumonia was present during the 5-14-day hospitalization): Pneumococcal pneumonia, 481.xx; Pneumonia, organism unspecified, 486.xx; Other bacterial pneumonia, 482.xx; Pneumonia due to other specified organism, 483.xx; Bronchopneumonia, organism unspecified, 485.xx Note: ICD-9-CM diagnosis codes may be 3, 4, or 5 digits; “x” for the 4th or 5th digit indicates inclusion of any further sub-categorization, should it exist. | ||||||||||
Analytic methods
Charges for each hospitalization were converted to costs using the hospital-specific cost-to-charge ratios included as part of the NIS file for 2006. All cost estimates were converted to June 2009 dollars using the US BLS CPI for hospital and related services (US city average)Citation4.
Simple average analysis
For the simple average method, the mean cost for the hospitalization is divided by the mean LOS to determine the average cost per day. The simple average cost per day across all CAP hospitalizations meeting all criteria is reported. These estimates were further refined by evaluating subsets of data based on a set of patient-level and hospital-level variables, such as patient gender or the hospital's region (but not LOS).
Descriptive incremental analysis
The descriptive incremental analysis used a similar process as the simple average analysis, with a focus on subsets of data based on varying lengths of stay. The mean cost of hospitalization within each LOS-duration was calculated. The change in the mean cost as the LOS changed by 1 day was reported. Only lengths of stay that differ by 1 day were evaluated. For example, the mean cost for a 5-day CAP LOS and a 6-day LOS were calculated and the difference between these values was presented as the incremental cost for the additional day. A weighted average based on the number of cases of each LOS of the incremental differences in cost was calculated to obtain a summary statistic for this method. Analyses were repeated by age group, gender, discharge status, location (urban/rural), and bed size (small, medium and large).
Regression analysis
As other variables besides LOS may influence cost, the regression analysis approach adjusted for these differences across the various lengths of CAP hospitalizations. The regression analyses was used to estimate the cost of an additional day of CAP hospitalization using OLS regression that accounts for the NIS sampling plan (SAS PROC SURVEYREG)Citation7. The NIS sample is a probability weighted sample and that methods appropriate for this type of sampling were applied as recommended by AHRQ. The models included age, gender and disposition at discharge as patient-level covariates, and location (urban/rural), bed size, and region of the country as hospital-level covariates. The regression analysis was repeated for each LOS subset between 3 days and 14 days to obtain the 1-day difference in cost for the each 1 day difference in length of stay. For example, in one regression model with data from only the 3-day and 4-day CAP hospitalizations, controlling for the covariates listed above, the additional cost for the extra day was estimated. The regression models were repeated with the data from each adjoining days (four with 5-day LOS model, five with 6-day LOS model, etc.) until the covariate-corrected cost for each sequential additional day was estimated. To obtain a summary statistic for this method, the mean cost per day was calculated using a weighted average of the estimated cost per day for each LOS from day 4 through day 14. A similar multivariate approach was used by Candrilli and Mauskopf to estimate cost per day across several DRGsCitation9.
Results
A total of 1,471,295 CAP hospitalizations (after weighting) in 2006 qualified for the analysis. The mean age of patients was 69.9 years. In the sample, 87.4% of hospitalizations were for a diagnosis of ‘Pneumonia, organism unspecified (486.xx)’ and 8.7% for ‘Other bacterial pneumonia (482.xx)’. The remaining 3.9% of hospitalizations were for the three remaining diagnoses.
The mean cost per CAP hospitalization in the sample was $14,283 (2009 dollars). The mean LOS was 6.3 days, resulting in a mean cost per day of $2,273. The mean cost per day varied by patient and hospital characteristics, as shown in . Depending on the subgroup, the average cost per day ranged from a low of $1,962 in rural hospitals to a high of $3,227 for patients who died in the hospital.
Table 1. CAP hospitalizations which qualified for the analysis (day 3 through day 14) and their mean cost, LOS, cost/day by various sub-groups. (reported in 2009 dollars).
The three methods yield similar costs associated with a ‘1-day-reduced’ CAP hospitalization, with an economic benefit of $2,273, $2,373, and $2,319 (2009 dollars) for the average, incremental, and regression methods, respectively. The cost of a ‘1-day-reduced’ CAP hospitalization using the three different methods for various subsets within the sample were reported in .
Table 2. Cost savings potentially achieved by making a CAP hospitalization ‘1-day-reduced’ by selected admission or hospital characteristics, comparing three methods for estimating the economic benefit of a ‘1-day-reduced’ CAP hospitalization. (reported in 2009 dollars).
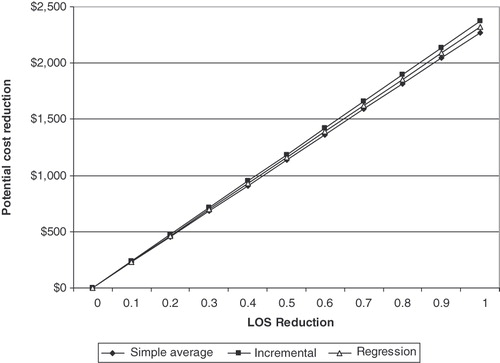
LOS has a skewed distribution in CAP, with 52% of the observations in the incremental and regression methods having a LOS of 6 days or less, and 80% were at 9 days or less. To illustrate the association between LOS and cost per day, the cost of the ‘1-day-reduced’ hospitalization, as a function of the length of the reference hospitalization is shown in . The simple average cost per day across all days (the benchmark) is shown in the figure as a horizontal line at $2,273. The cost per day for each LOS (days 4–14) was calculated using the incremental and regression methods. If a 4-day hospitalization can be reduced to a 3-day hospitalization, the ‘1-day-reduced’ costs were estimated to be $1,938 per day (by the incremental method) and $1,998 per day (by the regression method). These ‘1-day-reduced’ costs had an increasing trend () as the length of the hospitalization increased with the ‘1-day-reduced’ cost for 10–14-day hospitalizations ranging from $2,899 to $3,059 by the incremental method, and a range of $2,439–3,026 by the regression method. Estimates for the longer hospitalizations were less stable as the sample sizes were smaller.
Figure 1. Cost savings potentially achieved by making a hospitalization ‘1-day-reduced’ by the length of stay of the reference CAP hospitalization, comparing three methods for estimating the economic benefit of a ‘1-day-reduced’ CAP hospitalization (reported in 2009 dollars).

The regression model can be used to estimate the potential economic benefit related to multiple variables which may increase or decrease the predicted benefit of a ‘1-day-reduced’ LOS. For example, a predicted savings of $1,077 per ‘1-day-reduced’ LOS is predicted in a rural, small hospital in the South for a 95-year-old female CAP patient who was discharged alive. In contrast, a potential savings of $3,630 per ‘1-day-reduced’ LOS is predicted in an urban, medium sized hospital in the Western US for a 35-year-old male CAP patient who died during the hospitalization.
The mean LOS of CAP hospitalizations with a duration under 15 days in this nationally representative sample was 6.3 days in 2006. As new processes and technologies are employed, there may be small incremental reductions in the mean LOS gradually decreasing the mean by partial days. The cost associated with a partial day of reduction as estimated by the three different measures is shown in , with all three methods yielding very similar estimates for each partial day reduction.
Figure 2. Potential cost savings which are achieved with a portion of a ‘1-day-reduced’ LOS, comparing three methods for estimating the cost of a ‘1-day-reduced’ CAP hospitalization (reported in 2009 dollars).
Discussion
In the 2006 AHRQ HCUP/NIS data, the average cost of a CAP admission of at least 3 days and less than 15 days was $14,283 (2009 dollars). This is compared to the $5,942 in 1991–1994 dollars (or $15,148 in 2009 dollars) reported by Fine, and the $10,227 in 1996–1998 dollars (or $20,733 in 2009 dollars) reported by CaliceCitation10. These other reports may have resulted in higher costs for the full admission because they included the more expensive admissions with a LOS greater than 14 days.
The approach presented here to place an economic value on a reduction in LOS is based on the assumption that efficiency will need to be gained throughout the course of the hospitalization. This is different from the premise adopted in previous research by TeheriCitation3 or RobertsCitation5 where only the last hours or day of the hospitalization were eliminated. Given the realities of a hospital visit, there will always be a “last discharge day” when the number of new tests being ordered and procedures being preformed are reduced because they are not needed. The economic and clinical benefit to be achieved from new processes or technologies should not be judged against eliminating the last low-cost hours of a hospitalization. Instead the economic evaluation criteria should focus on reductions in LOS that accrue as a result of the adoption of new technologies and processes that can decrease total expense during the course of a hospitalization.
Other approaches could also have been taken to evaluate improvements in the economic efficiency of a CAP hospitalization beside the value of a LOS reduction in this paper. Future research could evaluate the reduction in the total cost of the stay. Using a measure of CAP treatment effectiveness, cost-effectiveness research can be conducted. Improvements in the method of assessing variable costs could also be considered as an improvement to the research which only considered direct costs on the last day.
The results indicated that the financial benefit associated with a ‘1-day-reduced’ LOS as estimated by the incremental and the regression methods is similar to the average cost per day of the hospitalization. Previous research by Fine has shown that 32% of the CAP hospitalization cost is incurred in the first 2 days of a 7-day stay, and the final days have lower than average daily costs. Application of the methods described above, when applied to the 2006 NIS hospital discharge database, indicate that as LOS changes for a CAP hospitalization by increments of 1 day, the change in cost is approximately equal to the average cost of a hospitalization day for CAP.
As the LOS of a CAP hospitalization increases, the financial benefit of ‘1-day-reduced’ LOS also increases. This may be expected because longer hospitalizations can either be due to multiple co-existing conditions, or higher severity of the CAP condition. The data used in this study did not directly address the reason for this, but future research could test the hypothesis that the increased cost we observed are due to multiple comorbidities or greater severity. Assuming efficiencies can be gained throughout the hospitalization, making 14-day hospitalization ‘1-day-reduced’ is expected to have a greater economic benefit than making a 4-day hospitalization ‘1-day-reduced’.
As decision support tools in healthcare become more sophisticated, they may help the clinician decide how much resource should be allocated to achieve an economical reduction in LOS. The regression model can be used to estimate the amount of increased resource that can be justified relative to the LOS reduction expected. For example, if two antibiotics with different prices can be used for CAP admissions, the decision support tool may help physicians decide if the more expensive antibiotic is justified to decrease LOS and total healthcare costs, assuming both have equal long term outcomes.
To select the admissions used in this analysis, the CAP diagnosis selection criteria included the hospitalization if the pneumonia diagnosis appeared in any of the 14 available diagnosis fields of the discharge record. Restricting the inclusion criteria to only include cases with pneumonia as the primary diagnosis resulted in economic benefit estimates that are approximately 20% lower by the regression method. Whittle et al. reported that such a diagnosis restriction in the inclusion criteria eliminates CAP patients with serious co-morbidities, and results in a less severe (less representative) sample with lower morbidity rate and LOSCitation11. A limitation of any study using diagnosis codes is that there may be errors, and some patients with a CAP diagnosis may actually have a pneumonia that was hospital acquired. The chance of this may increase as LOS increases and if secondary diagnoses are used for inclusion. Hence the data may include cases of pneumonia which are hospital acquired, however it is expected that these are a minority of the cases.
A limitation of the study design is that the US Agency for Healthcare Research and Quality (AHRQ) HCUP/NIS dataset does not include a CAP severity measure which can be used to adjust for severity differences. If such a severity measure was available, the ability to predict cost per day could be improved.
Of course, LOS reductions can not be accelerated beyond the patient's ability to heal; however healing is facilitated by optimal diagnosis and treatment. If LOS is simply shortened by compressing the exact same number of tests and treatments into a ‘1-day-reduced’ admission, the cost is only reduced by the bed charge, and the patient may not be ready to be discharged even if the list of billable procedures have been completed 1 day sooner. The focus should always be to get the patient ready to go home as soon as possible by increasing the efficiency and quality of the procedures and treatments that are provided, not just the speed. The term ‘1-day-reduced’ may not be the best choice of words because it does not automatically imply quality improvement, however the authors’ intent was to describe the savings that could be achieved if a patient was made healthy enough to be discharged with a ‘1-day-reduced’ hospitalization through process and treatment improvements. The emphasis was on quality improvement to cause cost reduction, not cost reduction alone.
In summary, as decision makers are being challenged to reduce length of stay, systems should be in place to support decisions on the appropriate deployment of resources to achieve an economic reduction in LOS. The advantage of the simple method reported in this study is that it is easy to calculate using data available at most hospitals. The incremental and regression methods have the advantage of being able to partly refine the estimate by patient and hospital type, allowing efficiency decisions to be tailored to the specific patient.
Conclusion
Using 2006 cost data from the US government developed HCUP/NIS database, the methods employed in this research indicated that each day of hospitalization for CAP was associated with a cost of $2,273–2,373 (reported in 2009 dollars). When medically appropriate, a reduction in the length of a CAP hospitalization by 1 day could decrease costs by this amount. Characteristics of the patient and the hospital can modify these cost savings. The three methods presented in this paper should be considered as ways to place an economic value or benefit on achieving an earlier discharge in a CAP hospitalization.
As comparative effectiveness research findings coupled with health information technology are employed: (1) to decrease the cost of CAP hospitalizations, (2) to improve CAP outcomes, and (3) to increase efficiencies in our healthcare system, the cost of adding or removing costly processes or treatments needs to be judged against the ability of the process or treatment to lower total costs of a hospitalization and/or improve outcomes, and not simply against the cost associated with the last and often the least costly discharge day of a hospitalization. Decreasing the total cost of a CAP admission may be best achieved by improving processes and treatments which in turn decrease the number of days or partial days of a CAP hospitalization.
Transparency
Declaration of funding
The sponsor was Ortho-McNeil Janssen Scientific Affairs LLC. Four of the authors were employees of OMJSA.
Declaration of financial/other relationships
Four of the authors were employees of the sponsor. The remaining three authors are consultants who were paid for their work on this project.
Acknowledgments
No assistance in the preparation of this article is to be declared.
This work, Dickson M, Kozma, CM, Ng DB, et al. Estimation of a cost of a half-day of hospitalization among patients with community acquired pneumonia, was previously presented at the 25th International Conference of Pharmacoepidemiology and Therapeutic Risk Management, Providence, Rhode Island, USA, August 16–20, 2009.
References
- H.R. #1 American Recovery and Reinvestment Act of 2009, section 13001-24. http://thomas.loc.gov
- An unprecedented Opportunity: Using Federal Stimulus Funds to Advance Health IT in California. California Healthcare Foundation Newsletter, pages 1-16, February, 2009
- Taheri PA, Butz DA, Greenfield LJ. Length of stay has minimal impact on the cost of hospital admission. J Am Coll Surg 2000;191:123-30
- www.bls.gov US city average, CPI Hospital and related services. Accessed on July 29, 2009
- Roberts RR, Frutos PW, Ciavarella GG, et al. Distribution of variable vs. fixed costs of hospital care. JAMA 1999;281:644-9
- Fine MJ, Pratt HM, Obrosky S, et al. Relation between length of hospital stay costs of care for patients with community-acquired pneumonia. Am J Med 2000;109:378-85
- HCUP Methods Series, Calculating Nationwide Inpatient Sample Variances, Report 2003-2, Appendix B
- SAS Institute Inc. The data analysis for this paper was generated using SAS/STAT software, Version 9.2 of the SAS System for Windows. SAS Institute Inc. SAS and all other SAS Institute Inc. product or service names are registered trademarks or trademarks of SAS Institute Inc., Cary, NC, USA
- Candrilli S, Mauskopf J. How much does a hospital day cost? Presented at the 11th Annual ISPOR Meeting, Philadelphia, May 20-24, 2006
- Colice GL, Morley MA, Asche C, et al. Treatments costs of community-acquire pneumonia in an employed population. Chest 2004;125:2140-6
- Whittle J, Fine MJ, Joyce DZ, et al. Community-Acquired pneumonia: can it be defined with claims data?. Am J Med Qual 1997;12:187-93
- HCUP. Beginning with the 2005 NIS data release the documentation is available only on the HCUP User Support Website (http://www.hcup-us.ahrq.gov)
- Houchens R, Elixhauser A, Sommers J. Changes in the NIS sampling and weighting strategy for 1998. HCUP Methods Series Report #2002-1. ONLINE. January 18, 2002. U.S. Agency for Healthcare Research and Quality. Available at us.ahrq.gov/db/nation/nis/reports/Changes_in_NIS_Design_1998.pdf
- Houchens R, Elixhauser A. Final report on calculating nationwide inpatient sample (NIS) variances, 2001. HCUP Methods Series Report #2003-2. ONLINE. June 2005 (revised June 6, 2005). U.S. Agency for Healthcare Research and Quality. Available:http://www.hcup-us.ahrq.gov
- HCUP Nationwide Inpatient Sample (NIS). Healthcare cost and utilization project (HCUP). 2000-2001. Agency for Healthcare Research and Quality, Rockville, MD. www.hcup-us.ahrq.gov/nisoverview.jsp
Appendix A
Source of data
The study design is a descriptive retrospective analysis. Data for the analysis are from the Healthcare Cost and Utilization Project (HCUP) National Inpatient Sample (NIS) for 2006 (the most recently available data at the time of the analysis) and the American Hospital Association (AHA) Annual Survey of Hospitals.
The HCUP NIS hospital discharge database HCUP consists of a group of databases that were developed by the Federal Agency for Healthcare Research and Quality (AHRQ). The AHA data are from the AHA annual survey of hospitals for 2006. All appropriate data use agreements have been signed. An overview of the data sources provides insight into the strengths and limitations of the estimates provided in this report.
NIS: The NIS (National Inpatient Sample) is the largest all-payer publicly available inpatient database in the USCitation12. A detailed explanation of the sampling and weighting strategy is available on the HCUP website, however, an overview of the sampling procedure is included here for referenceCitation13. The procedure includes the following steps:
The hospital universe is defined by all hospitals that were open during any part of the calendar year and were designated as community hospitals in the AHA Annual Survey of Hospitals, excluding rehabilitation hospitals. For purposes of the NIS, the definition of a community hospital is that used by the AHA, “all nonfederal short-term general and other specialty hospitals, excluding hospital units of institutions.” Consequently, Veterans Hospitals and other federal hospitals are excluded.
The NIS is a stratified sample of hospitals drawn from the subset of hospitals in states that make their data available to the HCUP project and that can be matched to the AHA survey data. Hospitals are stratified by region, location/teaching status (within region), bed size category (within region and location/teaching status), and ownership (within region, location/teaching, and bed size categories). The regions are the four census regions (Northeast, Midwest, South, and West). Location is defined by AHA's designation of urban or rural. Teaching hospitals are those with COTH membership, or with an AMA-approved residency program, or with an intern-to-bed ratio of 25% or higher. Bed size categories are small, medium, and large, with separate size cut points defined for each combination of hospital region, teaching status, and urban/rural designation. Ownership breakdowns are based on the degree of observed ownership variation within each region across bed size categories. Within each stratum, a systematic random sample of hospitals equal in size to 20% of the universe for that stratum is taken.
Hospitals are sorted by the first three digits of their zip code for the systematic sample. The NIS includes all discharges from the sampled hospitals.
The calculation of sample weights to the universe remains essentially unchanged (from the pre-1998 period) except for the changes in stratification described above.
The NIS data provides information that is typically included in a discharge abstract. The specific data fields include: primary and secondary diagnoses and procedures, admission and discharge status, patient demographics, payer source, total charges, length of stay, and hospital characteristics. In addition, it is possible to link the NIS data to American Hospital Association (AHA) records to obtain additional hospital level data.
Variable definitions
A complete description of NIS variables is available on-line; however, the main variables are briefly described hereCitation15.
Admission date
Patient age in years (all ages included)
Patient gender (both genders are included)
Patient race (six categories – reduced to white, black and other). Race, as a variable is problematic because nine states do not report it in 2006
Patient income (median household income by four categories based on the patient's zip code)
Multiple measures of disease severity constructed by AHRQ. This study used the pulmonary severity code
Hospital location (urban or rural location)
Hospital mission (teaching or non-teaching)
Hospital bed size category (three levels – small, medium, and large)
Hospital bed size (number of staffed beds from the AHA annual survey)
Hospital region (Northeast, Midwest, South, and West)
Admission source (ER, and routine)
Admission type (emergency, urgent, elective, newborn, trauma, and other)
Discharge disposition (22 categories including ‘died in hospital’). This study used the dichotomous variable: died in hospital vs. discharged alive.
Primary and secondary expected payer (Medicare, Medicaid, private, self-pay, no charge, and other)
Length of stay
Total charges
ICU availability (from AHA annual survey). Also available is the number of ICU beds in a hospital by type of bed (medical/surgical, cardiac, neonatal, pediatric, other, and burn)
Sample weights supplied with the NIS data used to obtain National estimates
Cost to charge ratios for 2005 (adjusted for 2006)