Abstract
Objective:
To evaluate lifetime cost effectiveness of atazanavir-ritonavir (ATV + r) versus lopinavir-ritonavir (LPV/r), both with tenofovir-emtricitabine, in US HIV-infected patients initiating first-line antiretroviral therapy.
Methods:
A Markov microsimulation model was developed to calculate quality-adjusted life-years (QALYs) based on CD4 and HIV RNA levels, coronary heart disease (CHD), AIDS, opportunistic infections (OIs), diarrhea, and hyperbilirubinemia. A million-member cohort of HIV-1-infected, treatment-naïve adults progressed at 3-month intervals through eight health states. Baseline characteristics, virologic suppression, cholesterol changes, and diarrhea and hyperbilirubinemia rates were based on 96-week CASTLE trial results. HIV mortality, OI rates, adherence, costs, utilities, and CHD risk were from literature and experts.
Limitations:
The incremental cost-effectiveness ratio (ICER) may be overestimated because the ATV + r treatment effect was based on an intention-to-treat analysis. The QALY weights used for diarrhea, hyperbilirubinemia, and CHD events are uncertain; however, the ICER remained <$50,000/QALY when these values were varied in sensitivity analyses.
Results:
ATV + r patients received first-line therapy longer than LPV/r patients (97.3 vs. 70.7 months), had longer quality-adjusted survival (11.02 vs. 10.76 years), similar overall survival (18.52 vs. 18.51 years), and higher costs ($275,986 vs. 269,160). ATR + r patients had lower rates of AIDS (19.08 vs. 20.05 cases/1,000 patient-years), OIs (0.44 vs. 0.52), diarrhea (1.27 vs. 6.26), and CHD events (5.44 vs. 5.51), but higher hyperbilirubinemia rates (6.99 vs. 0.25). ATV + r added 0.26 QALYs at a cost of $6826, for $26,421/QALY.
Conclusions:
By more effectively reducing viral load with less gastrointestinal toxicity and a better lipid profile, ATV + r lowered rates of AIDS and CHD, increased quality-adjusted survival, and was cost effective (<$50,000/QALY) compared with LPV/r.
Introduction
Protease inhibitor (PI)-based, combination antiretroviral therapy (cART) for human immunodeficiency virus (HIV) infection is one of the preferred treatment options for antiretroviral-naïve patientsCitation1. The increasing use of cART along with other medical advances has reduced mortality among HIV-infected individuals to a level almost equal that of uninfected populationsCitation2.
However, even with this population-level success, on an individual patient level the adverse effects associated with PI-based therapy (most notably gastrointestinal [GI] toxicity and increases in lipid values) can negatively impact medication adherence and the long-term effectiveness of these treatmentsCitation1. Atazanavir was introduced in 2003 as an alternative PI to the commonly used lopinavir, offering advantages to lopinavir that include a better GI tolerability profile, less impact on lipids, and once-daily dosing with a lower pill burden. The 96-week CASTLE study evaluated the efficacy of once-daily atazanavir-ritonavir (ATV + r) used in combination with tenofovir-emtricitabine (TDF/FTC) compared with twice-daily lopinavir/ritonavir (LPV/r) also with TDF/FTC. The primary results of the CASTLE study demonstrated that, in antiretroviral-naïve patients, an ATV + r-based regimen is noninferior to an LPV/r-based regimen in terms of efficacy, with less GI toxicity and lower increases in lipidsCitation3–5.
In this analysis, CASTLE’s 96-week data were applied to estimate long-term costs and benefits of the use of ATV + r versus LPV/r regimens. Specifically, an economic model was developed to project health and economic outcomes associated with long-term use of both regimens, evaluated by the number of primary GI-related toxicities (diarrhea and hyperbilirubinemia), coronary heart disease (CHD) events, acquired immunodeficiency syndrome (AIDS) diagnoses, and opportunistic infections (OIs).
Methods
Overview
A Markov microsimulation model () was developed to project, from a third-party payer perspective, the costs and health outcomes associated with treating antiretroviral-naïve HIV-1-infected patients under two scenarios: (1) treatment with ATV + r in combination with fixed-dose TDF/FTC, or (2) treatment with LPV/r in combination with fixed-dose TDF/FTC. Individuals whose first-line treatment failed in either scenario were assumed to progress to a second-line treatment with a basket of cART regimens; thus, the scenarios differed only in the choice of first-line PI used (ATV + r or LPV/r), and both reflected current treatment guidelines at the timeCitation1. For each scenario, total life-years, numbers of AIDS diagnoses and CHD outcomes (myocardial infarction, angina, or stroke), and rates of diarrhea, hyperbilirubinemia, and OIs were projected over 1-, 2-, 5-, 10-, 20-year and lifetime periods.
Figure 1. Structure of Markov microsimulation model of ATV + r compared with LTV/r among antiretroviral therapy–naïve HIV-infected patients. Patients enter model in LPV/r or ATV + r first-line treatment, distributed among the low-viral-load states (2, 4, 6, 8) based on CASTLE trial population. HIV states are defined by CD4 count and mRNA levels, event risks are based on HIV state, lipid levels, and treatment (LPV/r, ATV + r, or second-line), and patients advance to second-line treatment after severe diarrhea, severe hyperbilirubinemia, or treatment failure.
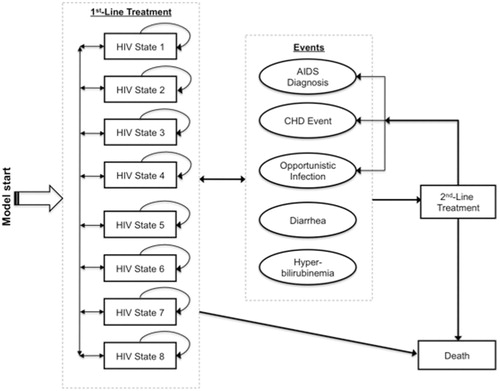
A hypothetical, million-member cohort of HIV-1-infected, cART-naïve adults entered the model receiving first-line treatment and moved among eight HIV-specific health states defined by CD4 count (>350 cells/mL; 201–350; 50–200; and <50) and HIV RNA levels (viral load of <50 or ≥50 copies/mL; ). CD4 count worsened with every two states, in each of which viral load could be either high or low, such that disease progression was unidirectional towards worse only in terms of CD4 counts. The four worst states represented the Centers for Disease Control and Prevention’s definition of AIDS, in which CD4 counts are ≤200 cells/mL and viral load is at any level.
Table 1. HIV states in microsimulation model of LPV/r and ATV + r for management of antiretroviral-naïve HIV-1-infected patients: definitions and transition probabilities*.
Patients progressed through health states at 3-month cycles to reflect the US Department of Health and Human Services’ recommended intervals for HIV RNA and CD4 testingCitation1, and at each cycle they faced risks of an AIDS diagnosis, OI, diarrhea, and hyperbilirubinemia – events for which rates were different between CASTLE treatment arms – and death. Patients switched to second-line treatment if they experienced: (1) virologic failure, defined as two consecutive Markov cycles in a health state with RNA ≥ 50 copies/mL after 24 weeks of treatment; or (2) severe levels of diarrhea (in the LPV/r arm) or hyperbilirubinemia (in the ATV + r arm), either of which might lead to treatment discontinuation. Individuals could transition between any state while receiving first-line treatment and did not return to first-line once they progressed to second-line.
First-line treatment (ATV + r vs. LPV/r) was modeled at the individual patient level, where patients’ histories of CD4 counts and RNA levels, adverse effects, CHD events, and OIs were incorporated in subsequent risk calculations. Second-line treatment was modeled at the cohort level, employing a deterministic methodology whereby all patients who switched to second-line therapy, regardless of history or treatment arm, were assumed to be treated with a ‘market basket’ second-line treatment (comprised of 40% abacavir/lamivudine + darunavir + ritonavir and 60% efavirenz/emtricitabine/tenofovir) and to face the same subsequent event risks. Included in the model were those adverse events that occurred at different rates between CASTLE treatment arms (diarrhea and hyperbilirubinemia), and death was modeled to occur from either any cause, HIV infection, or a fatal CHD event. All models were built and analyzed in TreeAge Pro Suite 2009 (TreeAge Software Inc., Williamstown, MA, USA), and all costs and quality-adjusted life-years (QALYs) were discounted at an annual rate of 3% starting at the first quarterly cycleCitation6.
Model inputs
Baseline data for the CASTLE trial population provided the model’s baseline population distributions of age and gender as well as mean diabetes mellitus (DM) rates (1.8%), CHD rates (0.7%), CD4 counts (214 cells/mL), and RNA levels (181,484 copies/mL) ()Citation3–5. Health state transition probabilities, cholesterol changes, and adverse effect frequencies were also derived from published results of the 96-week CASTLE trialCitation3–5, and rates of OIs, treatment adherence, and mortality were estimated based on the published literatureCitation2,Citation9,Citation10–12.
Table 2. Model input parameter estimates and data sources for microsimulation of LPV/r and ATV + r for management of antiretroviral-naïve HIV-1-infected patients.
Effects of cART on HIV state
To calculate patients’ probabilities of transitioning between HIV-specific states of varying CD4 counts and RNA levels (), LPV/r transition probabilities were first estimated from those observed among patients in the LPV/r arm of the CASTLE trial. Specifically, patient-level CASTLE trial data was used to calculate in an as-treated analysis the HIV state transitions at 3-month intervals among all CASTLE patients. These results were used to estimate the model’s baseline virologic suppression, which was applied in the model as the LPV/r treatment effect. ATV + r transitions were then calculated based on CASTLE results indicating that significantly fewer patients in the ATV + r treatment arm had RNA levels ≥50 copies/mL than did those in the LPV/r arm at the end of 96 weeks (26% and 32%, respectively; p < 0.05 for 6% difference). By using the 96-week cumulative effect, this estimate accounts for the differences in virologic suppression between the first and second 48 weeks of treatment that was found in ATV + r patients. ATV + r transition probabilities were thus calculated to reflect this difference, such that patients receiving ATV + r were 19% (1 – 26%/32%) less likely than those receiving LPV/r at each 3-month interval to transition to a state with higher viral load. To validate this assumption, a test simulation using these transition probabilities was conducted, and this simulation showed that there were 6% fewer patients with RNA ≥ 50 copies/mL in the ATV + r arm at 96 weeks than in the LPV/r arm.
It was assumed in the model that cART adherence would vary by regimen based on evidence from nontrial settings that estimated cART-specific adherence at 71% for LPV/rCitation10 and 82% for ATV + rCitation12. Nonadherent patients were assumed to be 10% more likely than their adherent counterparts to experience virologic failure, which in turn would lead to increases in viral load, OIs, and changes in therapyCitation13,Citation14.
Event rates
Baseline risks of CHD events were estimated as the pooled risks of myocardial infarction, angina, and stroke among HIV-infected populations and stratified by pre-existing DM and CHD statusCitation7. This risk varied by HIV state depending on total cholesterol (TC) and high-density lipoprotein (HDL) lipid levels. This was based on recent evidence from the Data Collection on Adverse Events of Anti-HIV Drugs Study (D:A:D Study) indicating that among HIV-infected patients each unit decrease in TC:HDL ratio predicted a significant (14%) reduction in CHD risk, whereas low-density lipoprotein and triglyceride levels were not significant predictorsCitation15.
CASTLE study data were applied to adjust CHD risk by cART treatment, assuming reductions in TC:HDL ratio between baseline to 96 weeks of 0.17 units among patients receiving LPV/r and 0.40 units among those receiving ATV + r. TC:HDL ratio (and thus the risk of a CHD event) reverted to baseline when patients advanced beyond first-line and went on to second-line therapy, and weighted mortality and incidence rates of myocardial infarction, stroke, and angina were used to estimate that 35% of CHD events would be fatalCitation8. Individuals who experienced nonfatal CHD events were subsequently classified as having prior CHD and thus faced increased risks of future events.
Estimated cART-specific rates of moderate and severe diarrhea and hyperbilirubinemia were based on CASTLE trial results. Diarrhea onset was assumed to occur only during the first 96 weeks of treatment and to be higher during weeks 1–48 than weeks 49–96, and hyperbilirubinemia onset was assumed to occur only during the first 12 weeks of treatment. After onset, patients would continue to experience the condition(s) until discontinuation of treatment (e.g., advancement beyond first-line therapy). Depending on HIV state, patients experienced between 1.7 and 17.9 OIs during each 3-month cycle (), which was estimated based on data from published literatureCitation9. US census data from 2005 was used to estimate age- and gender-specific all-cause mortality, which was increased by 6.1/1000 patient-years to account for HIV-specific risk of deathCitation2,Citation11.
Health-related quality of life
Changes in health-related quality of life associated with each cART regimen were based on utility decrements for HIV states, diarrhea, hyperbilirubinemia, and CHD (). State-specific HIV utility weights were based on those used in a previously published model in which utilities were estimated from patient responses to the EuroQol-5 Dimensions quality-of-life instrument; utilities for states that were defined more broadly here than in the reference model were calculated as averages of multiple statesCitation9. Quality of life worsened with disease progressionCitation9 and with treatment progression beyond first-line therapy, such that patients in second-line treatment were assigned a utility weight of 0.781, equal to that of the two worst HIV states. Utilities associated with these events were estimated based on those for irritable bowel syndrome (IBS) on the assumption that this condition’s GI effects are of similar magnitude to those among patients taking PIs. The lowest (i.e., worst) utility reported among IBS patients was applied in the model for severe diarrhea, and a slightly higher utility reported among IBS patients was applied for mild/moderate diarrheaCitation17–19.
Table 3. Net quality-adjusted life-years lost and costs incurred associated with HIV infection, diarrhea, hyperbilirubinemia, coronary heart disease, and opportunistic infections.
Because of the lack of evidence on the quality of life decrements associated with hyperbilirubinemia as well as evidence suggesting that hyperbilirubinemia is not associated with severe health effectsCitation22,Citation23, expert input from an infectious disease clinical specialist was used to assume that a mild case of this condition would result in a 0.01 utility decrement and continuation of treatment and that a severe case would lead to a 0.05 utility decrement and discontinuation of treatment (). When individuals experienced nonfatal CHD events, they were assigned a one-time cost and a quality of life decrement that incorporated the subsequent lifelong changes in these outcomes after such events. For patients with multiple conditions, the lowest utility weight was usedCitation25–27.
Cost estimates
shows all cost estimates used in the model. Direct medical costs of treatment with each cART regimen were estimated based on drug costs, treatment adherence, physician visits, and laboratory tests, all of which varied with HIV state and with occurrence of diarrhea, CHD events, and OIs. Costs of LPV/r and ATV + r regimens were based on launch-date wholesale list price (adjusted to 2008 US dollars) and reduced by 20% for nonadherent patients, who were assumed not to receive all medication because such patients tend to delay refill (which thereby lowers costs). The cost and frequency of physician visits and laboratory tests were based on HIV-specific data from published sourcesCitation1,Citation20 and incorporated estimates of visit duration from a clinical infectious disease specialist.
The cost of each CHD event was based on results from a study of the cost-utility of primary prevention of CHDCitation16, and the costs per diarrhea episode were based on the cost of a course of antidiarrheal agentsCitation21. The costs associated with hyperbilirubinemia were based on recent evidence indicating that the incidence of grade III or IV hyperbilirubinemia is not associated with higher risk of severe hepatotoxicity or with regimen discontinuationCitation22,Citation23; with input from a clinical infectious disease specialist, it was therefore assumed that no additional treatments or costs would be associated with this diagnosis. Cost per OI was estimated as a weighted average of all OIs, based on the distribution of OI rates from the Multicenter AIDS Cohort Study (MACS) data (Release P17) and OI costs from a previous cost-effectiveness analysisCitation24. All costs were adjusted to 2008 US dollars using the all-item consumer price indexCitation28.
Analysis
A Markov microsimulation model was conducted for a hypothetical cohort of 1,000,000 HIV-1-infected cART-naïve patients, each of whom was simulated separately through the LPV/r and ATV + r model scenarios. All outcomes were evaluated over 1-, 2-, 5-, 10-, 20-year, and lifetime periods, and incremental cost-effectiveness ratios (ICERs) were calculated as the ratios of lifetime incremental costs and incremental QALYs associated with ATV + r compared with LPV/r treatments.
To test the potential impact of uncertainty in model parameter estimates, nine alternative scenarios were evaluated with one-way sensitivity analyses to separately vary each of the following parameters: effect of ATV + r treatment on viral load; effects of LPV/r and ATV + r treatments on TC:HDL ratios; adherence with LPV/r and ATV + r; and utility weights for CHD events, moderate and severe diarrhea, and severe hyperbilirubinemia. A probabilistic sensitivity analysis was also conducted to evaluate the impact of simultaneously varying all such parameters as well as the following: event rates for fatal CHD, OI, diarrhea, and hyperbilirubinemia; nonadherence rates; the effects of nonadherence on HIV transitions and costs; utility weights for HIV states; nondrug medical costs by HIV state; and CHD and OI costs.
Probabilistic sensitivity analyses apply distributions to ranges of each varied parameter and sample at random from these distributions, thereby simulating uncertainty and generating an empirical distribution of the cost-effectiveness ratio. Parameter distributions and ranges for this model (see and ) were chosen based on the original data source as well as on assumptions that considered parameter type and the inclusion of a broad range of values. Because of its usefulness in skewed data, the gamma distribution was applied to cost variables, for which the alpha and beta parameters were chosen such that the mean equaled the base value and the 95% confidence interval covered 50–200% of the base-case value. The beta distribution, useful for probabilities estimated from a proportion, was used for diarrhea and hyperbilirubinemia rates and was estimated based on numbers of events (for the alpha parameter) and nonevents (beta) in the CASTLE trial.
For utility weights, uniform distributions were used with mean values equal to the model’s base-case estimates and maximum values of one. Uniform distributions with means equal to the base-case estimate were used for the effects of treatment and adherence on viral load, the probability of fatal CHD, and OI rates, with ranges of ±10% for all but OI rates, which used ± half of the base-case estimate. Normal distributions with means equal to the base case were applied to the effects of treatment on TC:HDL ratio (ranges to cover up to 10-fold change from base case) and to the probability of nonadherence (range ± difference between upper bound of 1 and the greater of ATV + r and LPV/r base-case estimates).
Within these distributions and ranges, the ordinal nature of particular estimates was maintained such that certain parameter values would – because of the nature of the condition – have to remain higher/lower than others. For example, it was assumed that the utility weight associated with mild/moderate diarrhea would always be higher (e.g., better) than that of severe diarrhea; HIV states with higher CD4 counts and lower viral loads would always be associated with higher utility weights, lower costs, and lower OI rates than HIV states with lower CD4 counts and higher viral loads. Probabilistic sensitivity analyses were conducted with 125 model simulations of 100,000 individual trials, in which the parameter estimates were randomly drawn based on the above distributions.
Results
presents base-case results comparing first-line treatment with ATV + r versus with LPV/r among HIV-1-infected, cART-naïve adults in the US. Over a lifetime, patients initiating ATV + r were predicted to receive 26.6 more months (97.3 vs. 70.7) of first-line therapy than those initiating LPV/r, to have 19.08 AIDS cases per 1000 patient-years compared with 20.05 for LPV/r, and to experience fewer adverse events for four of the five outcomes studied. Comparing patients receiving ATV + r with those receiving LPV/r, the model projected that, per 1000 patient-years, there would be 0.44 vs. 0.52 OIs, 1.27 vs. 6.26 diarrhea occurrences, and 5.44 vs. 5.51 CHD events. ATV + r treatment would result in higher hyperbilirubinemia rates (6.99 vs. 0.25 per 1000 patient-years), higher costs ($275,986 vs. 269,160), and higher absolute (18.52 vs. 18.51 life-years) and quality-adjusted survival (11.02 vs. 10.76 QALYs) compared with LPV/r use over a lifetime. Overall, ATV + r added 0.26 QALYs at a cost of $6826, producing an ICER of $26,421 per QALY gained.
Table 4. Projected health-related, cost, and quality-adjusted life-year outcomes associated with LPV/r compared with ATV + r treatment for antiretroviral therapy--naïve HIV-infected patients: base-case results.
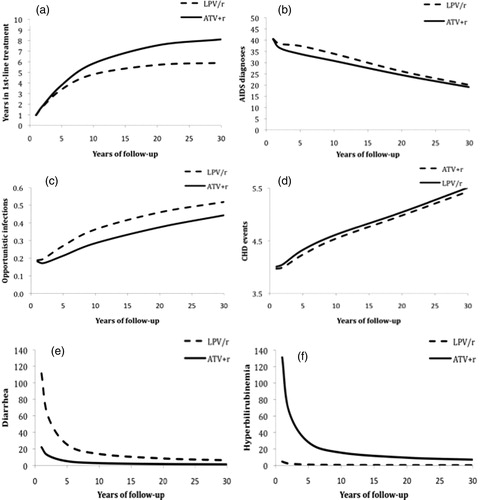
shows that the same health outcomes were predicted to similarly favor ATV + r except in the case of hyperbilirubinemia, at 1, 5, 10, 15, 20, and 30+ years of patient follow-up, but with differing patterns over time. The benefits associated with longer time spent receiving first-line treatment and of fewer OIs and CHD events associated with ATV + r treatment increased over time, whereas benefits of fewer AIDS diagnoses and diarrhea episodes and risks of more hyperbilirubinemia episodes associated with ATV + r decreased over time. For example, at 1 year of follow-up the rates of hyperbilirubinemia among ATV + r patients were 126/1000 patient-years greater than those among LPV/r patients, but this difference diminished to 27/1000 patient-years at 5 years and to less than 7/1000 patient-years over a lifetime.
Figure 2. Predicted years spent in first-line treatment (panel a) and incidence (per 1000 person-years) of AIDS diagnoses (panel b), opportunistic infections (panel c), CHD events (panel d), diarrhea (panel e), and hyperbilirubinemia (panel f), by treatment type and year of follow-up.
The results of the one-way sensitivity analyses for evaluating alternative scenarios indicated that, overall, the ICER would exceed $50,000/QALY only when the differential effect of ATV + r on viral load was dramatically less than that seen in CASTLE; for all other alternative scenarios considered, the ICER never exceeded $35,000/QALY (). When the differential effect of ATV + r on viral load was estimated to be smaller (9% instead of 19%), the ICER more than doubled over the base case, at $58,444 (vs. $26,421), and it decreased to less than half of the base case ($13,000/QALY) when this relative effect was increased to 29%. Associated costs and QALYs for each arm also varied with different estimated TC:HDL ratios and with adherence rates, although only high TC:HDL ratios for ATV + r and high LPV/r adherence rates resulted in ICERs above $30,000/QALY ($34,277 and $30,373, respectively).
Figure 3. Results of one-way (panel a) and probabilistic (panel b) sensitivity analyses: incremental cost-effectiveness ratios (ICERs) of ATV + r compared with LPV/r with varying estimates of model input parameter values. Tornado diagram results (panel a) are displayed in order of each parameter’s magnitude of effect on the ICER, and lower, base case, and upper values used for each one-way sensitivity analysis are shown. In panel b, each of the 125 points represents one microsimulation analysis of 100,000 individual-level trials; 95% confidence ellipse is shown.
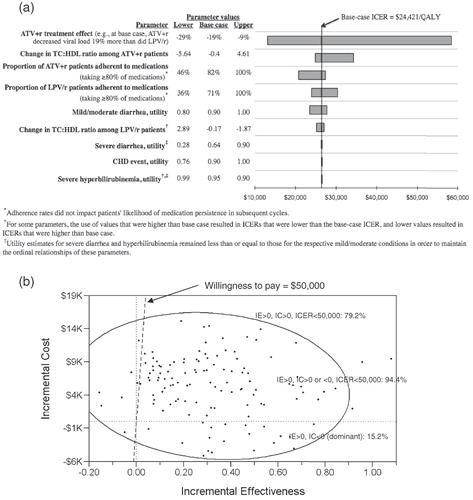
For example, when the effect of LPV/r treatment on TC:HDL ratio was varied, the range of ICER values was $1800/QALY with a maximum of $27,000/QALY. Yet, ICER results were more sensitive to the effect of ATV + r on TC:HDL, for which there was a $9400/QALY range and a $34,000/QALY maximum. Perfect adherence to LPV/r increased the ICER to $30,000/QALY, and perfect adherence to ATV + r increased the ICER to $27,000/QALY, whereas reducing adherence to LPV/r decreased the ICER to $24,000/QALY, and reducing ATV + r adherence by the same absolute percentage brought the ICER to $21,000/QALY. Results were even less sensitive to varying utilities for mild/moderate diarrhea, with lower estimates causing the ICER to decrease by $3000 and higher estimates causing it to increase by $1300; however, results were not sensitive to varying estimated utility associated with severe diarrhea or severe hyperbilirubinemia.
shows the results of the probabilistic sensitivity analysis in which all 47 model parameters were simultaneously varied to estimate 125 ICERs – represented by the points in the figure – under such varying assumptions. These results indicate that ATV + r was predicted to be cost-saving 15% of the time, as indicated by the ICER points in the lower-right-hand quadrant of the plot, where the health benefits of ATV + r use were positive and the costs were negative. Instances in which these benefits were positive, costs were positive or negative, and the ICER was less than $50,000/QALY are indicated by the points to the right of the $50,000 threshold line; these results suggest that ATV + r was predicted to be cost effective at a $50,000/QALY societal willingness-to-pay 94% of the time.
Discussion
This model predicted that patients starting an ATV + r-based regimen compared with an LPV/r-based regimen would, over a lifetime, continue to receive first-line treatment for 2 years longer; experience fewer AIDS diagnoses, OIs, CHD events, and diarrhea episodes; and experience more episodes of hyperbilirubinemia. Their quality-adjusted survival would also be greater than that of LPV/r patients, and overall survival would be the same. Specifically, quality-adjusted life expectancy among patients initiating an ATV + r-based regimen would be 0.26 QALYs greater than it would be among those starting an LPV/r-based regimen, and lifetime costs would be $6,826 greater. When compared with LPV/r, ATV + r was thus predicted to have an ICER of $26,426/QALY, which is well within the $50,000/QALY willingness-to-pay threshold for healthcare interventions commonly used in the USCitation29,Citation30.
In cART-naïve HIV-infected patients, first-line treatment with ATV + r results in more prolonged viral suppression than with LPV/r at a slightly higher cost, and the results indicate that these additional costs are worthwhile. Specifically, patients in the model who had greater viral suppression ultimately spent less time taking later-line treatments; had fewer AIDS, OI, CHD, and diarrhea events; and had less drug resistance.
These results suggest these benefits come at a societal cost that is acceptable by current US standardsCitation31–35. This conclusion differs from that of previous analyses that predicted ATV + r to be less cost effective than LPV/rCitation36,Citation37. This analysis used more-recent and longer-term 96-week CASTLE results indicating that ATV + r was 19% more effective at suppressing viral replication than LPV/rCitation3. Because the shorter-term data used by Simpson and colleagues suggested that ATV + r treatment was associated with lower viral suppression than was LPV/r, their model predicted far lower survival and greater costs for ATV + r than did this modelCitation36–39. In addition, when the ATV + r treatment effect was as low as 9% in sensitivity analyses (compared with 19% in the base case) over 96 weeks, the ICER for ATV + r was $58,000, a value that is well within the frequently cited $50,000–100,000/QALY threshold for cost effectiveness and the range seen in other commonly used clinical treatmentsCitation31–35.
A primary benefit of ATV + r is its favorable adverse effect profile compared with other PIs, a drug class typically associated with diarrhea that may be severe enough to reduce patients’ regimen compliance and therefore regimen effectiveness. To reflect this benefit, this model incorporated the differing impacts of treatment-related diarrhea and hyperbilirubinemia, which commonly occurs during the first 2–12 weeks of treatment among patients receiving ATV + rCitation23. This analysis thus estimated quality-adjusted life expectancy based on not only viral load and CD4 count but also on diarrhea, hyperbilirubinemia, and CHD outcomes. Although the quality-of-life decrement associated with diarrhea was assumed in the model to range from 0.10 to 0.36 utils, depending on severity, that of hyperbilirubinemia (which is not usually clinically relevant)Citation23 was far less at only 0.001–0.050 utils (). In addition, because diarrhea is more likely to occur among patients taking LPV/r and hyperbilirubinemia is more likely among those taking ATV + r, the average quality-of-life decrement associated with these outcomes among patients receiving LPV/r would therefore be 5 times greater than that among patients receiving ATV + r.
With reduced quantity and severity of gastrointestinal and CHD outcomes, ATV + r was thus assumed to have greater treatment adherence even with the hyperbilirubinemia adverse effect. Because greater adherence in the model led to greater virologic suppression, longer time in first-line therapy, and fewer AIDS diagnoses and OIs, and because reduced CHD events were associated with longer survival, patients who were receiving ATV + r were predicted to have slightly longer (by 1 day) overall survival than were those who were receiving LPV/r. With both greater survival and greater quality-of-life, quality-adjusted life expectancy among patients receiving ATV + r was predicted to be 0.26 QALYs higher than that among LPV/r patients, resulting in overall cost effectiveness of ATV + r when compared with LPV/r.
The results of this analysis must be considered in light of its limitations. Although the treatment effect for LPV/r was based on an as-treated analysis of CASTLE data, that of the ATV + r arm was estimated from CASTLE trial results showing a 6% difference in 96-week rates of virologic failure. The ATV + r treatment effect was therefore based on an intention-to-treat analysis and may thus overestimate the number of patients going to second-line treatment because the estimate includes both severe events as well as treatment failure. However, because such an overestimation would occur only in the ATV + r arm, the model results would be biased towards LPV/r and therefore provide a conservative estimate of ATV + r cost effectiveness.
This analysis used treatment-specific changes in TC:HDL ratios to predict CHD event risk, yet it is possible that other methods could be just as valid or produce different results. However, even when using extreme TC:HDL ratios that favored LPV/r, the ICER still did not exceed $35,000, so even if CHD risk were modeled differently the overall conclusion of ATV + r being cost effective relative to LPV/r would be unlikely to change. In addition, because of limitations in data, model estimates of quality-of life decrements associated with diarrhea were based on those for individuals with IBS and could either underestimate or overestimate the decrements for HIV-infected populations. It may initially appear counterintuitive that the utility weight for severe diarrhea (0.641) is lower than that for CHD (0.88 acute; 0.90 ongoing), but because utility weights measure health-related quality of life and not mortality, these estimates are likely to represent the impact of these conditions on domains such as energy, role functioning, bodily pain, and general health perceptions. These estimates were further tested in a sensitivity analysis that considered severe-impact CHD and mild-impact diarrhea, using weights of 0.08 for acute and ongoing CHD and 0.95 for moderate and severe diarrhea. Even when using such extreme estimates, the ICER was still low at $31,638/QALY.
Because of the similar lack of data, quality-of-life decrements associated with hyperbilirubinemia were estimated based on evidence that it is not associated with severe health effectsCitation22,Citation23; hyperbilirubinemia was thus assumed to have a minimal impact of 0.01–0.05 QALYs over a lifetime. Although this could have caused model results to underestimate the effect of hyperbilirubinemia and thus the ATV + r ICER, sensitivity analyses showed that results and conclusions did not change with variations in this utility estimate.
Finally, the same QALY weight estimate (0.781) was used in this model for patients who advanced to second-line treatment because of severe diarrhea or hyperbilirubinemia and for those who advanced because of virologic failure. Although not all patients experiencing severe events would necessarily have advancing disease nor have such low quality of life, this estimate was used as a simplifying assumption because only a small proportion of patients entering second-line would do so due to severe events rather than due to virologic failure, with the risk of severe adverse events being less than 0.23% (varying by time on regimen and ongoing until 96 weeks) for LPV/r and 0.68% (during the first 3 months of treatment only) for ATV + r. Thus, making this assumption may have caused the model to slightly underestimate lifetime QALYs and bias results against LPV/r. To test the degree of this potential bias, the model was run using the median of all eight HIV states’ QALY weights (0.897) as the QALY weight for second-line treatment among patients who advanced because of severe events. The resulting ICER increased slightly from the base case of $26,421–27,319 in this sensitivity analysis; therefore, the use of this simplifying assumption had only a minimal impact that does not change the model’s conclusions of ATV + r’s cost effectiveness.
Conclusion
By reducing viral load with less gastrointestinal toxicity and a better lipid profile, ATV + r was predicted in this model to lower rates of AIDS and CHD events and increase quality-adjusted survival compared with LPV/r. Using the standard US cost-effectiveness threshold of $50,000 per QALY, ATV + r is cost effective compared with LPV/r in cART-naïve HIV-infected patients. In this era of ever-increasing healthcare costs, this knowledge will be useful to physicians, policymakers, and payers alike in their efforts at making clinically appropriate yet cost-conscious decisions.
Transparency
Declaration of funding
Funding for this study was provided by Bristol-Myers Squibb.
Declaration of financial/other relationships
T.J. and J.U. are employed by Bristol-Myers Squibb. M.S.B., E.Y.C., and T.G.K.B. are employed by PHAR, LLC, a company that received support from Bristol-Myers Squibb to assist with the study design and analysis and the manuscript preparation.
Related Research Data
References
- Panel on Antiretroviral Guidelines for Adults and Adolescents. Guidelines for the use of antiretroviral agents in HIV-1-infected adults and adolescents. Department of Health and Human Services. December 1, 2009;1-146. Available at: http://www.aidsinfo.nih.gov/ContentFiles/AdultandAdolescentGL.pdf [Last accessed 14 April 2010]
- Bhaskaran K, Hamouda O, Sannes M, et al. Changes in the risk of death after HIV seroconversion compared with mortality in the general population. JAMA 2008;300:51-59
- Molina JM, Andrade-Villanueva J, Echevarria J, et al. Efficacy and safety of boosted once-daily atazanavir and twice-daily lopinavir regimens in treatment-naïve HIV-1 infected subjects. CASTLE: 48-week results. Presented at the 15th Conference on Retroviruses and Opportunistic Infections (poster #37), Boston, 2008. Available at: http://img.thebody.com/confs/retro2008/slides/37%20Molina%20CASTLE%20Presentation.pdf. [Last accessed 2 December 2009]
- Molina JM, Andrade-Villanueva J, Echevarria J, et al. Once-daily atazanavir/ritonavir versus twice-daily lopinavir/ritonavir, each in combination with tenofovir and emtricitabine, for management of antiretroviral-naive HIV-1-infected patients: 48 week efficacy and safety results of the CASTLE study. Lancet 2008;372:646-655
- Molina J-M, Andrade-Villanueva J, Echevarria J, et al. Once-daily atazanavir/ritonavir compared with twice daily lopinavir/ritonavir, each in combination with tenofovir and emtricitabine, for management of antiretroviral-naive HIV-1-infected patients: 96-week efficacy and safety results of the CASTLE Study. J Acquir Immune Defic Syndr 2010;53:323-332
- Siegel JE, Torrance GW, Russell LB, et al. Guidelines for pharmacoeconomic studies. Recommendations from the panel on cost effectiveness in health and medicine. Panel on Cost Effectiveness in Health and Medicine. Pharmacoeconomics 1997;11:159-168
- Worm SW, De Wit S, Weber R, et al. Diabetes mellitus, preexisting coronary heart disease, and the risk of subsequent coronary heart disease events in patients infected with human immunodeficiency virus: the Data Collection on Adverse Events of Anti-HIV Drugs (D:A:D Study). Circulation 2009;119:805-811
- American Heart Association. Heart Disease and Stroke Statistics – 2009 Update. Dallas, Texas: American Heart Association; 2009
- Simpson KN, Luo MP, Chumney E, et al. Cost-effectiveness of lopinavir/ritonavir versus nelfinavir as the first-line highly active antiretroviral therapy regimen for HIV infection. HIV Clin Trials 2004;5:294-304
- Golin CE, Liu H, Hays RD, et al. A prospective study of predictors of adherence to combination antiretroviral medication. J Gen Intern Med 2002;17:756-765
- National Vital Statistics Report Volume 56, Number 10. Deaths: Final data for 2005. Available at: http://www.cdc.gov/nchs/data/nvsr/nvsr56/nvsr56_10.pdf. [Last accessed 8 December 2009]
- Molina JM, Podsadecki TJ, Johnson MA, et al. A lopinavir/ritonavir-based once-daily regimen results in better compliance and is non-inferior to a twice-daily regimen through 96 weeks. AIDS Res Hum Retroviruses 2007;23:1505-1514
- Paterson DL, Swindells S, Mohr J, et al. Adherence to protease inhibitor therapy and outcomes in patients with HIV infection. Ann Intern Med 2000;133:21-30
- Bangsberg DR, Perry S, Charlebois ED, et al. Non-adherence to highly active antiretroviral therapy predicts progression to AIDS. AIDS 2001;15:1181-1183
- Friis-Møller N, Thiébaut R, Reiss P, et al. Predicting the risk of coronary heart disease (CHD) in HIV-infected patients: the D:A:D CHD Risk Equation. Paper presented at: 14th Conference on Retroviruses and Opportunistic Infections; February 25-28, 2007; Los Angeles, California
- Pignone M, Earnshaw S, Tice JA, et al. Aspirin, statins, or both drugs for the primary prevention of coronary heart disease events in men: a cost-utility analysis. Ann Intern Med 2006;144:326-336
- Gralnek IM, Hays RD, Kilbourne A, et al. The impact of irritable bowel syndrome on health-related quality of life. Gastroenterology 2000;119:654-660
- Whitehead WE, Burnett CK, Cook EW 3rd, et al. Impact of irritable bowel syndrome on quality of life. Dig Dis Sci 1996;41:2248-2253
- Creed F, Ratcliffe J, Fernandez L, et al. Health-related quality of life and health care costs in severe, refractory irritable bowel syndrome. Ann Intern Med 2001;134:860-868
- Ingenix National Fee Analyzer 2008
- PriceRx Wolters Kluwer Health 2009
- Johnson M, Grinsztejn B, Rodriguez C, et al. 96-week comparison of once-daily atazanavir/ritonavir and twice-daily lopinavir/ritonavir in patients with multiple virologic failures. AIDS 2006;20:711-718
- Torti C, Lapadula G, Antinori A, et al. Hyperbilirubinemia during atazanavir treatment in 2,404 patients in the Italian Atazanavir Expanded Access Program and MASTER Cohorts. Infection 2009;37:244-249
- Schackman BR, Gebo KA, Walensky RP, et al. The lifetime cost of current human immunodeficiency virus care in the United States. Med Care 2006;44:990-997
- Drummond MF, Sculpher MJ, Torrance GW, et al. Methods for the Economic Evaluation of Health Care Programmes, 3rd edn. New York, NY: Oxford University Press, 2005
- Dale W, Basu A, Elstein A, et al. Predicting utility ratings for joint health states from single health states in prostate cancer: empirical testing of 3 alternative theories. Med Decis Making 2008;28:102-112
- Fu AZ, Kattan MW. Utilities should not be multiplied: evidence from preference-based scores in the United States. Med Care 2008;46:984-990
- Bureau of Labor Statistics, U.S. Department of Labor. CPI Detailed Report: Data for May 2009. Crawford M, Katz S, eds. www.bls.gov/cpi/cpid0905.pdf. Accessed June 30, 2009
- Ubel PA, Hirth RA, Chernew ME, et al. What is the price of life and why doesn’t it increase at the rate of inflation? Arch Intern Med 2003;163:1637-1641
- King JT, Tsevat J, Lave JR, et al. Willingness to pay for a quality-adjusted life year: implications for societal health care resource allocation. Med Decis Making 2005;25:667-677
- Eichler HG, Kong SX, Gerth WC, et al. Use of cost-effectiveness analysis in health-care resource allocation decision-making: how are cost-effectiveness thresholds expected to emerge? Value Health 2004;7:518-528
- Grosse SD, Teutsch SM, Haddix AC. Lessons from cost-effectiveness research for United States public health policy. Annu Rev Public Health 2007;28:365-391
- King JT Jr, Tsevat J, Lave JR, et al. Willingness to pay for a quality-adjusted life year: implications for societal health care resource allocation. Med Decis Making 2005;25:667-677
- Ubel PA, Hirth RA, Chernew ME, et al. What is the price of life and why doesn't it increase at the rate of inflation? Arch Intern Med 2003;163:1637-1641
- Weinstein MC, Skinner JA. Comparative effectiveness and health care spending–implications for reform. N Engl J Med 2010;362:460-5. Epub 2010 Jan 6
- Simpson KN, Rajagopalan R, Dietz B. Cost-effectiveness analysis of lopinavir/ritonavir and atazanavir + ritonavir regimens in the CASTLE study. Adv Ther 2009;26:185-193
- Simpson KN, Luo MP, Chumney EC, et al. Cost effectiveness of lopinavir/ritonavir compared with atazanavir in antiretroviral-naive patients: modelling the combined effects of HIV and heart disease. Clin Drug Invest 2007;27:67-74
- Mocroft A, Ruiz L, Reiss P, et al. Virological rebound after suppression on highly active antiretroviral therapy. AIDS 2003;17:1741-1751
- Johnson M, Grinsztejn B, Rodriguez C, et al. Atazanavir plus ritonavir or saquinavir, and lopinavir/ritonavir in patients experiencing multiple virological failures. AIDS 2005;19:685-694