Abstract
Objectives:
To investigate how the cost effectiveness of preventing HIV/AIDS varies across possible efficiency frontiers (EFs) by taking into account potentially relevant external factors, such as prevention stage, and how the EFs can be characterized using regression analysis given uncertainty of the QALY-cost estimates.
Methods:
We reviewed cost-effectiveness estimates for the prevention and treatment of HIV/AIDS published from 2002–2007 and catalogued in the Tufts Medical Center Cost-Effectiveness Analysis (CEA) Registry. We constructed efficiency frontier (EF) curves by plotting QALYs against costs, using methods used by the Institute for Quality and Efficiency in Health Care (IQWiG) in Germany. We stratified the QALY-cost ratios by prevention stage, country of study, and payer perspective, and estimated EF equations using log and square-root models.
Results:
A total of 53 QALY-cost ratios were identified for HIV/AIDS in the Tufts CEA Registry. Plotted ratios stratified by prevention stage were visually grouped into a cluster consisting of primary/secondary prevention measures and a cluster consisting of tertiary measures. Correlation coefficients for each cluster were statistically significant. For each cluster, we derived two EF equations – one based on the log model, and one based on the square-root model.
Discussion:
Our findings indicate that stratification of HIV/AIDS interventions by prevention stage can yield distinct EFs, and that the correlation and regression analyses are useful for parametrically characterizing EF equations. Our study has certain limitations, such as the small number of included articles and the potential for study populations to be non-representative of countries of interest. Nonetheless, our approach could help develop a deeper appreciation of cost effectiveness beyond the deterministic approach developed by IQWiG.
Introduction
The HIV pandemic remains one of the world’s most serious infectious disease threatsCitation1. Approximately 33 million people worldwide lived with HIV in 2007Citation2. Each day, more than 6800 persons become infected with HIV and over 5700 persons die from AIDS, mostly because of inadequate access to HIV prevention and treatment servicesCitation1. While antiretroviral therapy (ART) can help to control the disease, the role of preventive interventions to change behavior is widely recognizedCitation3,Citation4. Importantly, the majority of people living with HIV remain unaware of their disease, making it more likely that they will unintentionally contribute to its spreadCitation5. Hence, it is clear that education, screening and treatment are all vital. Because medical resources are limited, however, it is important to consider how to allocate them so as to maximize the resulting health benefits. In this context, defining the ‘value’ of health technology has become a key issue. A standard measure of value for health technologies is cost effectiveness, defined to be the cost incurred by a technology divided by its health benefit. For HIV/AIDS interventions, cost-effectiveness ratios vary greatly. For example, one intervention to prevent mother-to-child HIV transmission costs only $5 more for each person treated and saves 0.0165 additional quality-adjusted life-years (QALYs), corresponding to an incremental cost-effectiveness ratio (ICER) of $317 per QALYCitation6. In contrast, a particular ART intervention costs nearly $130,000 more per person treated and saves 5.01 QALYs, yielding an ICER of $25,600 per QALYCitation7.
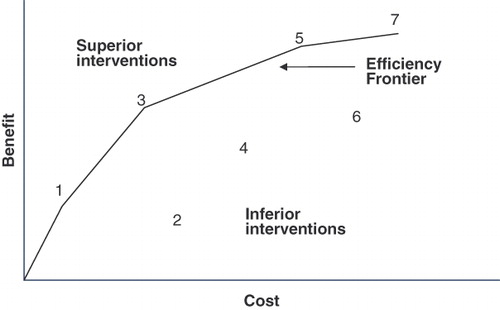
In the example just described, it is clear that the measure preventing transmission of HIV from mother to child delivers health benefits far less expensively than ART. The question is: does the ART deliver enough of a benefit to justify its cost? ‘Efficiency frontier’ (EF) analysis is one approach proposed to address this question. In 2008, Germany’s Institute for Quality and Efficiency in Health Care (IQWiG) became the first government agency to adopt officially the EF methodCitation8. EF analysis plots the available technologies in a plane, with health benefits on the vertical axis and costs on the horizontal axis. If one technology lies to the northwest of another in this plane, it is more favorable because it achieves greater benefits and incurs smaller costs. As illustrated in , the efficiency frontier is formed by connecting all technologies that do not lie to the southeast of any other technology.
Figure 1. Formation of Efficiency Frontier.
As IQWiG explains in its guidelines, ‘An efficiency frontier should be constructed for each therapeutic area as the basis for economic evaluation of relevant health technologies.’ This statement implies the potential existence of multiple EFs, each of which corresponds to a different group of medical interventions stratified by external factors, such as therapeutic areas, treatment conditions, target populations, intervention stage (primary, secondary, etc.), therapeutic sequence (first, second, etc.), or alternatives (mono- or combination therapy). Following up on this possibility, we have investigated whether there are multiple EFs for HIV/AIDS interventions corresponding to intervention characteristics such as prevention stage, and whether they can be used for policy making.
Our study relied on cost-effectiveness estimates catalogued in the Tufts Medical Center Cost-Effectiveness Analysis (CEA) RegistryCitation9, a comprehensive database of healthcare cost-effectiveness analyses. Our study had two objectives: first, to determine if the EFs differ for HIV/AIDS interventions stratified by various characteristics, including prevention stage, analytic perspective, and study country; and second, to demonstrate how regression analysis can be used to estimate the EF for a set of interventions, taking into account uncertainty inherent in the measurement of each intervention’s health benefits and costs.
Methods
Step 1: Identify CE ratios
We identified cost-effectiveness analyses catalogued in the Tufts CEA Registry satisfying the following criteria: (1) the study evaluated an intervention that prevents HIV, screens for and treats individuals with HIV, or treats individuals with previously identified HIV; (2) the study reported the ratio’s numerator (cost) and denominator (QALYs gained) separately for both the intervention and the comparator; (3) the study time horizon was at least 30 years; (4) publication ranged from 2002–2007; and (5) the study appropriately discounted future costs and benefits. For each ratio, we recorded costs and benefits, prevention stage, analytic perspective (societal or healthcare payer), discount rate, study country, and time horizon. Monetary units were standardized to 2008 US dollars using historical exchange rate information and the Consumer Price Index.
Step 2: Develop EFs using graphical procedures
We first created an EF for the entire set of AIDS/HIV interventions using the IQWiG procedure illustrated in . That is, we plotted each intervention in the cost-effectiveness plane (QALYs on the vertical axis, costs on the horizontal axis) and connected those points that do not lie to the southeast of any other points.
As IQWiG has noted, it is likely that the EF will differ for interventions belonging to different categories. We therefore stratified interventions based on characteristics we suspected might influence cost effectiveness and could be relevant to policy makers, and then constructed distinct EF curves using the same graphical approach described above. Stratification categories included:
Prevention stage (primary, secondary, tertiary): The relative cost effectiveness of preventive and curative measures has remained of particular interest to policy makers because of the belief that prevention is highly efficient. It is not clear, however, if preventive measures are generally more cost effective than curative measuresCitation10,Citation11.
Country development stage (developed or developing): The non-industrialized region of Sub-Saharan Africa accounts for 67% of all people living with HIV. Because healthcare costs differ substantially by country, we investigate whether the EF depends on a country’s industrialization stage.
Study perspective (societal or healthcare payer): Because CEA results can depend on the analysis perspective, the EF might depend on the inclusion of indirect costs, such as work loss (societal perspective), or exclusion of these costs (healthcare payer perspective).
Step 3: Develop EFs using regression
The graphical approach used to characterize the EF in has the following limitations. First, the graphical EF interpolates between the points corresponding to interventions 1, 3, 5, and 7, yielding an unnaturally discontinuous slope. Second, this approach uses only some of the data from the literature, making no use in this example of data for interventions 2, 4, and 6. Finally, the graphical approach implicitly assumes that the reported costs and benefits for each intervention are free of error. If, in fact, these results do reflect random error, the inferred EF will be biased to the northwest. That is, the EF will overstate the required efficiency of new technologies that are candidates for coverage.
The perspective we take in this paper is that inefficient interventions are generally eliminated from consideration in the literature; that is, interventions that do not lie on or close to the efficiency frontier receive little attention from researchers because they are effectively known to be sub-optimal. Hence, all interventions described in the literature lie on or close to an implicit EF. Deviations from this implicit frontier – either to the southeast or to the northwest – are a manifestation of uncertainty inherent in measuring therapeutic costs and benefits. If this perspective is valid, the best estimate of the EF for a set of interventions described in the literature lies along the center of the region occupied by these technologies in the cost-effectiveness plane.
We describe here the use of regression analysis to identify the best fitting EF. The resulting continuous EF takes into account all interventions while allowing for the possibility that the reported costs and benefits have been measured with error. Linear regression predicts QALY (dependent variable) as a function of Cost (US$1,000):
If q > 0, Equation (1) implies that effectiveness (measured as QALY) increases monotonically with Cost. Because this model does not capture the expected concave nature of the EF resulting from diminishing marginal returns, we considered two other models. The log model assumes that
while the square root model assumes that
Note that the log model implies a linear relationship between QALY and ln (Cost), whereas the square root model implies a linear relationship between QALYCitation2 and Cost. We therefore assessed goodness of fit for these two models by measuring the Pearson correlation coefficient (r) between QALY and ln (Cost), and between (QALY)Citation2 and Cost for the log model and square root model, respectively.
We analyzed the data using Microsoft Office Excel 2003 and SAS software version 9.1.
Results
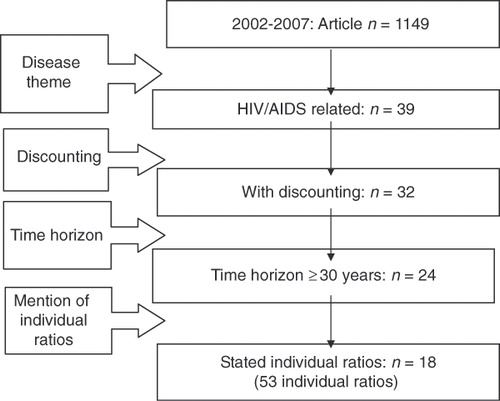
The search of the Tufts CEA Registry (Methods Step 1) identified 1,149 articles published during 2002–2007. Of these, 39 articles pertained to HIV/AIDS interventions. We eliminated seven articles because they did not appropriately discount future costs and benefits. A further eight articles were eliminated because they did not specify a time horizon of at least 30 years. Finally, we eliminated six articles because they did not separately quantify costs and QALYs gained. The remaining 18 articles reported 53 cost-effectiveness ratios ().
Figure 2. Processes of the article extraction.
plots the costs and QALY gains for these 53 ratios (Methods Step 2). The plot suggests that at least for this particular dataset, the data can be divided into two clusters: one that is close to the vertical axis, and one that is close to the horizontal axis. This clustering suggests it may be possible to identify intervention characteristics that influence cost effectiveness (i.e., it may be possible to develop a statistical model that predicts which cluster a particular cost-effectiveness ratio will tend to belong to). plots results for primary and secondary prevention interventions, while plots results for tertiary prevention interventions. As suggested by the correlation coefficients and p-values in , both the log and square root models are appropriate for these two stratified datasets. The equations for log model appear below.
The square root model equations are as follows.
Figure 3. Scatter plot and EF for HIV/AIDS. Dotted eclipses express the clusters of QALY-cost ratios.
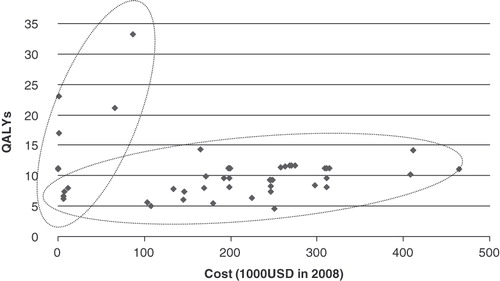
Figure 4. (a) Scatter-plot and EF for HIV/AIDS by primary/secondary prevention. (b) Scatter-plot and EF for HIV/AIDS by tertiary prevention.
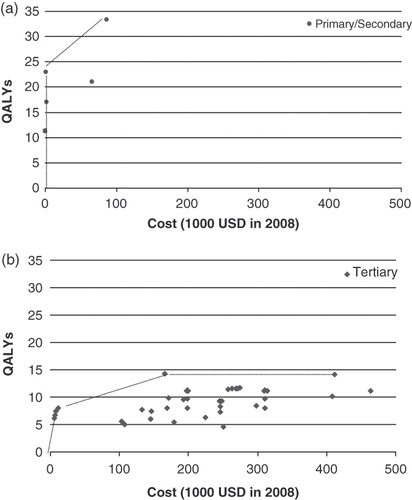
Table 1. Correlation coefficients for cost-effectiveness data stratified by prevention stage.
and illustrate these relationships.
Figure 5. Regressed multiple EFs plot for HIV/AIDS by prevention stage: log model. Equations used here are following: Primary/secondary prevention: QALY = 4.67 + 4.95ln (Cost), Tertiary prevention: QALY =−2.83 + 2.28ln (Cost).
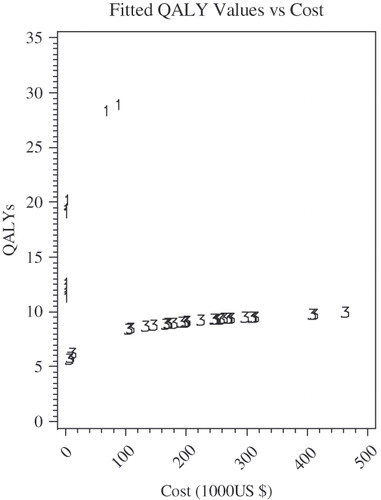
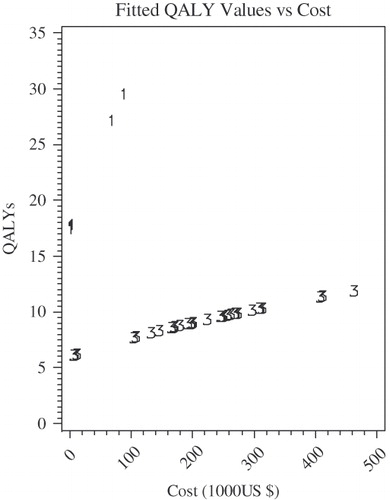
Figure 6. Regressed multiple EFs for HIV/AIDS by prevention stage: square-root model. Equations used here are following: Primary/secondary prevention: QALY = square root (312.76 + 6.63Cost), Tertiary prevention: QALY = square root (38.01 + 0.23Cost).
Neither economic development stage nor study perspective was statistically associated with cost effectiveness. We therefore did not include these characteristics in our statistical model.
Discussion
The National Institute for Health and Clinical Excellence (NICE) in the UK established the cost-effectiveness ratio (ICER) as an appropriate indicator of value. As Sculpher and Claxton, among others, have pointed outCitation12, it is not possible to compare interventions across therapeutic areas using IQWiG’s approach. Instead, IQWiG’s EF approach for the economic evaluation of medical technologies is intended to provide decision makers with flexibility to make judgments, within a disease area, that take into consideration factors other than the cost effectiveness of an intervention relative to a single cost per QALY threshold. Our study therefore presents a case analysis of the EF for HIV/AIDS interventions. Our initial motivation was to use the IQWiG guidelines, which recommend development of an EF for each therapeutic area. We successfully constructed two EF curves, one for primary and secondary prevention measures, and one for tertiary prevention measures. The development of different EF curves for different sets of therapies (in this case, prevention on the one hand, and treatment of clinically evident disease on the other) is consistent with IQWiG’s recommendation.
One challenge posed by the use of regression is the need to specify the functional form of the relationship between the dependent and independent variables. We investigated use of the log and square root functions because they are both concave and are hence consistent with economic theory, which predicts a decreasing marginal return on successive investments in health. We evaluated the fit of each function by calculating the Pearson correlation coefficient on transformations of the data that should be linear under each model. In particular, for the log model, we estimated the correlation between QALY and ln (Cost), and for the square root model, we estimated the correlation between (QALY)2 and Cost. In both cases, the correlation coefficient was statistically significant, and the magnitude of the correlation coefficient was large. Neither model was clearly superior to the other. It is, of course, too early to generalize our findings from this study of a single limited set of interventions. Analyses of other disease areas will be needed to more thoroughly investigate which functional forms are typically most appropriate.
A second challenge posed by our regression methodology is identification of appropriate criteria for stratifying the cost-effectiveness ratios when the complete set does not appear to cluster along a single, well-defined EF. In our case, visual inspection revealed prevention stage to be a promising candidate for stratifying interventions. Subsequent regression analysis verified that once the data were stratified into two groups (primary/secondary vs. tertiary), each sub-group corresponded to a separate and well-defined EF. Although the use of visual inspection worked well in this case, there is no assurance that visual inspection will be adequate for other datasets. Again, further analyses of cost-effectiveness information for other disease areas will help determine if use of visual inspection is more generally feasible.
Although the difference between the cost and price of a medical service must be carefully considered in a real-world setting, one potential application of our approach is technology price setting. The idea is that an appropriate, value-based cost (or price) for a new health technology can be determined using a parametrically specified EF curve and solving for Cost as a function of QALY. If the EF is linear, as in Equation (1), the appropriate cost of a new technology is 1/q (QALY - p). The value of Cost reflects multiple factors, including technology price. Once the appropriate value for Cost has been calculated based on the EF equation, the relationship between price and Cost can be used to determine the appropriate price. For the log EF function described in Equation (2), appropriate cost can be calculated as:
For the square root EF described in Equation (3), the corresponding equation is:
Using Equation (6), the log regression results used in this paper to characterize the EF for tertiary treatment, as specified in Equation (4b), implies that for QALY = 6, Cost = $ 48,000. For QALY = 10, Cost = $ 278,000. EF analysis would be useful for policy makers not only in the context of setting prices, but also for the purpose of evaluating the effectiveness and hence the appropriate priority that should be placed on preventive and curative measures in a specific disease area.
Our study has certain limitations. First, the analysis is based on a limited number of articles (n = 18). The limited number of studies is due in part to the fact that the Tufts CEA Registry contains only economic assessments reporting results as cost-per-QALY ratios, excluding other types of analyses (e.g., cost per life or cost per life-year assessments). The Tufts CEA registry is also limited to studies written in English. Nonetheless, the registry includes articles pertaining to more than 40 countries, and 56% of the articles pertain to countries other than the US (see https://research.tufts-nemc.org/cear4/SearchingtheCEARegistry/FAQs.aspx). On the other hand, the 18 studies we retained in our analysis reported 53 distinct ratios. Nonetheless, only a limited number of these ratios pertained to primary (n = 7) or secondary (n = 4) prevention strategies (see ). The limited number of primary and secondary prevention ratios suggests that the literature does not comprehensively explore factors influencing the cost effectiveness of primary and secondary preventive measures.
Second, the study populations may not be representative of the general population in the countries of interest. In secondary prevention, one of the articles studied patients with fever and other viral symptoms consistent with primary HIV infection in the United States, while the other article targeted the population of hospitalized patients in the United States. In this group, the prevalence of HIV is 1%, which exceeds the prevalence for American adults and adolescents in 2006 (0.45%)Citation13. Because the study populations were at elevated risk for HIV compared to the general population, the external validity of the findings might be limited.
Finally, we have no established method to detect or address confounding or effect modification when multiple factors are at play. For example, more than 70% of the ratios for primary prevention in pertain to South Africa, whereas only 10% of the tertiary prevention articles pertain to South Africa, with the remaining 90% representative of developed countries like the United States or Switzerland. Differences in the results reported by the primary/secondary prevention articles and the tertiary prevention articles may therefore be due to either differences in the interventions (primary/secondary vs. tertiary), or difference between populations in developed and developing countries.
Conclusions
This analysis reviewed the cost-effectiveness data for HIV/AIDS interventions and used regression techniques to estimate EFs. Our findings indicate that there could be multiple EFs when interventions are stratified by prevention stage for HIV/AIDS, and that regression analysis is useful for constructing parametric EF equations. The approach described in this case study may be helpful for better characterizing cost effectiveness than is possible using methods outlined by Germany’s IQWiG.
Transparency
Declaration of funding
The authors have no support or funding to report.
Declaration of financial/other relationships
Division of Medical Statistics, Graduate School of Medicine, Kobe University, Japan (MSK); The Center for the Evaluation of Value and Risk in Health, Institute for Clinical Research and Health Policy Studies, Tufts Medical Center, Boston, MA, United States (MSK, JTC, PJN); Graduate School of Health Management, Keio University, Japan (IK).
Data in this paper were presented at the 14th Annual Meeting of the International Society for Pharmacoeconomics and Outcomes Research, May 14–20, 2009, Orlando, Florida.
References
- AIDS Epidemic Update. UNAIDS, WHO, 2007
- Report on the Global Aids Epidemic, WHO, 2008
- Preventing HIV/AIDS in young people. UNAIDS, WHO, 2006
- Merson MH, Dayton JM, O’Reilly K. Effectiveness of HIV prevention interventions in developing countries. AIDS, 2000;14(Suppl 2):S68-84
- Press releases. People unaware of their HIV status could jeopardize the battle against HIV/AIDS. Fifty-ninth session of the WHO Regional Committee for the Western Pacific, 22-26 September, 2008, Manila, Philippines http://www.wpro.who.int/media_centre/press_releases/pr_20080925.htm [Accessed on March 5, 2010]
- Maclean CC, Stringer JSA. Potential cost-effectiveness of maternal and infant antiretroviral interventions to prevent mother-to-child transmission during breast-feeding. J Acquir Immune Defic Syndr 2005;38:570-7
- Schackman BR, Freedberg KA, Weinstein MC, et al. Cost-effectiveness implications of the timing of antiretroviral therapy in HIV-infected adults. Arch Intern Med 2002;162:2478-86
- Methods for assessment of the relation of benefits to costs in the German statutory health care system, Institute for Quality and Efficiency in Health Care (IQWiG), Germany. http://www.iqwig.de [Accessed on April 7, 2009]
- Center for the Evaluation of Value and Risk in Health. The Cost-Effectiveness Analysis Registry [Internet]. (Boston), Institute for Clinical Research and Health Policy Studies, Tufts Medical Center. Available from: www.cearegistry.org [Accessed on August 2, 2010]
- Cohen JT, Neumann PJ, Weinstein MC. Does preventive care save money? Health economics and the presidential candidates. N Engl J Med 2008;358:661-3
- Cohen JT, Neumann PJ. The cost savings and cost-effectiveness of clinical preventive care. Research Synthesis Report No. 18, Robert Wood Johnson Foundation, September 2009
- Sculpher M, Claxton K. Sins of omission and obfuscation: IQWiG’s guidelines on economic evaluation methods. Health Econ 2010;19:1132-6
- Centers for Disease Control and Prevention. Morbidity and Mortality Weekly Report, ‘HIV Prevalence Estimates – United States, 2006’. October 3, 2008, Atlanta, USA http://www.cdc.gov/mmwr/preview/mmwrhtml/mm5739a2.htm