Abstract
Objective:
This post hoc analysis evaluated treatment-associated quality-adjusted survival (QAS) in patients randomly assigned to temsirolimus or interferon alfa (IFN-alfa), corrected for censoring using inverse probability weighting (IPW), in the Advanced Renal Cell Carcinoma (ARCC) trial.
Methods:
Follow-up was divided into 11 time intervals; Kaplan–Meier estimates for not being censored were estimated for each interval. The QAS for each interval was weighted by the inverse probability of not being censored in that interval. Overall treatment-associated QAS was calculated as the sum of the weighted QAS across all follow-up intervals. Differences in mean QAS between temsirolimus and IFN-alfa were evaluated with t-statistics at a two-sided α = 0.05.
Results:
In total, 416 patients were randomly assigned to temsirolimus (n = 209) or IFN-alfa (n = 207); 400 patients were included in this analysis. Overall weighted mean (standard deviation) QAS during progression-free survival was 111.9 (5.3) days with temsirolimus (n = 204) and 75.7 (6.3) days with IFN-alfa (n = 196). The mean weighted QAS difference of 36.2 days in favor of temsirolimus was significant (p < 0.05).
Limitations:
One potential limitation is that the weights developed by the Kaplan–Meier estimates did not allow for covariates to be adjusted among treatment arms. Another possible limitation is that the ARCC trial included patients with advanced renal cell carcinoma, and thus it cannot be conclusively determined how our findings would apply to patients with less advanced disease.
Conclusions:
Patients with poor-prognosis advanced renal cell carcinoma treated with temsirolimus had an incremental gain of 48% (36.2 days) in QAS compared with patients treated with IFN-alfa.
Introduction
The concept of quality-adjusted survival (QAS) constitutes a well-founded method for combining quality of life (QOL) and longevity into a single measure and is often referred to as quality-adjusted life-years (QALYs)Citation1,Citation2. QAS is measured in units of time and can be used as a measure of efficacy in randomized clinical trials, particularly studies of interventions associated with significant adverse eventsCitation3. In trials involving such interventions, the question of the quantity, as well as the quality, of life is important. However, trials involving interventions with adverse events, particularly for chronic conditions, run the risk of having incomplete follow-up data on QOL measuresCitation4–6. For example, in chemotherapy trials, many patients are lost to follow-up because they refuse to attend follow-up visits, in part because they experience adverse events and/or disease progressionCitation7. Hence, traditional methods for evaluating QAS that ignore the censoring data patterns may result in biased estimates.
The censoring mechanism in most trials involving QOL measures can be considered to be missing-at-random (MAR) versus missing-completely-at-random (MCAR) or missing-not-at-random (MNAR)Citation8–10. MAR is a considerably weaker assumption, in which data are considered MAR if the probability of data being missing is related to observed data in the interval before patient attritionCitation10,Citation11. For example, if a lower QOL is observed at a designated time t, the patient is more likely to discontinue the study at time t + 1Citation11. If data are MAR, the missing data mechanism is said to be ‘ignorable’ if the parameters governing the missing data process are unrelated to the parameters to be estimatedCitation12. In most ‘real-world’ conditions, MAR and ignorability can be considered equivalentCitation12. When data are not strictly MCAR, one can use the information on the ‘missing-ness’ probabilities themselves; this is the approach taken by the inverse probability weighting (IPW) method.
The IPW approach has been proposed as an alternative to the direct methodCitation13 for evaluating QAS in the presence of censored data, which requires the assumption of censoring at the beginning or end of the interval to estimate mean QASCitation3,Citation14–16. However, there is a relative paucity of published reports of clinical studies using IPW to control for censoring in the evaluation of QAS. The central aim of this analysis was to apply the IPW method to control for censoring in the evaluation of progression-free QAS between patients randomized to treatment with the mammalian target of rapamycin kinase (mTOR) inhibitor temsirolimus or the cytokine interferon alfa (IFN-alfa).
Patients and methods
Study design and patient selection
The present post hoc analysis used data from an international, randomized, phase III study (Global Advanced Renal Cell Carcinoma [ARCC] trial; ClinicalTrials.gov study no. NCT00065468). The Global ARCC study was an open-label, parallel-assignment, safety and efficacy study of 626 patients with previously untreated, poor-prognosis, metastatic RCCCitation17. Eligible patients were enrolled from July 2003 through April 2005 and were randomly assigned to receive either 25 mg intravenous temsirolimus (CCI-779 or Torisel, Pfizer Inc., Collegeville, PA, USACitation18) weekly or 3–18 million units subcutaneous IFN-alfa (Roferon-A, Roche Pharmaceuticals, Nutley, NJ, USACitation19) three times weekly. A third group was randomized to combination therapy consisting of temsirolimus + IFN-alfa. Temsirolimus showed significantly longer overall survival than did IFN-alfa, but the combination did not show significantly longer overall survival than did IFN-alfa alone. Therefore, only temsirolimus as a single agent is approved for treatment of advanced RCC, and the current analysis focused on patients randomized to the temsirolimus and IFN-alfa treatment arms.
The primary endpoint in the clinical trial was overall survival, calculated on an intent-to-treat basis. Secondary efficacy endpoints were progression-free survival, as determined by the site investigators’ assessment and a blinded assessment of imaging studies (performed by Bio-Imaging Technologies, Inc., Newtown, PA, USA); the objective response rate; and the clinical benefit rate, defined as the proportion of patients with stable disease for at least 24 weeks or an objective response. In the current analysis, we used investigator-assessed, progression-free survival time; the rationale for this is stated below.
To be eligible for the trial, patients had to have histologically confirmed advanced RCC (stage IV or recurrent disease); a Karnofsky performance score of ≥60 (where scores range from 0 to 100, and higher scores indicate higher capacity to perform daily activities); no previous systemic treatment; a measurable tumor according to response evaluation criteria in solid tumors [RECIST]Citation20; adequate bone marrow, kidney and liver functions (cell/hemoglobin counts); and fasting levels of total cholesterol and triglycerides below specified levelsCitation17. In addition, eligible patients were required to have at least three of six predictors of short-term survival to qualify as having a poor prognosis. The six predictors included the five Memorial Sloan-Kettering Cancer Center (MSKCC) prognostic factors (<1 year from time of initial RCC diagnosis to randomization; Karnofsky performance status of 60 or 70; hemoglobin less than the lower limit of normal; corrected calcium >10 mg/dl [2.5 mmol/l]; and serum lactate dehydrogenase >1.5 times the upper limit of normal)Citation21–23. The remaining predictor was >1 metastatic organ site of disease (sites defined as different tissues with metastasis: lung, liver, bone, kidney, lymph node, etc)Citation23.
EQ-5D index and QAS assessments
Self-reported QOL was evaluated with the EuroQol Group’s questionnaire, the EuroQol-5D (EQ-5D)Citation24,Citation25. The questionnaire was administered at screening; weeks 12 and 32; any visit at which the patient reported a symptomatic grade 3 (severe) or 4 (life-threatening or disabling) adverse event (National Cancer Institute Common Terminology Criteria for Adverse Events v. 3.0), unless the medical condition prohibited using the EQ-5DCitation26; and the withdrawal visit. Because the EQ-5D was only administered before or at the time of disease progression, the current analysis focused on QAS during progression-free survival. In addition, because the investigator was administering the EQ-5D, it was more appropriate to use investigator-assessed progression-free survival time; the investigator continued to collect EQ-5D data until they felt the disease had progressed. In the present analysis, we included all patients with valid EQ-5D scores. Missing EQ-5D scores were calculated by interpolation, in which the data would lie on the line joining the two available EQ-5D scores in the calculation of QAS according to Equation 1. If the last EQ-5D score was missing, the score from the previous interval was carried forward until disease progression. If a patient experienced a fatal event, the EQ-5D score was considered to be 0 at the time of death.
Statistical analysis
The QAS is the area under the curve represented by time in days on the x-axis and EQ-5D scores on the y-axis. The area is evaluated according to the trapezoid rule:
where Qji1}, Qji2 = QAS at time point 1 and 2 for the ith patient on jth treatment, tji0, tji1, tji2 = time 0 (randomization), time 1, time 2 for the ith patient on jth treatment, mji0, mji1, mji2 = EQ-5D score (utility) at time 0, 1 and 2 for the ith patient on jth treatment. The overall QAS was the sum of QAS across individual intervals.
In the present analysis, the follow-up time was divided into 11 time intervals. The first interval had an upper limit of 1 day; this was the baseline interval, and the EQ-5D measures in this interval were primarily those at randomization. The next 9 intervals were each of 40 days. The 40-day interval length was selected to provide at least a 1-year follow-up and was considered reasonable because the mean (standard deviation [SD]) progression-free survival was 175 (159) days for patients treated with temsirolimus and 126 (148) days for patients treated with IFN-alfa. The final interval was of variable length and was taken into account only if progression-free survival was longer than 361 days (the sum of the first 10 intervals). Additional analyses were conducted in which the interval length was increased to 50 and 60 days to test the sensitivity of the results to the definition of interval length.
To account for censoring during treatment, we used the IPW method whereby the observed EQ-5D scores during each interval were weighted by the inverse of the probability of not being censored at the end of each interval (i.e., the probability of an individual being observed in a particular time interval was conditional on that individual being observed in the previous time interval). The probability of not being censored was based on Kaplan–Meier estimates for each study interval. Through this methodology, the observed QAS values are adjusted for each interval, depending on the amount of censoring that occurred during that particular interval (Appendix). Differences in mean QAS between temsirolimus and IFN-alfa were evaluated with t-statistics at a two-sided α = 0.05.
Results
Disposition
A total of 416 patients met the study inclusion criteria and were randomized to treatment with temsirolimus (n = 209) or IFN-alfa (n = 207). Of the 416 randomized patients, nine (2%) had no EQ-5D scores or a first EQ-5D score at the withdrawal visit (withdrew at baseline) and hence were excluded. Of the remaining 407 patients, five (1%) had missing baseline EQ-5D scores, and two (0.5%) had baseline EQ-5D scores obtained more than 30 days before randomization and were also excluded. The remaining 400 patients were included in the present analysis of treatment-associated QAS.
Baseline demographics
Baseline characteristics of the 400 patients in the two treatment arms included in the present analysis are listed in . Overall, the two treatment arms were well balanced in terms of demographic and clinical characteristics (disease severity). Median patient age was 59 years, and 69% of the study population was male. Most (82%) patients had a Karnofsky performance score of ≤70, indicating substantial impairment in the performance of daily activities. On the basis of MSKCC risk classification, 73% of the patients had a poor prognosis. Overall, the baseline characteristics of patients included in the present analysis were similar to the characteristics of the overall (N = 626) patients included in the phase III studyCitation17.
Table 1. Baseline characteristics.
EQ-5D (utility) measures
A total of 62.8% of the patients had EQ-5D scores for the first four time intervals. This group essentially represented the patient population that progressed rapidly in both treatment arms. The other major group of patients (10.5%) was that with EQ-5D scores for all time intervals; this represented the patient population that progressed slowly. Censoring during the different time intervals varied from 2.0% at the end of the first interval to approximately 17.5% at the end of the final time interval.
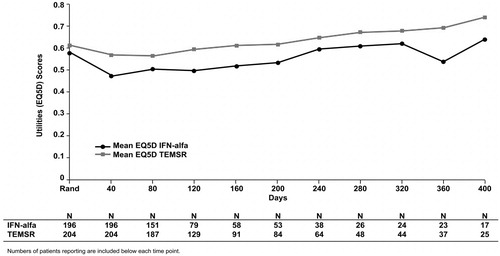
depicts mean EQ-5D score for each 40-day interval from randomization. The number of patients with an EQ-5D score at each time point decreased with time from the randomization date. Treatment with temsirolimus showed a higher mean EQ-5D score at all time intervals. Patterns similar to that in were observed when interval time was extended to 50 and 60 days (data not shown). Because the mean EQ-5D estimates were based on available data and did not account for sample-size deterioration over time (owing to censoring and disease progression), these estimates are biased.
Figure 1. Mean EQ-5D measures for IFN-alfa and TEMSR over 40-day intervals from randomization to study completion. Numbers of patients reporting are included below each time point. EQ-5D, EuroQol-5D; Rand, randomization; IFN-alfa, interferon alfa; TEMSR, temsirolimus.
Unweighted treatment-associated QAS
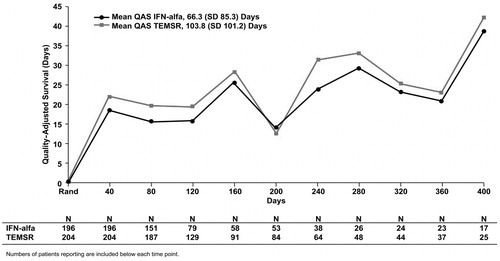
On the basis of analysis in which follow-up time was divided into equal 40-day intervals, the overall treatment-associated mean (SD) QAS during progression-free survival for patients randomized to treatment with temsirolimus compared with patients randomized to treatment with IFN-alfa was 103.8 (101.2) days vs. 66.3 (85.3) days, respectively (, p < 0.0001). The mean QAS values for the intervals 40 and 80 days from randomization were significantly higher for temsirolimus vs. IFN-alfa (p < 0.05). The mean QAS values for the intervals of 120 days from randomization and longer were not significantly different between the two treatment arms. The mean QAS during progression-free survival when the follow-up was divided into 50- and 60-day intervals was 110.1 (110.5) days and 108.2 (118.3) days, respectively, for temsirolimus vs. 69.0 (92.5) days and 68.4 (97.6) days for IFN-alfa (p < 0.0001). Similar to the EQ-5D analysis, estimates of unweighted treatment-associated QAS during progression-free survival were based on observed values and did not account for unobserved (censored) data.
Figure 2. Mean unweighted QAS values for IFN-alfa and TEMSR over 40-day intervals from randomization to study completion. Numbers of patients reporting are included below each time point. QAS, quality-adjusted survival; IFN-alfa, interferon alfa; SD, standard deviation; TEMSR, temsirolimus; Rand, randomization.
Adjusted (weighted) treatment-associated QAS
The median weight based on the Kaplan–Meier estimates for not being censored in each interval (except for the first interval [T0] where the weights were uniformly 1 because all patients had baseline EQ-5D scores) is shown in . Overall, the weights were stable for the different time intervals. The overall weighted mean (SD) QAS during progression-free survival using a fixed time interval of 40 days was 111.9 (5.3) days for the temsirolimus group and 75.7 (6.3) days for the IFN-alfa group (). The difference in the mean weighted QAS of 36.2 days in favor of temsirolimus was significant (95% confidence interval [CI] 35.1–37.3; p < 0.05). Based on the weighted QAS plot (), the temsirolimus group showed a higher QAS for all of the follow-up intervals. The mean (SD) weighted treatment-associated QAS during progression-free survival when the follow-up was divided into intervals of 50 days was 122.1 (6.5) days for temsirolimus vs. 78.0 (8.5) days for IFN-alfa (95% CI for Δ = 42.6−45.6). When the interval was increased to 60 days, the mean (SD) weighted treatment-associated QAS during progression-free survival was 124.6 (7.9) days for temsirolimus vs. 79.0 (12.0) days for IFN-alfa (95% CI for Δ = 43.6–47.6).
Figure 3. Mean weighted QAS values for IFN-alfa and TEMSR over 40-day intervals from randomization to study completion. Numbers of patients used in calculation of inverse probability weights are included below each time point. QAS, quality-adjusted survival; IFN-alfa, interferon alfa; SD, standard deviation; TEMSR, temsirolimus; Rand, randomization.
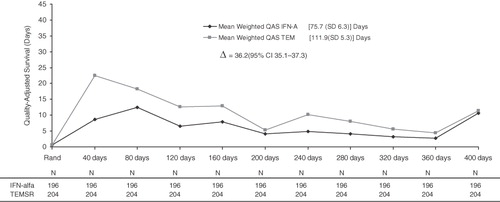
Table 2. Description of the inverse probability weighting in the two arms.
Discussion
This post hoc analysis evaluated the use of IPW to control for censoring estimates of QAS in patients with advanced, poor-prognosis RCC. The weights developed to adjust the observed EQ-5D were based on Kaplan–Meier estimates; this method of developing IP weights deviates from the methodology commonly used in developing IP weights in epidemiologic studies. In epidemiologic studies, the objective of developing IP weights is to control for confounding variables versus controlling for censoring as in our study.
The unadjusted QAS was significantly improved within 160 days after treatment with temsirolimus compared with IFN-alfa but were somewhat difficult to interpret; QAS was enhanced upon prolonged treatment with either agent (), a finding that is at variance with the chronic and progressive disease course of advanced RCC. On weighting the observed data by information from censored observations via IPW, we found initial increases in QAS within 160 days of either treatment, which subsequently fell in parallel with disease progression (). Adjusted measures supported the premise that temsirolimus treatment was associated with significant improvement in QAS (vs. IFN-alfa) at all follow-up intervals. Treatment with temsirolimus was associated with more marked improvements (vs. IFN-alfa) in both QOL and longevity in patients with advanced RCC. Results of the present study extend findings from the original analysisCitation17, which demonstrated significantly increased survival and a reduced frequency of serious adverse events with temsirolimus monotherapy compared with IFN-alfa monotherapy or the two agents combined. These are consistent with temsirolimus exerting a minimal impact on QOLCitation27.
Understanding the impact of a treatment on not only survival but also on QOL is imperative in analyses of chronic, progressive diseases such as advanced RCC, especially when treatment itself is associated with significant adverse eventsCitation3. Health outcomes scientists and policymakers rely upon QAS analyses to interpret data from randomized controlled trials comparing different treatments. A significant complication of conventional QAS analyses includes data censoring owing to both treatment-dependent and treatment-independent causesCitation1,Citation2. Such analyses are important, and studies that do not account for data censoring may culminate in an upward bias in the overall likelihood of treatment responses because of selective attrition of poor responders in such trialsCitation4. Recently, Wang and ZhaoCitation28 demonstrated improved efficiency when accounting for censored data using IPW in an analysis of simulation experiments and chemotherapeutic data. To our knowledge, the current communication thus represents only the second report of a QAS analysis of a chemotherapy trial that utilized IPW to account for data censoring.
Potential study limitations
In this post hoc analysis IP weights were developed based on Kaplan–Meier estimates, in order to control for censoring. To account for missing EQ-5D we used interpolation (except for last measure where we used last observation carried forward); alternatively we could have developed IPW weights for missing EQ-5D using logistic regression. However, the mechanism of combining weights developed by different techniques needs to be further evaluated. The use of more sophisticated approaches, such as Expectation Maximization (EM) and Repeated Measures Mixed Effects (RMME), in combination with IPW could be employed and needs to be further exploredCitation29. The weights developed via the Kaplan–Meier estimates do not allow for covariates to be adjusted among treatment arms. However, given the randomized nature of the trial, the baseline covariates were balanced in the two treatment arms. As the number of patients censored increases across follow-up intervals, the few remaining, uncensored patients can exert a disproportionately large impact on the QAS results. When the degree of censoring is very large, calculating stabilized weights can minimize this confoundCitation30. On the other hand, in the current data set, the overall rate of censoring was approximately 17.5%, and weights were stable across the different intervals.
Other limitations relate to the Global ARCC data setCitation17, which may also have affected the overall findings of our QAS analysis. Included in the primary study were patients with advanced RCC (extensive metastasis and multiple adverse prognostic indicators); hence, the degree to which our analysis might apply to data from a population with less advanced disease cannot be determined conclusively. Patients with advanced RCC may be less able to tolerate specific treatment approaches, and their tumors may be more resistant to specific chemotherapeutic agents.
Undertaking analyses of QAS is essential when comparing the outcomes of different forms of chemotherapy in randomized controlled trials. Conversely, patient-reported outcome studies that fail to consider (and account for) data censoring may result in substantial biases. The present study demonstrated that calculating IPW-adjusted QAS constitutes a viable statistical approach when comparing the efficacy profiles of different chemotherapies. The findings of our analyses are consistent with the primary study finding that temsirolimus significantly enhanced survival and was associated with reduced adverse effects (vs. IFN-alfa) in patients with poor-prognosis advanced RCC.
Conclusions
Patients with poor-prognosis, advanced RCC treated with temsirolimus had an incremental gain of 48% (36.2 days) in QAS compared with patients treated with IFN-alfa.
Transparency
Declaration of funding
This study and its report were supported by Pfizer Inc.
Declaration of financial/other relationships
S.R. is an employee of Med Data Analytics, Inc., a paid consultant for Pfizer Inc.; M.J.A. reports no potential conflicts; and all other authors were employees of the study sponsor at the time of the study.
Acknowledgments
Assistance in manuscript preparation was provided by Sara Glickstein, PhD, and Stephen W. Gutkin, Rete Biomedical Communications Corp. (Wyckoff, NJ, USA), with financial support from the study sponsor (Pfizer Inc.).
References
- Gelber RD, Gelman RS, Goldhirsch A. A quality-of-life oriented endpoint for comparing therapies. Biometrics 1989;45:781-795
- Glasziou PP, Simes RJ, Gelber RD. Quality adjusted survival analysis. Stat Med 1990;9:1259-76
- Zhao H, Tsiatis AA. Testing equality of survival functions of quality-adjusted lifetime. Biometrics 2001;57:861-867
- Shih W. Problems in dealing with missing data and informative censoring in clinical trials. Curr Control Trials Cardiovasc Med 2002;3:4
- Fielding S, Maclennan G, Cook JA, et al. A review of RCTs in four medical journals to assess the use of imputation to overcome missing data in quality of life outcomes. Trials 2008;9:51
- Sprangers MAG, Moinpour CM, Moynihan TJ, et al. Assessing meaningful change in quality of life over time: a users’ guide for clinicians. Mayo Clin Proc 2002;77:561-71
- Bernhard J, Cella DF, Coates AS, et al. Missing quality of life data in cancer clinical trials: serious problems and challenges. Stat Med 1998;17:517-32
- Fielding S, Fayers PM, Ramsay CR. Investigating the missing data mechanism in quality of life outcomes: a comparison of approaches. Health Qual Life Outcomes 2009;7:57
- Rubin DB. Inference and missing data. Biometrika 1976;63:581-92
- Schafer JL. Analysis of Incomplete Multivariate Data. Monographs on Statistics and Applied Probability 72. New York: Chapman & Hall, 1997
- Oostenbrink JB, Al MJ. The analysis of incomplete cost data due to dropout. Health Econ 2005;14:763-76
- Allison PD. Missing data. Sage University Papers Series on Quantitative Applications in the Social Sciences, 07-136. Thousand Oaks, CA: Sage Publications Inc., 2001
- Lin DY, Feuer EJ, Etzioni R, et al. Estimating medical costs from incomplete follow-up data. Biometrics 1997;53:419-34
- Zhao H, Tsiatis AA. A consistent estimator for the distribution of quality adjusted survival time. Biometrika 1997;84:339-48
- Willan AR, Lin DY, Cook RJ, et al. Using inverse-weighing in cost-effectiveness analysis with censored data. Stat Methods Med Res 2002;11:539-51
- Willan AR, Briggs AH. Statistical Analysis of Cost-Effectiveness Data. Chichester, UK: Wiley, 2006:38-40
- Hudes G, Carducci M, Tomczak P, et al. Temsirolimus, interferon alfa, or both for advanced renal-cell carcinoma. N Engl J Med 2007;356:2271-81
- Torisel® [package insert]. Philadelphia, PA: Pfizer Inc., 2010. Available at: http://labeling.pfizer.com/showlabeling.aspx?ID=490. Accessed March 1, 2011
- Roferon-A® [package insert]. Nutley, NJ: Hoffman-La Roche Inc., 2008. Available at: http://www.gene.com/gene/products/information/roferon-a/pdf/pi.pdf. Accessed March 1, 2011
- Therasse P, Arbuck SG, Eisenhauer EA, et al. New guidelines to evaluate the response to treatment in solid tumors. European Organization for Research and Treatment of Cancer, National Cancer Institute of the United States, National Cancer Institute of Canada. J Natl Cancer Inst 2000;92:205-16
- Motzer RJ, Bacik J, Murphy BA, et al. Interferon-alfa as a comparative treatment for clinical trials of new therapies against advanced renal cell carcinoma. J Clin Oncol 2002;20:289-96
- Motzer RJ, Mazumdar M, Bacik J, et al. Survival and prognostic stratification of 670 patients with advanced renal cell carcinoma. J Clin Oncol 1999;17:2530-40
- Mekhail TM, Abou-Jawde RM, BouMerhi G, et al. Validation and extension of the Memorial Sloan-Kettering prognostic factors model for survival in patients with previously untreated metastatic renal cell carcinoma. J Clin Oncol 2005;23:832-41
- The EuroQol Group. EuroQol: a new facility for the measurement of health-related quality of life. Health Policy 1990;16:199-208
- Oppe M, Rabin R, de Charro F. EQ-5D User Guide, Version 1.0. Rotterdam: The EuroQol Group, 2008
- National Cancer Institute. Cancer Therapy Evaluation Program, Common Terminology Criteria for Adverse Events, Version 3.0. 2006. Available at: http://ctep.cancer.gov/protocolDevelopment/electronic_applications/docs/ctcaev3.pdf. Accessed March 1, 2011
- Bellmunt J, Szczylik C, Feingold J, et al. Temsirolimus safety profile and management of toxic effects in patients with advanced renal cell carcinoma and poor prognostic features. Ann Oncol 2008;19:1387-92
- Wang H, Zhao H. Regression analysis of mean quality-adjusted lifetime with censored data. Biostatistics 2007;8:368-82
- Xie J, Liu C. Adjusted Kaplan-Meier estimator and log-rank test with inverse probability of treatment weighting for survival data. Stat Med 2005;24:3089-110
- Robins JM, Hernan MA, Brumback B. Marginal structural models and causal inference in epidemiology. Epidemiology 2000;11:550-60
Appendix
To evaluate QAS using the IPW method, the following is proposed based on Willan and BriggsCitation16: Let X* = min(Dji, Uji, τ), where Dji = time to death, Uji = time to censoring and τ is the duration of interest. Thus, X* is the minimum time to death, time to censoring or duration of interest. Let , that is,
if, and only if, the patient dies or if the patient is censored after being followed for the duration of interest. The IPW estimator for the mean QAS over the duration of interest is given by Equation 1.
where the divisor
is the probability of not being censored and evaluated at the end of the interval if the patient remains in the study until the end or at the time of death.
is estimated using the product limit method (Equation 2).
where
is the unique censoring time for the jth arm, and
and
are the number of patients at risk of censoring and the number of patients censored at time
, respectively. Thus, the mean difference in QAS between temsirolimus and interferon alfa-2a (Equation 3) is:
The variance of is given by Equation 4.
where
and
and
where j represents treatment (temsirolimus or interferon alfa-2a). The variance is an asymptotic normal distribution.