Abstract
Background:
With the addition of new agents for the treatment of multiple sclerosis (MS) (e.g., fingolimod), there is a need to evaluate the relative value of newer therapies in terms of cost and effectiveness, given healthcare resource constraints in the United States.
Objective:
To assess the cost-effectiveness of natalizumab vs fingolimod in patients with relapsing MS.
Methods:
A decision analytic model was developed to estimate the incremental cost per relapse avoided of natalizumab and fingolimod from a US managed care payer perspective. Two-year costs of treating patients with MS included drug acquisition costs, administration and monitoring costs, and costs of treating MS relapses. Effectiveness was measured in terms of MS relapses avoided (data from AFFIRM and FREEDOMS trials). One-way and probabilistic sensitivity analyses were conducted to assess uncertainty.
Results:
Mean 2-year estimated treatment costs were $86,461 (natalizumab) and $98,748 (fingolimod). Patients receiving natalizumab had a mean of 0.74 relapses avoided per 2 years vs 0.59 for fingolimod. Natalizumab dominated fingolimod in the incremental cost-effectiveness analysis, as it was less costly and more effective in reducing relapses. One-way sensitivity analysis showed the results of the model were robust to changes in drug acquisition costs, administration costs, and costs of treating MS relapses. Probabilistic sensitivity analysis showed natalizumab was cost-effective 95.1% of the time, at a willingness-to-pay (WTP) threshold of $0 per relapse avoided, increasing to 96.3% of the time at a WTP threshold of $50,000 per relapse avoided.
Limitations:
Absence of data from direct head-to-head studies comparing natalizumab and fingolimod, use of relapse rate reduction rather than sustained disability progression as primary model outcome, assumption of 100% adherence to MS treatment, and not capturing adverse event costs in the model.
Conclusions:
Natalizumab dominates fingolimod in terms of incremental cost per relapse avoided, as it is less costly and more effective.
Introduction
Multiple sclerosis (MS) is a chronic, disabling disease of the central nervous system, affecting 400,000 patients in the United StatesCitation1. The progression, severity, and symptoms of MS vary from patient to patient, but the disease can be grouped into four categories: relapsing–remitting MS (RRMS); primary–progressive MS; secondary–progressive MS; and progressive–relapsing MS. RRMS is the most commonly diagnosed category, affecting as many as 85% of MS patients. Patients suffering from RRMS incur episodes of neurological deterioration with subsequent periods of stability without disease progression in between exacerbationsCitation1. Relapses occur throughout the course of the disease, and the result is an accumulation of physical disability and cognitive decline. Despite the debilitating effects of the disease, life expectancy is generally not affected for patients with MSCitation2. As such, given the chronic nature of the disease and the propensity for MS to develop in young adults between the ages of 20 and 40 years, the clinical impact of the disease burden is substantial over many years of a patient’s lifeCitation3.
The economic impact of MS is also significant for patients as well as for payers. Mean total lifetime costs (including direct and indirect costs) for patients with MS have been estimated to be as high as $2.2 million per patient, based on 1994 dollarsCitation4. More than half of the costs associated with MS (57%) can be attributed to indirect costs such as lost income, equipment, and patient care (including paid formal care and unpaid informal care)Citation5. When considering direct medical costs associated with MS, drug costs account for as much as 65% of medical spending for MS patientsCitation5. From a managed care perspective, patients with MS are a contributing factor to both higher per-member costs and costs that are increasing over time. A retrospective analysis of pharmacy and medical claims data found that 12-month direct healthcare costs increased for patients with MS compared to patients without MSCitation6. A study conducted by Pope et al. found mean direct medical costs for members with MS to be two to three times higher than for members without MSCitation7. Kunze et al. analyzed cost trends and utilization of agents for the treatment of MS and found that per member per month costs increased by nearly 60% during the time period from 2004 to 2007Citation8. Schafer et al. looked at medical and pharmacy cost trends from 2006 to 2009 and found that they increased by nearly 30% per member per yearCitation9. In addition, almost 60% of the costs during all four years were attributable to pharmacy costsCitation9.
Though a significant portion of costs is attributable to drug therapyCitation9, disease-modifying therapies (DMTs) have been shown to significantly reduce the number of MS relapses in clinical trials and have subsequently become an integral component of therapy for MS patients. Reducing the number of relapses is not only beneficial for the patient, but the cost of treating MS relapses has been shown to substantially increase the cost of medical careCitation10. Costs associated with treating relapses vary based on the severity of the relapse, but can range anywhere from $243 (2002 dollars, $329 inflated to 2010 dollars) to $12,870 (2002 dollars, $17,420 inflated to 2010 dollars) per episodeCitation10,Citation11. Management strategies that can be incorporated to reduce the frequency and/or severity of relapses have the potential to reduce the overall cost burden of the diseaseCitation10.
Healthcare decision makers in the United States must continue to make coverage and reimbursement decisions under ever-increasing budget constraints. In light of the significant economic impact of MS and the evolving MS treatment landscape, there exists a need to critically evaluate DMTs in terms of cost, safety, and clinical effectiveness. Interferons and glatiramer acetate are well established in terms of efficacy and safety for the treatment of RRMS and have been available for decades as first-line therapyCitation12. The two newest agents approved for the treatment of RRMS are natalizumab and fingolimod. Natalizumab is generally recommended for patients who have had an inadequate response to, or are unable to tolerate, an alternate MS therapy. Fingolimod is the first oral agent to reduce relapses and delay disability progression in patients with relapsing forms of MSCitation13. Fingolimod was approved in the European Union for patients with highly active RRMS despite treatment with beta interferon, or in patients with rapidly evolving severe RRMS. In the United States, fingolimod was approved in 2010 for the treatment of relapsing forms of MS. While the safety profiles of beta interferons and glatiramer acetate are well known, the higher risks of potentially severe adverse events associated with fingolimod, including bradyarrhythmia and atrioventricular block at treatment initiation, infections, macular edema, respiratory effects, and hepatic effectsCitation14, as well as an observed higher rate of skin cancers in clinical trials, may lead healthcare professionals in the United States to use fingolimod as a second-line therapy until longer-term, real-world safety data are availableCitation14–17. Accordingly, there is a need to compare the relative value of newer MS therapies, such as fingolimod and natalizumab, in terms of cost, safety, and effectiveness, given the healthcare resource constraints.
Previous models comparing injectable DMTs, including natalizumab, have been developedCitation18–21. Gani et al. evaluated natalizumab compared to other injectable DMTs and found natalizumab to be the most cost-effective therapy in terms of cost per quality-adjusted life year (QALY) for patients with MS in the United KingdomCitation20. Chiao and Meyer evaluated natalizumab compared to other injectable DMTs and found natalizumab to be the most cost-effective therapy as measured by cost per relapse avoided from the perspective of a United States managed care payerCitation21. Given the cost-effectiveness demonstrated for natalizumab in the models by Gani et al. and Chiao et al., the fact that natalizumab has the highest efficacy of the injectable DMTsCitation22–27, and the recent introduction of fingolimod to the MS treatment landscape, the objective of this study was to develop an evidence-based economic model to assess the incremental cost-effectiveness of natalizumab and fingolimod, based on clinical trial data for patients with relapsing MS.
Methods
Model design
A decision analytic model was developed to estimate the cost-effectiveness of selected agents used in the treatment of relapsing MS from the perspective of a managed care organization in the United States. The time horizon for the model was a static 2 years, representing the time from initiation of therapy with the model comparator agents forward. This time period is representative of the clinical trial data used to populate the model. It is recognized that MS is a chronic disease that progresses after diagnosis throughout the remainder of a patient’s lifetime; however, extrapolations beyond the available trial data were not explored. Furthermore, this time period is representative of the interests of a United States managed care organization, in which the average duration of continuous enrollment for individuals is approximately 2 yearsCitation28. The two agents included in this model for comparison were natalizumab 300 mg administered intravenously (IV) once every 4 weeks, and fingolimod 0.5 mg administered orally once daily. Dosing for each agent was based upon the approved prescribing informationCitation13,Citation22.
The model consisted of an incremental analysis using relapse rates from published clinical trials as the measure of effectivenessCitation29,Citation30. The AFFIRM and FREEDOMS trials were pivotal phase 3 trials comparing natalizumab and fingolimod, respectively, to placeboCitation29,Citation30. Although natalizumab is indicated as second-line therapy, AFFIRM studied the use of natalizumab as first-line therapy, similar to the way fingolimod was studied in FREEDOMS. Relapse rates were selected as the primary clinical outcome of interest for inclusion in the model because relapses pose a substantial burden to the patient and are often associated with considerable use of healthcare resources. Total 2-year costs of therapy were estimated based on acquisition costs, administration costs, and monitoring costs. Adverse events were not included in the model, as serious adverse events associated with therapy are rare. Though severe adverse events such as hepatotoxicity and progressive multifocal leukoencephalopathy (PML) have occurred in patients receiving natalizumab, the incidence of PML has been estimated to be 1.06 per 1000 patients (95% confidence interval [CI]: 0.85, 1.31 in 1000 patients). As of January 2011, there were 85 cases of PML identified from 75,500 patients receiving natalizumab worldwideCitation31. To date, there is no consensus on effective management of PML, and a literature search of PubMed did not identify any studies assessing the costs associated with PML. If estimates from a study of mean expenditures in the last year of life for patients receiving hospice care ($27,426) are used as a proxy measure for costs associated with supportive care for patients who develop PML, expected costs associated with PML would be less than $30 per patientCitation32. While the clinical and humanistic impact of PML is significant, the costs associated with PML management are unlikely to have a significant economic impact on a health plan.
The relevant outcome of the model was the incremental cost per relapse avoided for natalizumab as compared to fingolimod.
Model inputs
Drug acquisition costs
The costs per package, monthly drug costs, and 2-year drug costs were determined based on the wholesale acquisition cost as of September 2010. Published prescribing information was used to determine the number of doses per package and number of packages per yearCitation13,Citation22. The model assumed there were no product rebates, discounts, or patient copays or coinsurances. Drug acquisition costs for natalizumab were calculated based on 13 packages per year, one dose per package, and a cost of $3076 per package, for a 2-year total of $79,977. Acquisition costs for fingolimod were calculated based on 13 packages per year, 28 doses per package, and a cost of $3688 per package, for a 2-year total of $95,902. Real-world adherence patterns were not available for fingolimod at the time the model was developed. To err on the side of a conservative estimate, patients were assumed to be 100% adherent to natalizumab and fingolimod in the model, thus maximizing the drug costs for each agent.
Drug administration and monitoring costs
To account for differences in the routes of administration for natalizumab (1-hour IV administration requiring supervision by a healthcare provider) and fingolimod (oral), the model only included the 2-year costs of drug administration for monthly infusions of natalizumab. Twenty-six administrations of natalizumab over the 2-year time horizon at a cost of $143.07 per administrationCitation33 yielded a total administration cost of $3720 ().
Table 1. Two-year drug administration and monitoring inputs for natalizumab and fingolimod.
As treatment patterns and monitoring parameters may differ among clinical practices, the laboratory tests, imaging studies, and/or physician office visits required or recommended (based on the prescribing information or the Risk Evaluation and Mitigation Strategy), for each agent were included in the model when possible (). No explicit recommendations regarding the frequency of laboratory monitoring are provided in the natalizumab prescribing information. However, given the possibility that administration of the agent can cause immunosuppression/infection, hepatotoxicity, or laboratory abnormalitiesCitation22, the model assumed that patients would receive a complete blood count and a liver function test at the time of therapy initiation. The model also assumed natalizumab patients would receive one magnetic resonance imaging (MRI) scan over the 2-year time period, as an MRI is recommended prior to initiating therapy with natalizumabCitation22. Natalizumab is provided through a restricted distribution program, and it is recommended that prescribers evaluate patients after 3 months and 6 months of therapy and every 6 months thereafter. Therefore, the model included a total of five neurologist visits over 2 years for patients receiving natalizumab. These assumptions were confirmed by expert opinion.
In the absence of specific monitoring criteria, the model employed conservative estimates, with assumptions validated and approved by expert opinion. For example, no explicit recommendations around the frequency of laboratory monitoring are provided in the fingolimod prescribing information. However, it was assumed that patients would receive a complete blood count at the time of therapy initiation. To calculate the number of liver function tests associated with fingolimod for the model, one test was assumed to be performed at baseline, and it was assumed that 11% of patients would receive an additional test annually for experiencing fatigue, and 8.9% of patients would receive an annual test for experiencing nausea, resulting in a total of 1.398 liver function tests per patient (1 + [2 * 11%] + [2 * 8.9%] = 1.398)Citation13,Citation30. The model assumed no MRIs were performed during the 2-year period for fingolimod, which has no specific guidelines for MRI scans in its prescribing information. In addition, although patients with MS typically have regular follow-up visits with their healthcare provider as a standard of care, there are no published guidelines or recommendations in the fingolimod prescribing information regarding the frequency of neurologist visits. Therefore, the model conservatively assumes one neurologist visit after 6 months of therapy and one every 6 months thereafter, for a total of three neurologist visits over 2 years for patients receiving fingolimod. These assumptions were confirmed by expert opinion.
The model assumes that all patients will receive an electrocardiogram prior to initiating therapy with fingolimod based on a recommendation in the fingolimod prescribing information to identify underlying risk factors for bradycardia and atrioventricular blockCitation13. In addition, the fingolimod prescribing information states that patients should be observed for 6 hours after the first dose to monitor for signs and symptoms of bradycardiaCitation13, and these costs ($96)Citation33 were incorporated into the model. Varicella zoster antibody testing and subsequent vaccination for the varicella zoster virus, when appropriate, are recommended prior to commencing therapy with fingolimodCitation13. The model assumes that approximately 10% of patients are seronegative for varicella zoster, and, thus, 0.1 patients would require varicella zoster virus antibody testing and vaccinationCitation34. Fingolimod may be associated with a decrease in pulmonary functionCitation13. Therefore, the model assumes 0.108 pulmonologist visits, spirometry tests, and diffusion lung capacity for carbon monoxide tests per patient based on the statistic that 5.4% of patients receiving fingolimod experienced dyspneaCitation20 (5.4% * 2 = 0.108). The fingolimod prescribing information suggests that an adequate ophthalmologic evaluation should be performed at baseline and 3 to 4 months after treatment initiation, and that if patients report visual disturbances while on fingolimod, additional ophthalmologic evaluation should be undertakenCitation13. In addition, MS patients with diabetes mellitus or a history of uveitis should undergo an ophthalmologic evaluation prior to initiating fingolimod and have regular follow-up ophthalmologic evaluations while receiving therapyCitation13. Therefore, the model assumes one ophthalmologist visit at baseline and one visit at 3 to 4 months, plus annual visits for the 7.8% of the population with diabetesCitation35 and the 1.6% of patients with macular edema, as reported in Kappos et al., resulting in a total of 2.188 visits per patient [1 + 1 + (2 * 7.8%) + (2 * 1.6%) = 2.188]Citation13,Citation30,Citation35. These assumptions were also confirmed by expert opinion.
Efficacy inputs
The efficacy outcome included in the model was the anticipated reduction in relapse rates during the 2-year time horizon. The definitions of clinical relapse differed slightly in AFFIRM and FREEDOMS. In AFFIRM, relapses were defined as new or recurrent neurologic symptoms, not associated with fever or infection, which lasted for at least 24 hours and were accompanied by new neurologic signs found by the examining neurologistCitation29. In FREEDOMS, relapses were defined as symptoms accompanied by an increase of at least half a point in the Expanded Disability Status Scale (EDSS) score, of 1 point in each of two EDSS functional-system scores, or of 2 points in one EDSS functional-system score (excluding scores for the bowel–bladder or cerebral functional systems)Citation30. Therefore, for comparison purposes, the model utilized the number of relapses over 2 years that occurred in the placebo treatment arms during the phase 3 clinical trials for natalizumab and fingolimodCitation29,Citation30 and the number of patients in each placebo groupCitation29,Citation30 to calculate the weighted average number of relapses per patient prior to treatment with either agent. As shown in , the weighted average number of relapses per patient prior to treatment was calculated to be 0.54.
Table 2. Total cost per patient and relapses avoided per patient.
The relative reduction in relapse rate was obtained for natalizumab and fingolimod from their respective phase 3 clinical studiesCitation29,Citation30. The number of relapses avoided with treatment was calculated as the weighted average number of relapses per patient prior to treatment, multiplied by the relapse rate reduction for natalizumab (68.1%) and fingolimod (54.0%)Citation29,Citation30. Because there are no head-to-head studies comparing the efficacy of natalizumab and fingolimod, we conducted this indirect comparison in which we adjusted for the placebo relapse rate. The number of relapses per patient that could be anticipated to occur during 2 years of therapy was then calculated as the weighted average number of relapses per patient prior to treatment, minus the number of relapses avoided with treatment ().
The cost of treating an MS relapse was also included in the model. As the severity of the relapse affects the level and intensity of management required, the cost of a relapse in the model was divided into three categories as described by O’Brien et al.: a relapse requiring low-intensity medical management (physician office visit or symptom management with medications); a relapse requiring medium-intensity medical management (emergency room [ER] visit, observational unit, or acute treatments such as IV medications [e.g. steroids] in either an outpatient or home setting); and a relapse requiring high-intensity medical management (hospitalization and subsequent care)Citation10. Costs for each of the categories were based on published literatureCitation10 and were adjusted using the Bureau of Labor Statistics’ medical care component of the Consumer Price Index from 2002 dollars to 2010 dollarsCitation11. Specific adjusted costs for each category of medical management were as follows: low-intensity, $329; medium-intensity, $2500; and high-intensity, $17,420. The proportion of patients requiring each category of care was obtained from other published sourcesCitation20 and was set at 40% for low-intensity, 40% for medium-intensity, and 20% for high-intensity medical management. The weighted average cost of managing an MS relapse was calculated as $4616. The cost of treating relapses per patient was calculated as the number of relapses per patient that could be anticipated to occur during 2 years of therapy, multiplied by the weighted average cost of managing an MS relapse.
The cost per relapse avoided was then calculated as the total 2-year cost of therapy (pharmacy costs, administration costs, monitoring costs, and cost of treating MS relapses) divided by the number of relapses avoided over 2 years. The incremental cost per relapse avoided was calculated as the difference between natalizumab and fingolimod in the total 2-year cost of therapy divided by the difference between natalizumab and fingolimod in the number of relapses avoided over 2 years.
Sensitivity analysis
A one-way sensitivity analysis was performed to determine the impact of varying model inputs on the cost-effectiveness of natalizumab. Each model input (relapse rate reduction, drug acquisition costs, drug administration costs, and cost of treating MS relapses) was varied around the base-case value, while keeping other inputs constant, to determine the effect on the incremental cost per relapse avoided. The relapse rate reduction for natalizumab and fingolimod were varied around the base-case according to the 95% CIs reported in the clinical trials. The values for the cost of treating MS relapses were based on calculated 95% CIsCitation10. The drug acquisition costs and drug administration costs were varied around the base-case ± 10%. The inputs utilized for the one-way sensitivity analysis are shown in .
Table 3. Inputs for one-way sensitivity analysis.
In addition, a probabilistic sensitivity analysis was conducted to assess the joint uncertainty of all model parameters simultaneously. Relative relapse rate reductions were modeled using a log-normal distribution, costs were modeled using normal distributions, the proportion of patients receiving low-, medium-, and high-intensity medical management for MS relapses was modeled using a Dirichlet distribution, and the monitoring resources utilized were modeled using gamma distributions. The parameter ranges for the probabilistic distributions were determined using the 95% CIs, where data were available (relative relapse rate reductions and cost of treating MS relapses). For drug acquisition and administration costs, it was assumed that the 95% CI was equivalent to ±10% of the base-case value. For resource utilization inputs, it was assumed that the 95% CI was equivalent to ±50% of the base-case value, to reflect the greater uncertainty around these parameters. The probabilistic sensitivity analysis was run with 1000 Monte Carlo simulations, and a cost-effectiveness acceptability curve was generated over a range of willingness-to-pay (WTP) thresholds for an MS relapse avoided from $0 to $100,000 per relapse.
Results
The 2-year costs per patient, number of relapses avoided per patient, and cost per relapse avoided are shown in . While natalizumab is associated with administration costs and higher monitoring costs, it had the lowest average cost-effectiveness ratio in terms of reducing relapses over 2 years. The 2-year drug costs and the cost associated with managing MS relapses per patient were higher for fingolimod than for natalizumab, making the total 2-year cost per patient higher for fingolimod ($98,748) vs natalizumab ($86,461), with the discrepancy largely attributable to drug costs. The incremental cost-effectiveness ratio (ICER) analysis showed that natalizumab dominates fingolimod, as it is less costly (a difference of $12,287) and more effective (0.15 more relapses avoided) over 2 years ().
Figure 1. Cost-effectiveness plane.
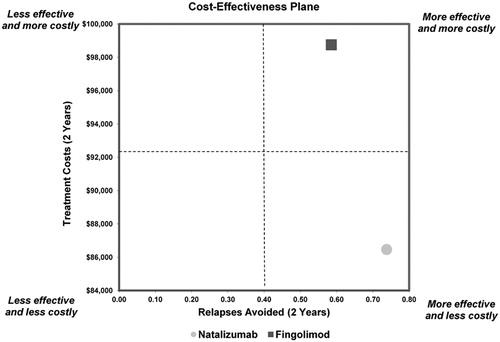
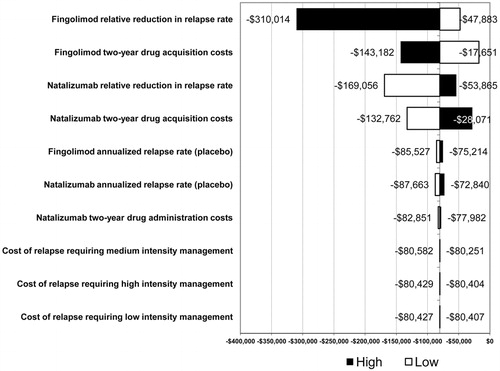
The results of the one-way sensitivity analysis are shown in . The model inputs with the greatest influence on the ICER for natalizumab and fingolimod were fingolimod relative reduction in relapse rate, fingolimod 2-year drug acquisition costs, natalizumab relative reduction in relapse rate, and natalizumab 2-year drug acquisition costs. The cost of relapses requiring low-, medium-, and high-intensity management had a minor impact on the results, changing the ICER by less than $200. Resource utilization for patient monitoring had a negligible impact on the results, and, therefore, these results are not shown. None of the parameters over the range of tested values changed the results of the analysis, which found that natalizumab was more effective and less costly than fingolimod.
Figure 2. One-way sensitivity analysis results.
The probabilistic sensitivity analysis resulted in a mean cost for natalizumab of $86,595 (95% CI: $77,790, $94,725) and a mean cost for fingolimod of $98,696 (95% CI: $89,456, $108,521). Effectiveness was also robust, with the probabilistic analysis yielding 0.74 relapses avoided per patient for natalizumab (95% CI: 0.62, 0.87) and 0.59 relapses avoided per patient for fingolimod (95% CI: 0.46, 0.74). Additional results from the probabilistic sensitivity analysis found that in 97.5% of simulations natalizumab was less costly, in 97.7% of simulations it was more effective, and in 95.4% of simulations it was dominant compared to fingolimod. Furthermore, natalizumab was cost-effective 95.1% of the time, at a WTP threshold of $0 per relapse avoided, increasing to 96.3% of the time at a WTP threshold of $50,000 per relapse avoided.
Discussion
This model estimated the incremental cost per relapse avoided of natalizumab and fingolimod from a United States managed care payer perspective. Results of the model demonstrated that natalizumab dominated fingolimod, as it was less costly and more cost-effective over a 2-year time horizon. The difference in the total 2-year cost of therapy per patient was primarily attributable to drug costs; $79,977 for natalizumab vs $95,902 for fingolimod. The difference in drug costs outweighed the higher administration and monitoring costs associated with natalizumab. Furthermore, natalizumab was more effective with 0.74 relapses avoided per patient compared to 0.59 relapses avoided per patient for fingolimod. Sensitivity analyses demonstrated the model was robust, as none of the parameters across the range of values tested in the one-way sensitivity analysis changed the results of the model. The probabilistic sensitivity analysis further demonstrated the robustness of the model based on the mean cost and effectiveness values calculated. In the case of a more costly and more effective therapy, cost-effectiveness analyses must be evaluated with reference to a decision maker’s WTP threshold for the outcome in question. However, the fact that natalizumab was found to dominate fingolimod in this analysis obviates the need to identify a specific WTP threshold per relapse avoided.
Although other models examining the cost-effectiveness of MS treatments have been developed, to the best of our knowledge, our model is the first to compare the only approved oral agent and an injectable agent for the treatment of relapsing MS. Given differences in comparators, methodological design, and model assumptions, it may be difficult to compare our model to other published models examining the cost-effectiveness of agents used for the treatment of MS. Goldberg et al. evaluated first-line injectable DMTs used for the treatment of relapsing MS in terms of cost per relapse avoided over a 2-year time horizon, using methodology similar to our modelCitation18. Other studies have evaluated natalizumab against other injectable DMTs. Gani et al. examined the cost-effectiveness of natalizumab as compared to the other injectable DMTs with regard to estimating transitions between disability states and the probability of relapse within each stateCitation20. Using QALYs as the outcome measurement, they determined that natalizumab may be a cost-effective therapy for patients with MS in the United KingdomCitation20. Natalizumab is the only MS treatment approved by the United Kingdom National Institutes of Clinical Excellence for the management of highly active RRMSCitation36. Chiao and Meyer found natalizumab to be the most cost-effective therapy with regard to relapses avoided when modeled against other available injectable DMTs, including IFNβ-1a 30 µg intramuscular once weekly, IFNβ-1b 0.25 mg subcutaneous (SC) every other day, glatiramer acetate 20 mg SC once daily, and IFNβ-1a 44 µg SC three times weekly, from the perspective of a United States managed care payerCitation21. In their study, the cost per relapse avoided was $56,594 for natalizumab and ranged from $87,791 to $103,665 for the other DMTsCitation21.
MS is a chronic, disabling, costly disease that is often diagnosed in the mid-years of life. As the life expectancy of patients with MS is not typically reduced, the impact of MS is often felt over several years of the patient’s life. As a result, healthcare decision makers in the United States may incur costs associated with these patients over several decades. Given that healthcare resources are constrained, these healthcare decision makers are often looking for opportunities to manage certain therapeutic categories, including MS, in an attempt to control costs.
In addition, as more agents become available for the treatment of MS, demonstrating clinical efficacy while controlling costs will be important to United States healthcare decision makers. With the new oral agent fingolimod entering the treatment landscape for MS, questions will arise as to the potential benefits an oral therapy may bring as compared to the physician- and self-administered injectable therapies that are already approved to treat MS. Adherence to therapy for MS has traditionally been considered poor, and there is discussion among healthcare professionals as to how the introduction of an oral agent may change this dynamicCitation37,Citation38. Adherence rates for injectable agents used for the treatment of MS have been reported to range from 50% to 80%Citation37. Reasons cited for nonadherence to injectable MS therapies include a lack of treatment efficacy (perceived and real), adverse events from therapy, costs, and injection anxietyCitation38. Debate surrounds the claim that injection anxiety contributes to nonadherence. A study by Treadway et al. found that injection anxiety was not a mitigating factor for nonadherence. Reasons cited in the study for nonadherence included ‘forgot to take,’ ‘didn’t feel like it,’ and ‘tired of shots’Citation39. ‘Forgot to take’ is of particular concern for patients with MS, as cognitive impairment is often a manifestation of the diseaseCitation40. Natalizumab has the advantage of being administered as an IV infusion every 4 weeks under the supervision of a healthcare professional, thus eliminating the need for patients to remember to take an oral agent on a daily basis. Patients with MS receiving natalizumab may have improved adherence, because if they do not show up to receive their natalizumab infusion, the healthcare professional is aware and may potentially follow up with patients to remind them that they are due for their next natalizumab infusion. The ability of healthcare professionals to monitor whether patients have taken their daily oral medication, and to intervene if they have not, is limited. Until studies pertaining to adherence with the oral MS agent fingolimod can be conducted, this point remains unclear. However, under the assumption that natalizumab has a higher adherence rate than fingolimod, our model may be considered to have used a conservative approach by assuming 100% adherence for both natalizumab and fingolimod.
In the absence of head-to-head comparative data between natalizumab and fingolimod, a decision analysis such as this provides insight into a comparison of the efficacy and costs associated with each of the therapies. This insight may be used to guide healthcare decision makers with regard to evaluating the benefits of one therapy vs the other. The results of this model demonstrate that natalizumab is a less costly, more effective therapy than fingolimod for patients with relapsing MS and is still a viable therapeutic option for patients with relapsing MS.
Limitations
The first limitation of the model was the absence of direct head-to-head studies comparing natalizumab and fingolimod. Relapse rates used in the model were derived from the respective clinical trials for natalizumab and fingolimod. Therefore, differences in study designs, study procedures, or baseline characteristics may have had an impact on these rates, and results should be interpreted with this in mind. However, the analysis attempted to control for these differences through the use of placebo-adjusted rates. In addition, the definition of relapse in FREEDOMS includes an increase in EDSS score. However, relapses do not significantly impact the progression of sustained disabilityCitation41,Citation42 and, thus, the relapse rate in FREEDOMS may be underreported. Our model therefore used a conservative estimate by assuming that the relapse rates in AFFIRM and FREEDOMS were commensurable. Due to the lack of head-to-head data for natalizumab and fingolimod, use of the relative reduction in relapse rate was thought to be most appropriate and has been used in other models, such as the model by Goldberg et al.Citation18. Furthermore, extensive sensitivity analyses were conducted to demonstrate the robustness of the model to changes in inputs, such as the relative reduction in relapse rate.
The second limitation was the use of relapse rate reduction as the primary outcome of the model, rather than sustained disability progression. Disability progression varies among patients, and operational definitions for disability progression were not consistent between natalizumab and fingolimod clinical trialsCitation29,Citation30. The economic impact of an MS relapse does not fully represent the burden of this chronic, debilitating disease that results in disability progression over time. Prevention of long-term disability progression has been established as the most important therapeutic goal by the American Academy of NeurologyCitation43. Although long-term measures of cost-effectiveness may be appropriate for chronic conditions such as MS, the authors felt that the cost per relapse avoided may be most relevant to a United States healthcare system because it is a short-term measure of cost-effectiveness and, although this may not be as common in members with chronic conditions, the mean length of continuous health plan enrollment is approximately 2 yearsCitation28.
The third limitation of the model is that it assumes patients are 100% adherent to treatment, and relapse rates are calculated as such. Adherence data for natalizumab and fingolimod were not available at the time this model was developed. In theory, natalizumab may have a higher adherence rate than other therapies as a result of the administration requirements that mandate the once-monthly IV infusion under the supervision of a healthcare professional. The administration of natalizumab by a healthcare professional may increase the likelihood that patients receive treatment compared to a self-administered oral agent that must be taken once daily. However, given the lack of available adherence data, the model assumed 100% adherence for both agents.
The fourth limitation, as described previously in the Model Design section, was that the costs of adverse events were not captured in the model. PML has occurred in patients treated with natalizumab; however, the costs associated with managing PML would be expected to have minimal impact on costs to a health plan due to the rare occurrence of this serious adverse event. In addition, although fingolimod is associated with adverse events such as reduction in heart rate, atrioventricular block, infection, macular edema, and a decrease in pulmonary function tests, until it has been on the market for a longer period of time and phase 4 data are collected, it is unclear how these potential adverse events may affect health plan costs or if any other adverse effects will be characterized.
Conclusions
The results of this model suggest that natalizumab is less costly and more effective compared to the oral agent fingolimod for the treatment of patients with relapsing MS. In the absence of head-to-head comparisons between agents, economic models may be useful tools for United States payers facing the challenges of offering the best care for patients under limited financial resources.
Transparency
Declaration of funding
Funding source: Biogen Idec Inc., Weston, MA, USA.
Declaration of financial/other relationships
S.A. is employed by Biogen Idec Inc. R.M.M. was a paid consultant to Biogen Idec for the purposes of this project. K.M., K.O’D., and M.F. are employed by Xcenda, a consulting company which provides services to Biogen Idec and other pharmaceutical manufacturers.
Acknowledgements
Kylie Matthews, an employee of Xcenda, provided copyediting support and formatted the manuscript for submission to the Journal of Medical Economics.
Previously presented at the Academy of Managed Care Pharmacy 23rd Annual Meeting & Showcase, April 27–29, 2011, Minneapolis, MN, USA.
References
- National Multiple Sclerosis Society. Who gets MS? Available at: http://www.nationalmssociety.org/index.aspx [Last accessed 10 December 2010]
- Wingerchuck DM, Weinshenker BG. Multiple sclerosis: epidemiology, genetics, classification, natural history, and clinical outcome measures. Adv Mult Scler 2000;10:611-23
- Ryan M, Piascik P. Providing pharmaceutical care to the multiple sclerosis patient. J Am Pharm Assoc 2002;42:753-67
- Whetten-Goldstein K, Sloan FA, Goldstein LB, et al. A comprehensive assessment of the cost of multiple sclerosis in the United States. Mult Scler 1998;4:419-25
- Prescott JD, Factor S, Pill M, et al. Descriptive analysis of the direct medical costs of multiple sclerosis in 2004 using administrative claims in a large nationwide database. J Manag Care Pharm 2007;13:44-52
- Asche CV, Singer ME, Jhaveri M, et al. All-cause health care utilization and costs associated with newly diagnosed multiple sclerosis in the United States. J Manag Care Pharm 2010;16:703-12
- Pope GC, Urato CJ, Kulas ED, et al. Prevalence, expenditures, utilization, and payment for persons with MS in insured populations. Neurology 2002;58:37-43
- Kunze AM, Gunderson BW, Gleason PP, et al. Utilization, cost trends, and member cost-share for self-injectable multiple sclerosis drugs – pharmacy and medical benefit spending from 2004 through 2007. J Manag Care Pharm 2007;13:799-806
- Schafer JA, Gunderson BW, Gleason PP. Price increases and new drugs drive increased expenditures for multiple sclerosis. J Manag Care Pharm 2010;16:713-17
- O’Brien JA, Ward AJ, Patrick AR, et al. Cost of managing an episode of relapse in multiple sclerosis in the United States. BMC Health Serv Res 2003;3:17-28
- US Bureau of Labor Statistics. Consumer Price Index – July 2010. Washington, DC: US Bureau of Labor Statistics
- Kieseier BC, Stüve O. A critical appraisal of treatment decisions in multiple sclerosis – old versus new. Nat Rev Neurol 2011;7:255-62. [Epub 2011 Apr 5]
- Gilenya (fingolimod) [package insert]. East Hanover, NJ: Novartis, 2010
- Gilenya Risk Evaluation and Mitigation Strategy (REMS). Novartis Pharmaceuticals Corporation. Approved REMS dated September 21, 2010
- Cohen JA, Barkhof F, Comi G, et al; for the TRANSFORMS study group. Oral fingolimod or intramuscular interferon for relapsing multiple sclerosis. NEJM 2010;362:402-15
- Comi G, O’Conner P, Montalban X, et al. Phase II study of oral fingolimod (FTY720) in multiple sclerosis: 3-year results. Mult Scler 2010;16:197-207
- Portaccio E. Evidence-based assessment of potential use of fingolimod in treatment of relapsing multiple sclerosis. Core Evidence 2010;6:13-21
- Goldberg LD, Edwards NC, Fincher C, et al. Comparing the cost-effectiveness of disease-modifying drugs for the first-line treatment of relapsing–remitting multiple sclerosis. J Manag Care Pharm 2009;15:543-55
- Bell C, Graham J, Earnshaw S, et al. Cost-effectiveness of four immunomodulatory therapies for relapsing–remitting multiple sclerosis: a Markov model based on long-term clinical data. J Manag Care Pharm 2007;13:245-61
- Gani R, Giovannoni G, Bates D, et al. Cost-effectiveness analyses of natalizumab (Tysabri) compared with other disease-modifying therapies for people with highly active relapsing–remitting multiple sclerosis in the UK. Pharmacoeconomics 2008;26:617-27
- Chiao E, Meyer K. Cost effectiveness and budget impact of natalizumab in patients with relapsing multiple sclerosis. Curr Med Res Opin 2009;25:1445-54
- Tysabri (natalizumab) [package insert]. Cambridge, MA, USA: Biogen Idec, Inc., 2010
- Avonex [package insert]. Cambridge, MA, USA: Biogen Idec, Inc., 2008
- Betaseron [package insert]. Montville, NJ, USA: Bayer HealthCare Pharmaceuticals Inc., 2010
- Copaxone [package insert]. Kansas City, MO, USA: Teva Neuroscience, Inc., 2009
- Extavia [package insert]. East Hanover, NJ, USA: Novartis Pharmaceuticals Corporation, 2009
- Rebif [package insert]. Rockland, MA, USA: Serono, Inc., 2009
- Joyce AT, Iacoviello JM, Nag S, et al. End-stage renal disease – associated managed care costs among patients with and without diabetes. Diabetes Care 2004;27:2829-35
- Polman CH, O’Connor PW, Havrdova E, et al; AFFIRM Investigators. A randomized placebo-controlled trial of natalizumab for relapsing multiple sclerosis. N Engl J Med 2006;354:899-910
- Kappos L, Radue W, O’Connor P, et al. A placebo-controlled trial of oral fingolimod in relapsing multiple sclerosis. N Engl J Med 2010;362:387-401
- Biogen Idec Med Info. PML incidence in patients receiving Tysabri. Available at: https://medinfo.biogenidec.com [registration required] [Last accessed 27 January 2011]
- Campbell DE, Lynn J, Louis TA, et al. Medicare program expenditures associated with hospice use. Ann Intern Med 2004;140:269-77
- Centers for Medicare & Medicaid Services. Physician Fee Schedule, 2010 (210B file). Available at: http://www.cms.gov/pfslookup/02_PFSsearch.asp [Last accessed 28 February 2011]
- Kilgore PE, Kruszon-Moran D, Seward JF, et al. Varicella in Americans from NHANES III: implications for control through routine immunization. J Med Virol 2003;70(Suppl 1):S111-18
- Centers for Disease Control and Prevention. National diabetes fact sheet: general information and national estimates on diabetes in the United States, 2007. Atlanta, GA, USA: U.S. Department of Health and Human Services, Centers for Disease Control and Prevention, 2008
- Multiple sclerosis – natalizumab: natalizumab for the treatment of adults with highly active relapsing–remitting multiple sclerosis. National Institute for Health and Clinical Excellence (NICE), August 2007. Available at: http://www.nice.org.uk/Guidance/TA127 [Last accessed 28 February 2011]
- Fox EJ. Emerging oral agents for multiple sclerosis. Am J Manag Care 2010;16:S219-S26
- Lipsy R. Will the newer oral MS agents be welcomed by managed care organizations? Am J Manag Care 2010;16:S227-S33
- Treadway K, Cutter G, Salter A, et al. Factors that influence adherence with the disease-modifying therapy in MS. J Neurol 2009;256:568-76
- Rao SM. Neuropsychology of multiple sclerosis. Curr Opin Neurol 1995;8:216-20
- Confavreux C, Vukusic S, Moreau T, et al. Relapses and progression of disability in multiple sclerosis. N Engl J Med 2000;343:1430-8
- Young PJ, Lederer C, Eder K, et al. Sylvia Lawry Centre for Multiple Sclerosis Research. Relapses and subsequent worsening of disability in relapsing–remitting multiple sclerosis. Neurology 2006;67:804-8
- American Academy of Neurology Guidelines 2002. Available at: http://www.aan.com/go/practice/guidelines [Last accessed 28 February 2011]